Abstract
Exosomes, recently re-named “small extracellular vesicles” or “sEV,” are emerging as an intercellular communication system. Quantification of the molecular cargo exosomes carry by on-bead flow cytometry is needed for defining their role in information transfer and in human disease. Exosomes (sEV) isolated from cell supernatants or plasma of cancer patients by size exclusion chromatography were captured by biotinylated antibodies specific for antigens in the exosome cargo (e.g., tetraspanins) and placed on streptavidin-labeled beads. Detection was performed with pre-titered fluorochrome-labeled antibodies of desired specificity. The data were acquired in a conventional cytometer, and MESF beads were used to quantify the number of fluorescent molecules bound per bead. Isotype antibody controls were obligatory. The mean fluorescence intensity (MFI) value of each sample was converted into MESF units, and the separation index (SI), which quantifies separation of stained and isotype control beads, was determined. Various proteins identified by labeled antibodies were quantified on the surface of tumor cell-derived exosomes. To identify intravesicular cargo, such as cytokines or chemokines, exosomes were lysed with 0.3% Triton-100, and the proteins in lysates were loaded on aldehyde/sulfate latex beads for flow cytometry. Examples of quantitative surface and/or intravesicular on-bead flow cytometry for exosomes produced by various cells or present in body fluids of cancer patients are provided. On-bead flow cytometry standardized for use with conventional cytometers is a useful method for protein detection and quantitation in exosomes isolated from supernatants of cell lines or plasma of patients with cancer.
Keywords: exosomes, sEV, on-bead flow cytometry, protein quantification, mean fluorescence intensity (MFI), separation index (SI), antibody-based capture, MESF
Introduction
Exosomes are small nano-sized vesicles (30–150nm) that represent a subset of extracellular vesicles (EVs) and that differ from other EVs by their origin from the multivesicular bodies (MVBs) of parent cells and by unique cargo characteristics, including tetraspanins (CD9, CD63, CD31) and endocytic markers such as TSG101 or ALIX (1,2). Exosomes are frequently also referred to as “small extracellular vesicles” or “sEV”. Exosomes are released by all cell types and are in all body fluids, but stressed cells, especially cancer cells, produce and release more exosomes than normal cells (3). Exosomes serve as an intercellular communication system: they carry and deliver signals from the parent to various recipient cells located at near or distant sites (4). Immune cells are highly responsive to exosomes, and in the tumor microenvironment (TME), immune cell functions are reprogrammed by tumor-derived exosomes, which we have dubbed as TEX (1,5). Interestingly, TEX can deliver suppressive as well as stimulatory signals to different subsets of immune cells, and the molecular cargo TEX carry and deliver determines the functional status of responder cells. Thus, in cancer, TEX serve to convey messages from tumor to normal cells that result in altered functions and the promotion of tumor progression (6).
Exosomes carry a rich molecular/genetic cargo that includes cellular proteins, mRNA, miRNA and DNA (6,7). Embedded in the exosome surface membrane are biologically active ligands and enzymes which play a key role in modulation of anti-tumor immune responses. The intra-vesicular exosome content delivered to recipient cells following exosome internalization is also responsible for functional re-programming of recipient cells by mechanisms that are not yet clear. Exosome interactions with recipient cells and mechanistic underpinnings of the transfer of exosome cargos between exosomes and recipient cells can vary. Exosome uptake appears to be regulated at the level of recipient cells. For example, it has been reported that exosomes mainly interact with T-cells through receptor-ligand interactions (8), whereas interactions with antigen presenting cells (APCs), result in exosomes uptake by endocytosis or phagocytosis (9). The initial exosome-recipient cell contact is likely to be driven by the cargo on the surface of exosomes that might simultaneously engage various receptors on recipient cells (8,9).
To investigate the surface cargo of exosomes, we and others have resorted to flow cytometry analysis, thus replacing semi-quantitative western blots broadly used for exosome characterization (10,11). The existing reports indicate that analysis of exosomes with bead-based assays using conventional flow cytometers might have sufficiently high sensitivity that is necessary for measuring exosome cargos (12,13). The challenge is the small size of the exosomes, in the range of virus particles, as compared to much larger cells. We have previously reported that bead-based assays utilizing conventional cytometers allow for the detection and quantitative measurements of proteins on the surface of exosomes (11). However, performing on-bead flow cytometry with exosomes using conventional cytometers requires carefully executed titrations of the beads/Abs/exosome ratios, instrument calibration and informed data interpretation. A reliable, standardized procedure for exosome protein detection and quantification by flow cytometry is required for comparisons of results between various laboratories. Here, we present and evaluate the usefulness of the on bead-flow cytometry method for the protein detection and quantitation in exosomes isolated from supernatants of cell lines or plasma of patients with cancer.
Materials and Methods
Exosome isolation from human plasma by size-exclusion chromatography (SEC)
The size exclusion chromatography (SEC) method for exosome isolation was optimized for routine high-throughput use as previously described (14,15) (EV-TRACK ID: EV160007). Briefly, plasma samples or concentrated cell supernatants (freshly harvested or banked) were pre-cleared by centrifugation first at 2,000×g for 10min at room temperature (RT) and then for 30min at 10,000–12,000×g at 4°C. Next, the specimens were ultrafiltered using a 0.22μm filter (EMD Millipore, Billerica, MA). A 1 mL aliquot of plasma or supernatant was placed on a mini-SEC column and eluted with PBS. A series of mini-SEC columns can be run in parallel, allowing for processing of larger sample volumes. For each mini-SEC column, the 4th 1mL-void volume fraction enriched in exosomes was collected. The fraction #4 contained non-aggregated, morphologically intact exosomes that were partly depleted of plasma proteins which elute in later fractions, as previously reported (14). The protein concentration of the isolated exosome fraction #4 was determined using a Pierce BCA protein assay kit (Pierce Biotechnology, Rockford, lL) according to the manufacturer’s instructions. Exosomes were concentrated using Vivaspin 500 (VS0152, 300,000 MWCO, Sartorius, Göttingen, Germany). For FACS analysis, samples containing 5–10μg of exosome protein in 100μL of PBS were used.
Scanning electron microscopy (SEM) of exosomes
Exosomes captured on magnetic beads were fixed in 4% glutaraldehyde (in PBS) for 30min at RT. The beads were washed x3 in PBS and cytospun on epoxy silane coated glass slides (Nexterion, Schott AG). To characterize the beads, slides were air-dried overnight and gold-coated using a Pelco SC-6 sputter coater (Ted Pella, Inc., Redding, CA). Imaging was performed using an FEI Quanta 200 FEG SEM (Thermo Fisher Scientific, Waltham, MA) at Carnegie Mellon University Materials Characterization Facility.
Flow cytometry for detection of surface proteins on exosomes
For on-bead flow cytometry of exosomes, the method described by Morales-Kastresana (12) was modified and used as previously described by us (11).
1. Exosome capture on magnetic beads
For detection of exosome-associated surface proteins by flow cytometry, exosomes were first captured on 3μm-sized ExoCap™ Streptavidin magnetic beads (MBL International, Woburn, MA). Exosomes (5–10μg/100uL PBS in 0.5mL Eppendorf microfuge tubes) were co-incubated with biotin-labeled mAbs for 2h at RT. Next, an aliquot of beads (titrated for use individually with every biotinylated Ab) was added and the tubes were again incubated for 2h at RT (Figure 1A). Titrations of the beads, Abs and exosomes to establish the optimal Ab-on-beads/exosome ratios are obligatory. Samples were washed 1x with dilution buffer from the kit using a magnet (Figure 1A) and blocking was performed with mouse serum for 30min on a shaker. Blocking buffer containing BSA can be used as well, but in our experience, blocking with mouse serum shows reduced background.
Figure 1: Immune capture and detection of the exosome cargo by on-bead flow cytometry.
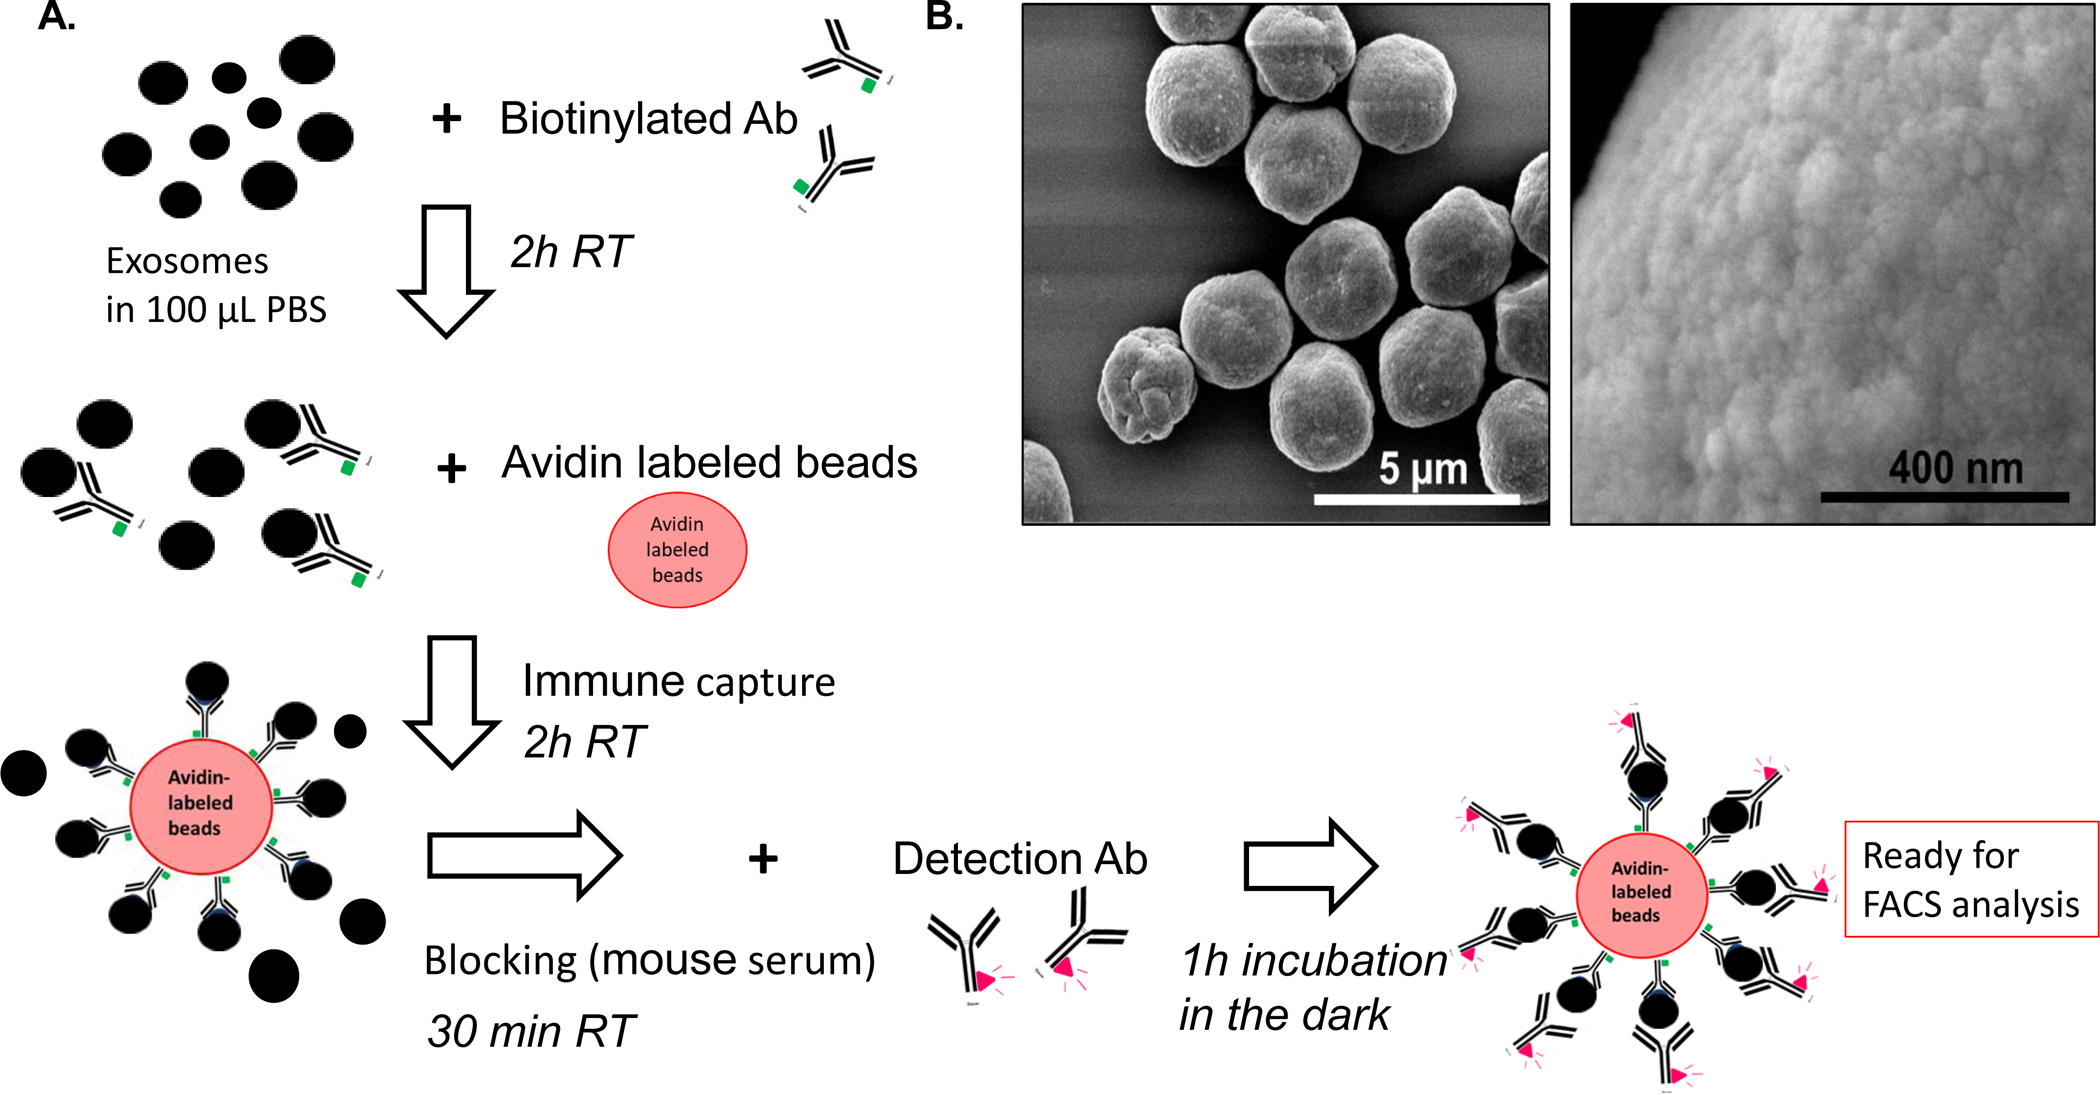
A: A schema for the capture of exosomes onto beads and antigen detection on exosomes. After exosome isolation from plasma via SEC, immune capture with a biotinylated Ab (e.g., anti- CD63 Ab) is followed by incubation with streptavidin beads. For antigen detection, exosome/Ab/bead complexes are incubated with fluorochrome-conjugated detection Ab, and MFI of the targeted antigen is determined by on-bead flow cytometry. B: Visualization of exosomes captured on beads via scanning electron microscopy (SEM). Note an excess of exosomes that are packed on beads. Titrations of exosomes and beads are necessary to avoid excessive exosome “crowding” on the bead surface.
2. Antibodies used for exosome capture
Monoclonal antibodies (mAbs) 763.74 and 225.28 which recognize distinct and spatially distant epitopes of CSPG4 were generated and characterized (16). The mAbs were purified from ascitic fluids by affinity chromatography on Protein G. The purity and activity of mAbs were assessed by SDS-PAGE and by binding assays with CSPG4-expressing cells. CD63-specific mAb (clone H5C3) and CD81-specific mAb (clone 5A6) were both purchased from Biolegend (San Diego, CA). For immunocapture of exosomes, anti-CSPG4 mAbs and anti-CD63 mAb were biotinylated using a one-step antibody biotinylation kit purchased from Miltenyi Biotec (Auburn, CA) as recommended by the manufacturer.
3. Flow cytometry-based detection of antigens on exosomes
The exosome/Ab/bead complexes were incubated with the pre-titered fluorochrome-conjugated Abs for 1h at RT. After washing × 3 with PBS, detection was performed immediately using the Gallios flow cytometer equipped with Kaluza 1.0 software (Beckman Coulter, Indianapolis, Indiana). Samples were run for 2min and approximately 10,000 events were acquired. Gates were set on the bead fraction using forward light scatter doublet discrimination (Figure 2) or forward and side light scatter. When using a conventional flow cytometer, it is important to set the gates for detection of small-sized events in the range of 3μm.
Figure 2. Gating strategy for exosomes on beads and controls.
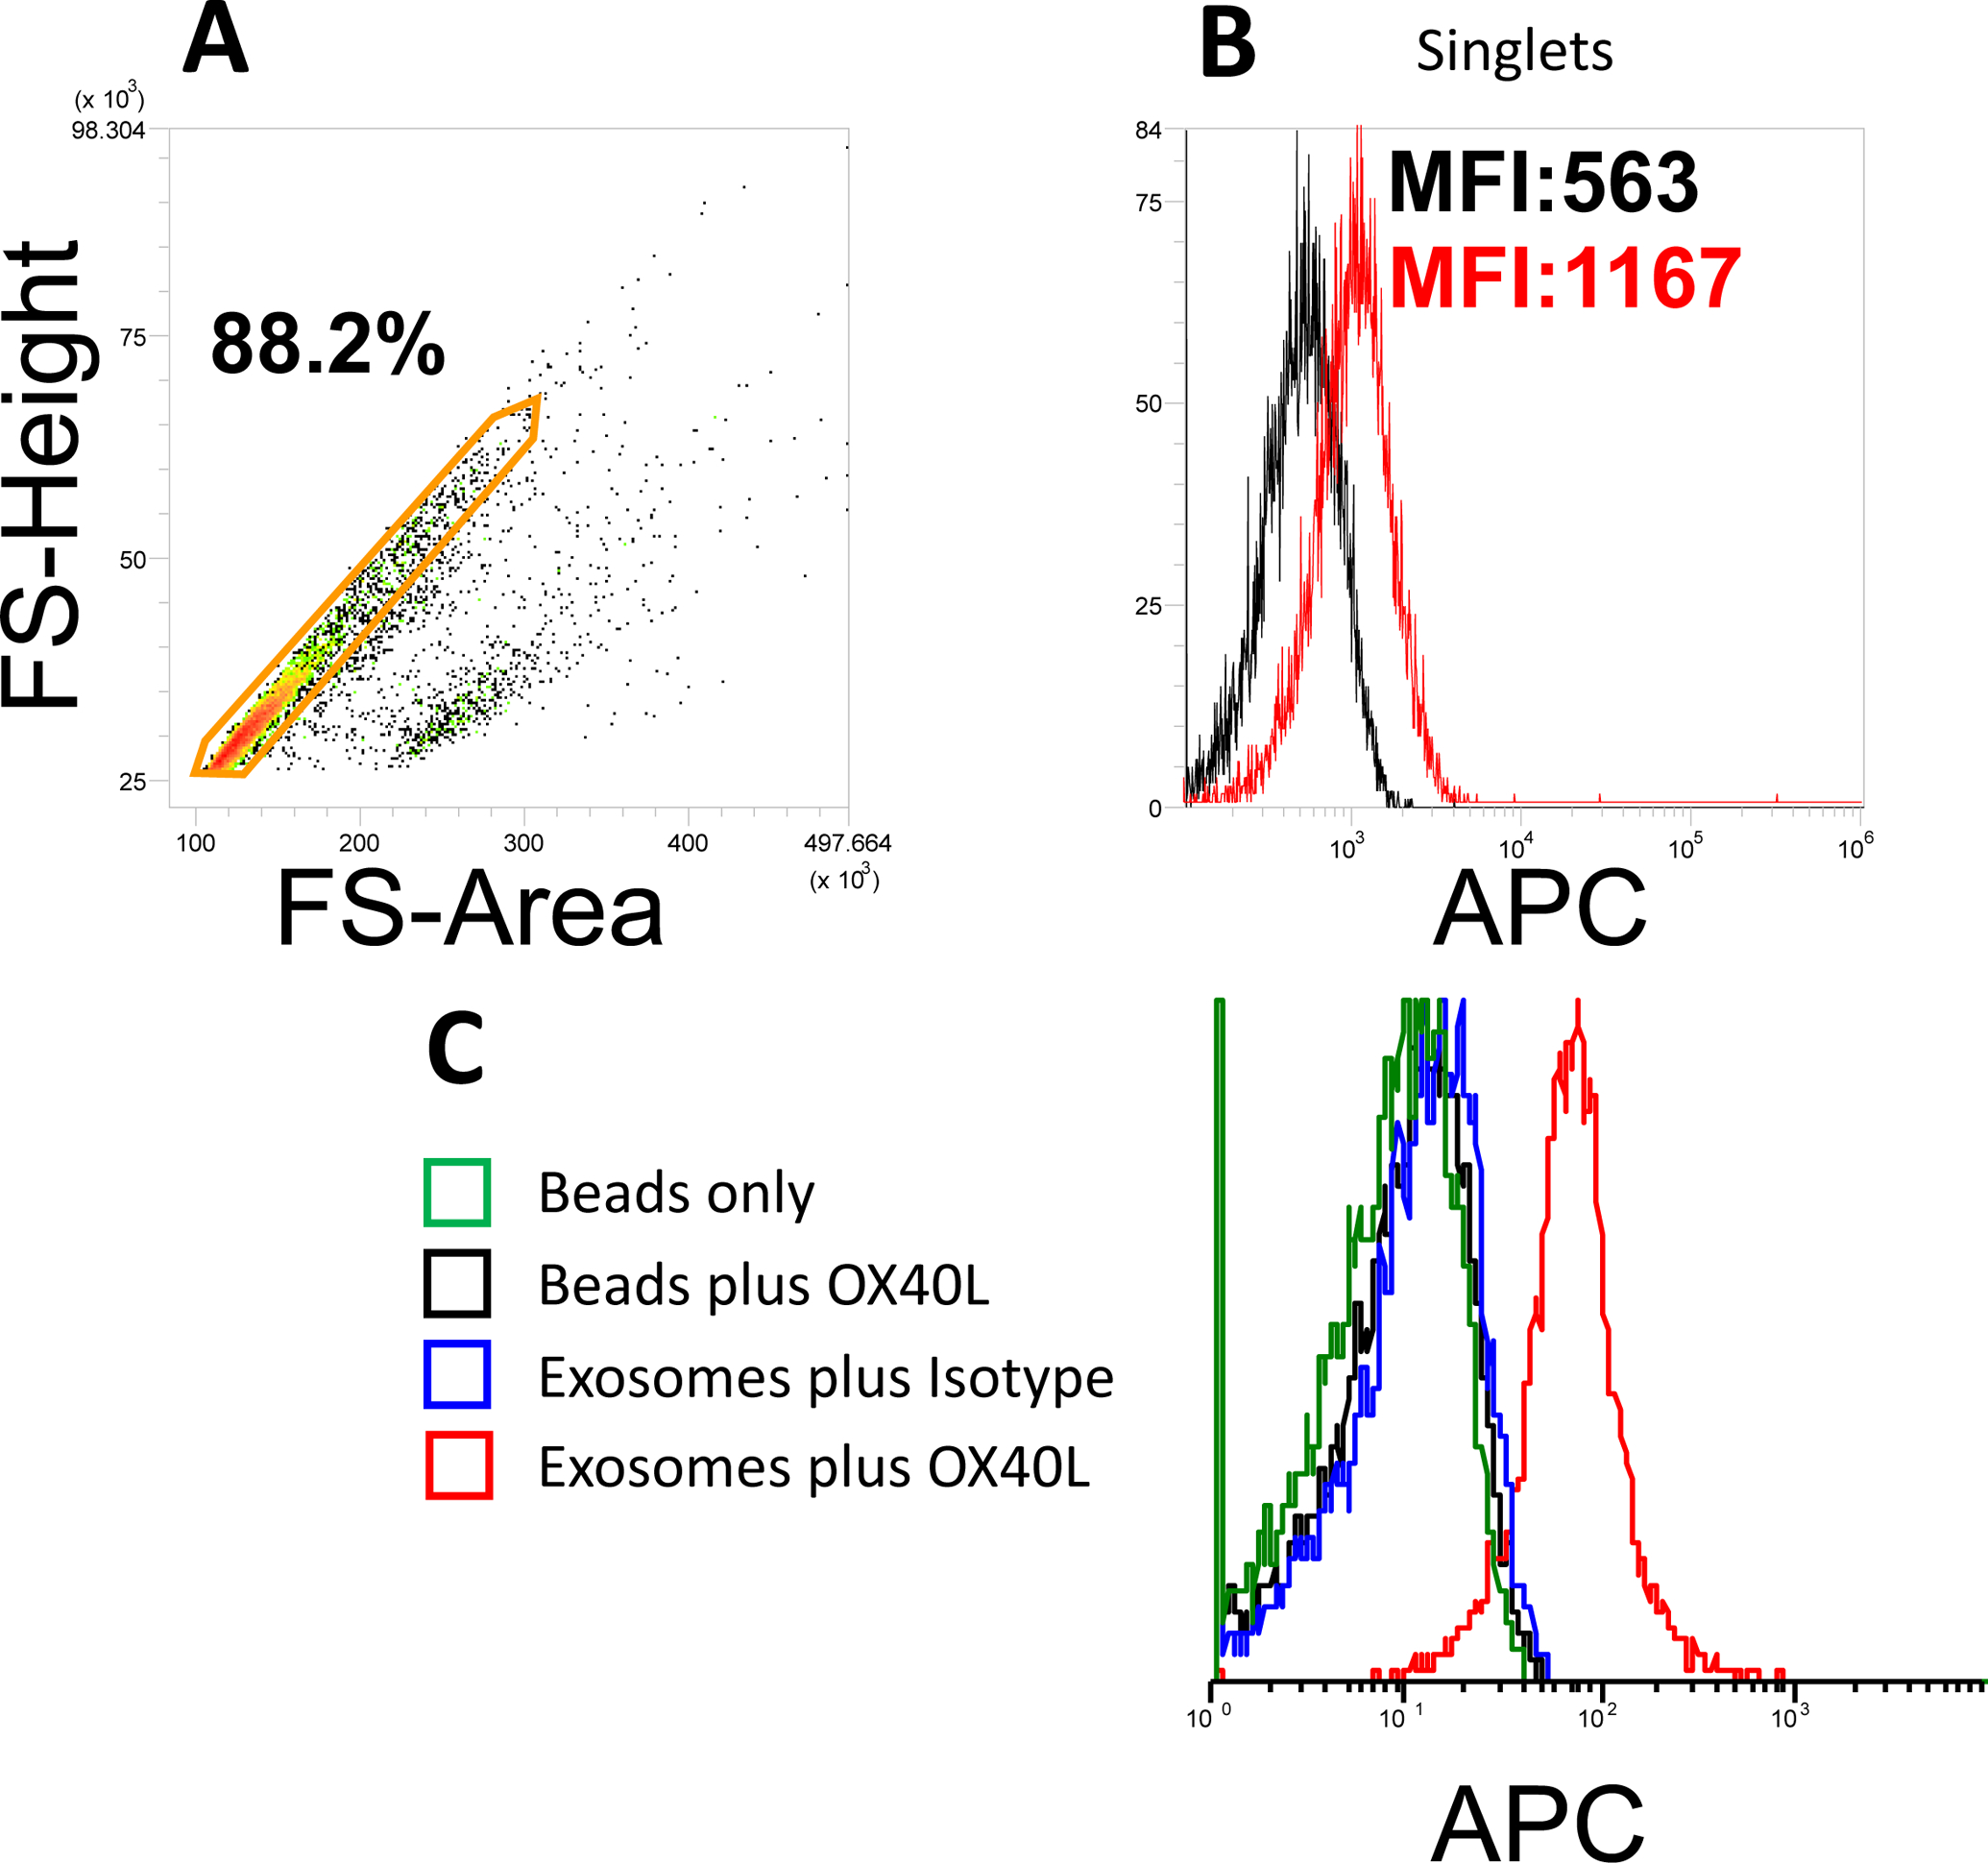
In A, using of a forward scatter pulse analysis permits for selection of labeled single non-aggregated exosome-bead complexes and their discrimination from larger aggregates. In B, detection of OX40L on CD63+ exosomes isolated from plasma of a patient with HNC. capture used Biotinylated anti-CD63 Ab was used for capture. In C, controls necessary for on-bead flow cytometry measurements of OX40L on exosomes. Detection is with APC-labelled anti-Ox40L Ab.
Most data analysis was performed using VenturiOne (Version 7.0, Applied Cytometry, Dinnington, UK).
3a. Antibodies used for antigen detection on exosomes
In addition to the anti-CSPG4 mAbs (APC labeled), the following fluorochrome-labeled specific for various antigens carried by exosomes were used: Anti-Ox40L-APC (clone 159403, catalog# FAB10541A, conc. 10ug/mL, staining with 10uL/0,1ug, R&D Systems); anti-CD81-APC (clone 1D6, catalog# 17-0819-42, conc. 200ug/mL, staining with 5uL/1ug, Ebioscience,); anti-perforin-PE (clone delta GG9, calatolg# 12-9994-42, conc. 12ug/mL, staining with 5ul/0.06ug, Ebioscience); anti-TGFβ-PE (clone 9016, catalog# FAB2463P, conc. 25ug/mL, staining with 2,5uL/0.06ug, R&D Systems); anti-MIP-1β (Clone D21–1351, catalog# Anti-Ox40L-APC (clone #159403, R & D Systems); anti-CD81 (clone 1D6) APC labeled (Ebioscience); anti-perforin-PE (clone delta GG9), (Ebioscience); anti-TGFβ-PE (clone 9016) (R & D Systems); anti-MIP-1β (clone24006) (R & D Systems.)
3b. Titration of antibodies used for antigen detection
Exosomes are significantly smaller than cells, and the presence of beads, which are necessary for analyses of exosomes in a conventional flow cytometer, complicates the assay and requires negative controls. These include an isotype-matched irrelevant antibody control and unstained exosome/Ab/bead complexes. The latter may be the source of background staining. Further, titration of the fluorochrome-conjugated detection Ab is required to achieve the optimal concentration as determined by the highest separation index between the detection Ab and isotype control (Figure 3). The optimal concentration of fluorochrome-labeled antibody is defined as that which gives the best signal to noise ratio, resulting in the best separation between antibody-stained and isotype-control stained exosomes. We used the separation index
(SI) metric, which takes into account both the difference in MFI between stained and isotype control capture beads, and the average spread of their distributions (17,18).
Figure 3. Establishment of the separation index (SI).
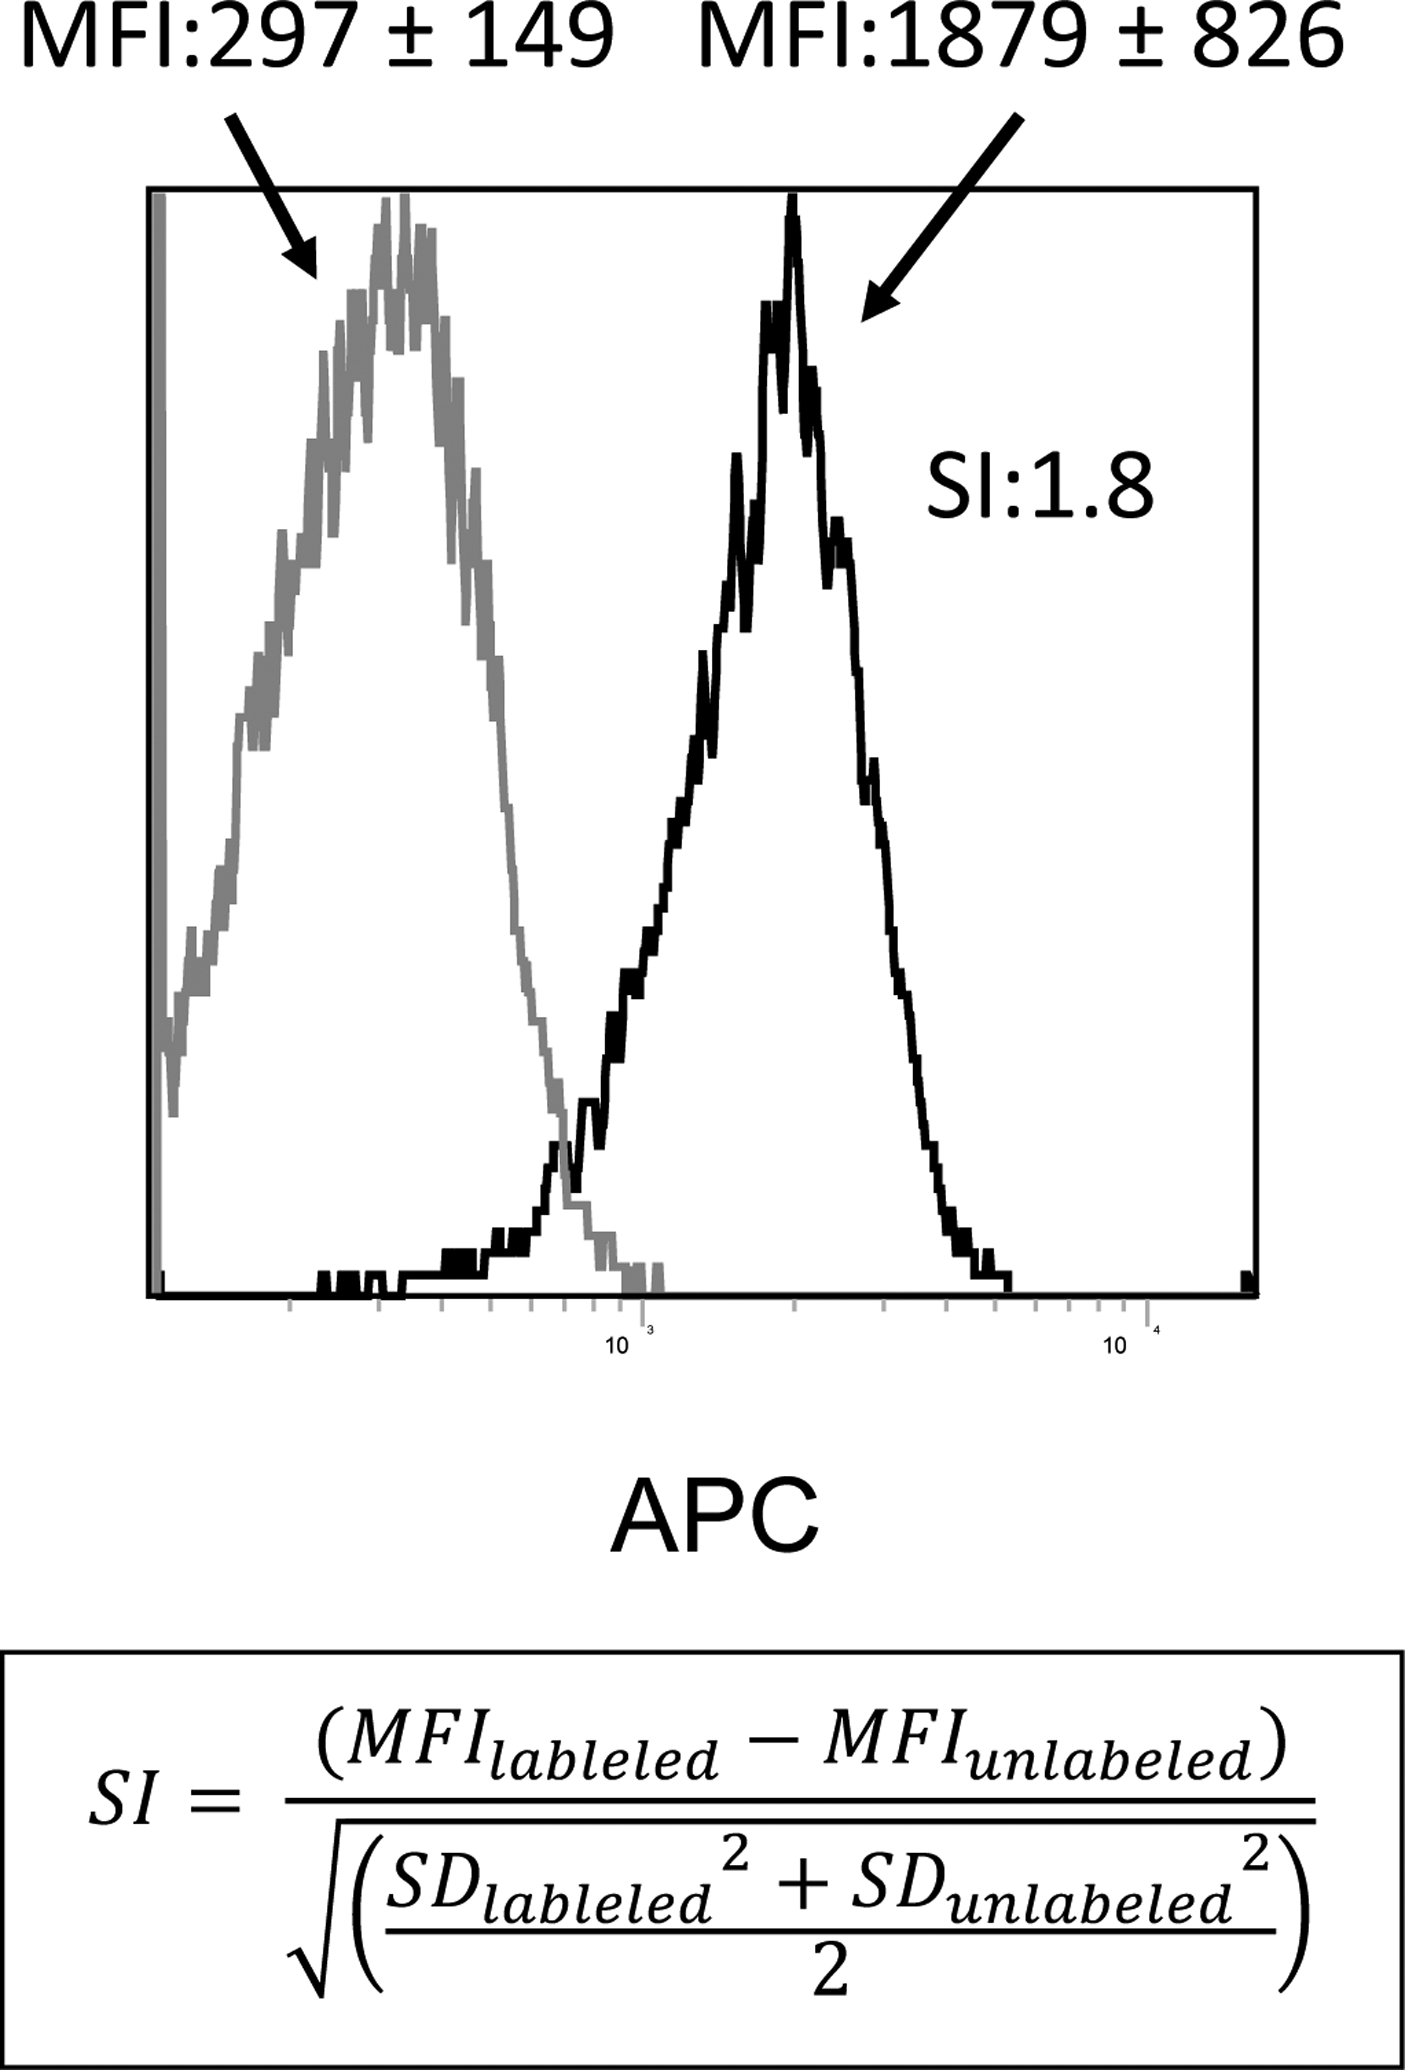
An example of flow cytometric stain of exosomes on beads gated on the main bead population visible on the forward/side scatter. Note, the low MFI of the isotype control compared to the MFI of the APC-labeled detection Ab (anti-OX40L Ab). Capture was with biotinylated anti-CD63 Ab. The SI calculated for this sample (1.8) is based on the difference in MFI between isotype control and Ab-stained exosomes on beads and the average spread of their distributions. The formula for calculating the SI is shown.
3c. Calibration of a flow cytometer
To calibrate the instrument, PMT voltage should be standardized to place a reference bead within a pre-established target channel range. We used the 7th peak of 8-peak SPHERO Rainbow calibration particles (Cat. No. RQC-4K, Spherotech, Lake Forest, IL) for this purpose.
3d. Choice of fluorochrome
Because of the special challenges of exosome-on-bead flow cytometry, we recommend the use of the same fluorochrome for different Abs, if single-stain experiments are performed. A multicolor stain of exosomes on-beads is possible as well. Here, we recommend the usage of bright single molecule protein fluorochromes such as PE and APC, as they lend themselves well to quantification.
3e. Determination of Molecules of Equivalent Soluble Fluorochrome (MESF)
MESF beads are used to quantify the number of fluorescent molecules bound per bead. When staining has been optimized and when labeled antibodies contain one molecule of fluorochrome per antibody molecule, MESF is a surrogate for the number of target molecules bound per bead. Quantum APC MESF microspheres are provided by Bangs Laboratories (Lot No. 13028, Cat. No. 823A, Fishers IN, USA), and their use represents a consistent, instrument-independent way to interpret mean fluorescence intensity. Calibration is performed with each sample according to the method developed by Schwartz and his colleagues at the FDA, Canadian FDA, CDC and NIST (18,19). The kit provides one blank population (Sample 0) and a series of four fluorescent microsphere populations bearing known numbers of fluorescent molecules, quantified as MESF. MFI values determined for each bead are plotted against the known MESF value. MFI of samples are then interpolated on the standard curve and converted to MESF (Figure 4). Unlike MFI, fluorescence quantified as MESF can be compared between instruments, given that the same staining protocol is used.
Figure 4. Flow cytometry of the MESF beads gated on the main bead population.
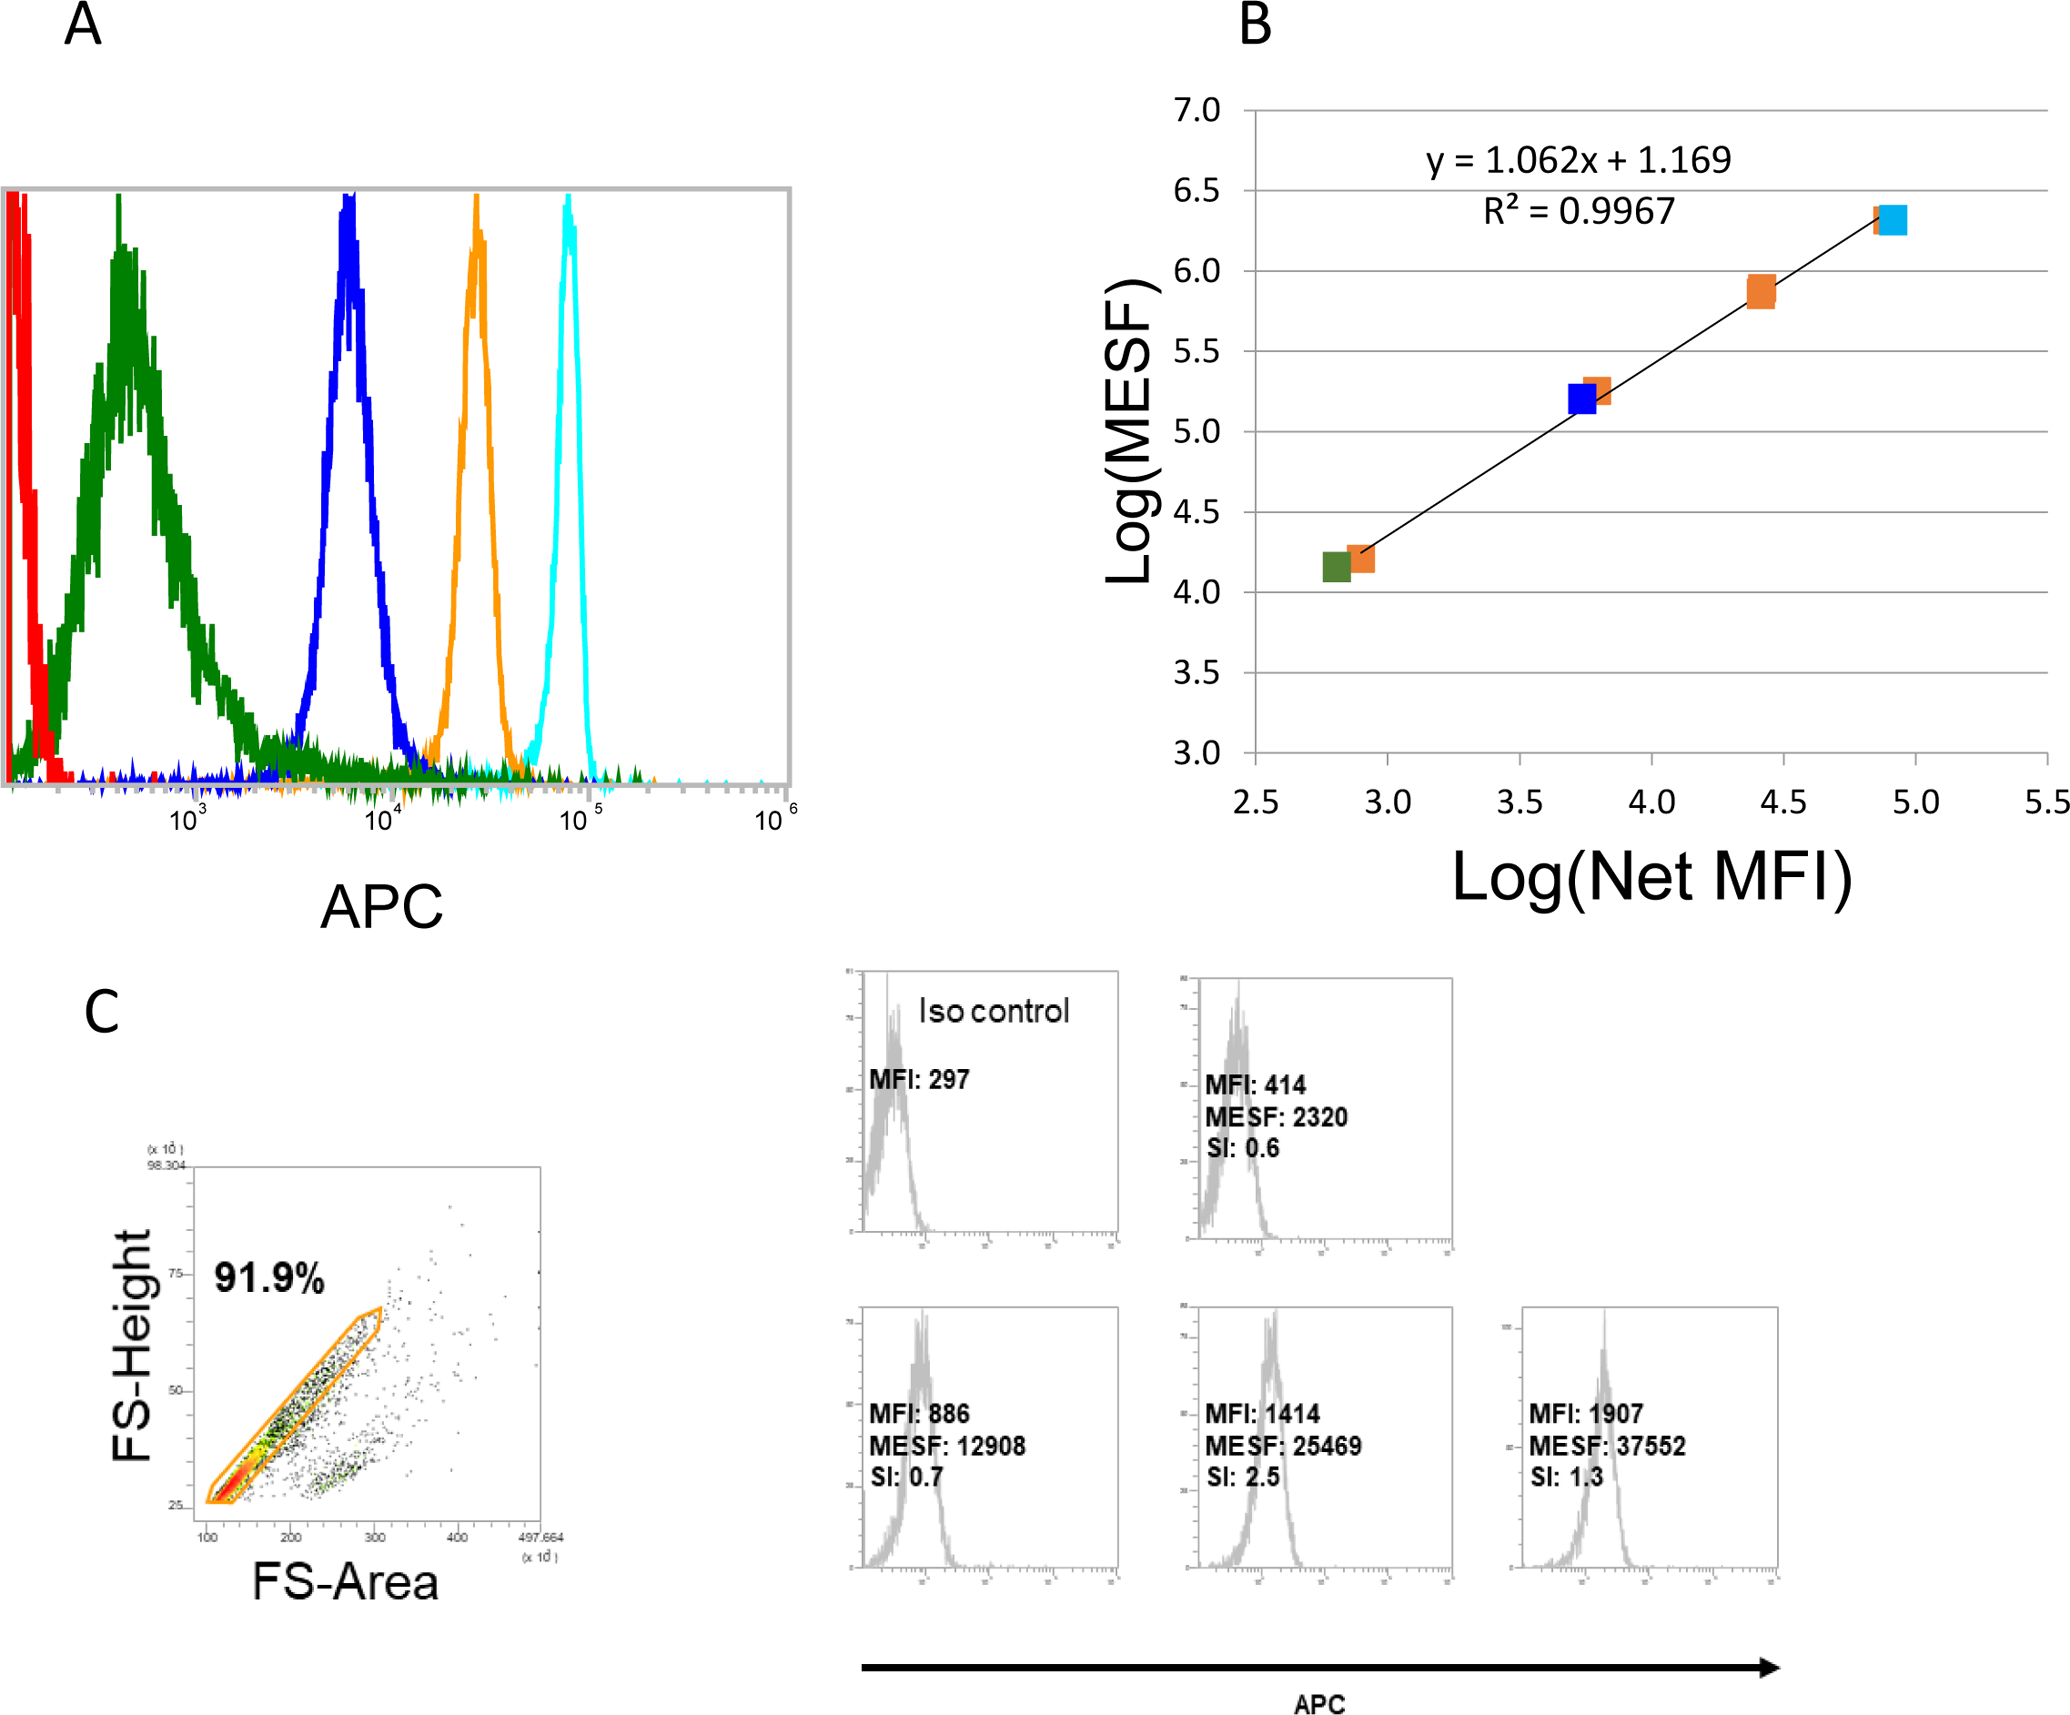
Quantum APC MESF microspheres (MESF) provided by Bangs Laboratories (bead lot 13028) were used to quantify the number of fluorescent molecules per bead. A: One blank population (Sample 0) and a series of four fluorescent microsphere populations of known MESF (samples 1–4). B: Linear curve constructed out of the MFI values from A. For the presented experiment, a standard curve relating MFI to known MESF of the microspheres was constructed as follows: 1) The published MESF of the APC calibration microspheres were log10 transformed; 2) The MFI of the blank microsphere was subtracted from the MFI of each APC-conjugated microsphere to yield Net MFI; 3) Next, MFI values were log10 transformed; 4) Log10(MESF) were regressed against the log10(Net MFI), providing a standard curve with slope and intercept coefficients. The MFI of the isotype control was subtracted from the MFI of each labeled exosome prep (stained at saturation) and the log10MESF was interpolated using the regression coefficients from step 4. The MESF was determined for each APC labeled exosome prep by taking the antilog10 of each interpolated log10(MESF) value. C: Data for expression of OX40L on CD63+ exosomes isolated from plasma of 4 patients with HNC. Biotinylated anti-CD63 Ab was used for exosome capture. The MFI value was determined for each exosome sample and was converted to MESF units. Note a broad range of MESF units among the exosomes of these patients, allowing for comparative quantitation of OX40L expression for each sample. These data were placed in the Flowdepository.org, file # FR-FCM-Z2XH.
An example of MESF calibration for measurements of OX40L expression levels on exosomes isolated from plasma of seven patients with carcinoma of the head and neck (HNC) is provided in Figure 5. MESF, a quantitative estimate of the number of fluorescent molecules bound to each bead, were determined from MFI. SI were determined as an indicator of quality, to quantify separation of stained and isotype control beads. For example, in sample 8019 an SI of 0.3 indicates that the difference in fluorescence intensity between stained and control samples was only 0.3 SD, indicating that the estimated MESF (781 molecules per bead) is in the range of noise.
Figure 5. Quantitative estimates for the presence of OX40L on the surface of CD63+ exosomes captured from plasma of 7 patients with HNC.
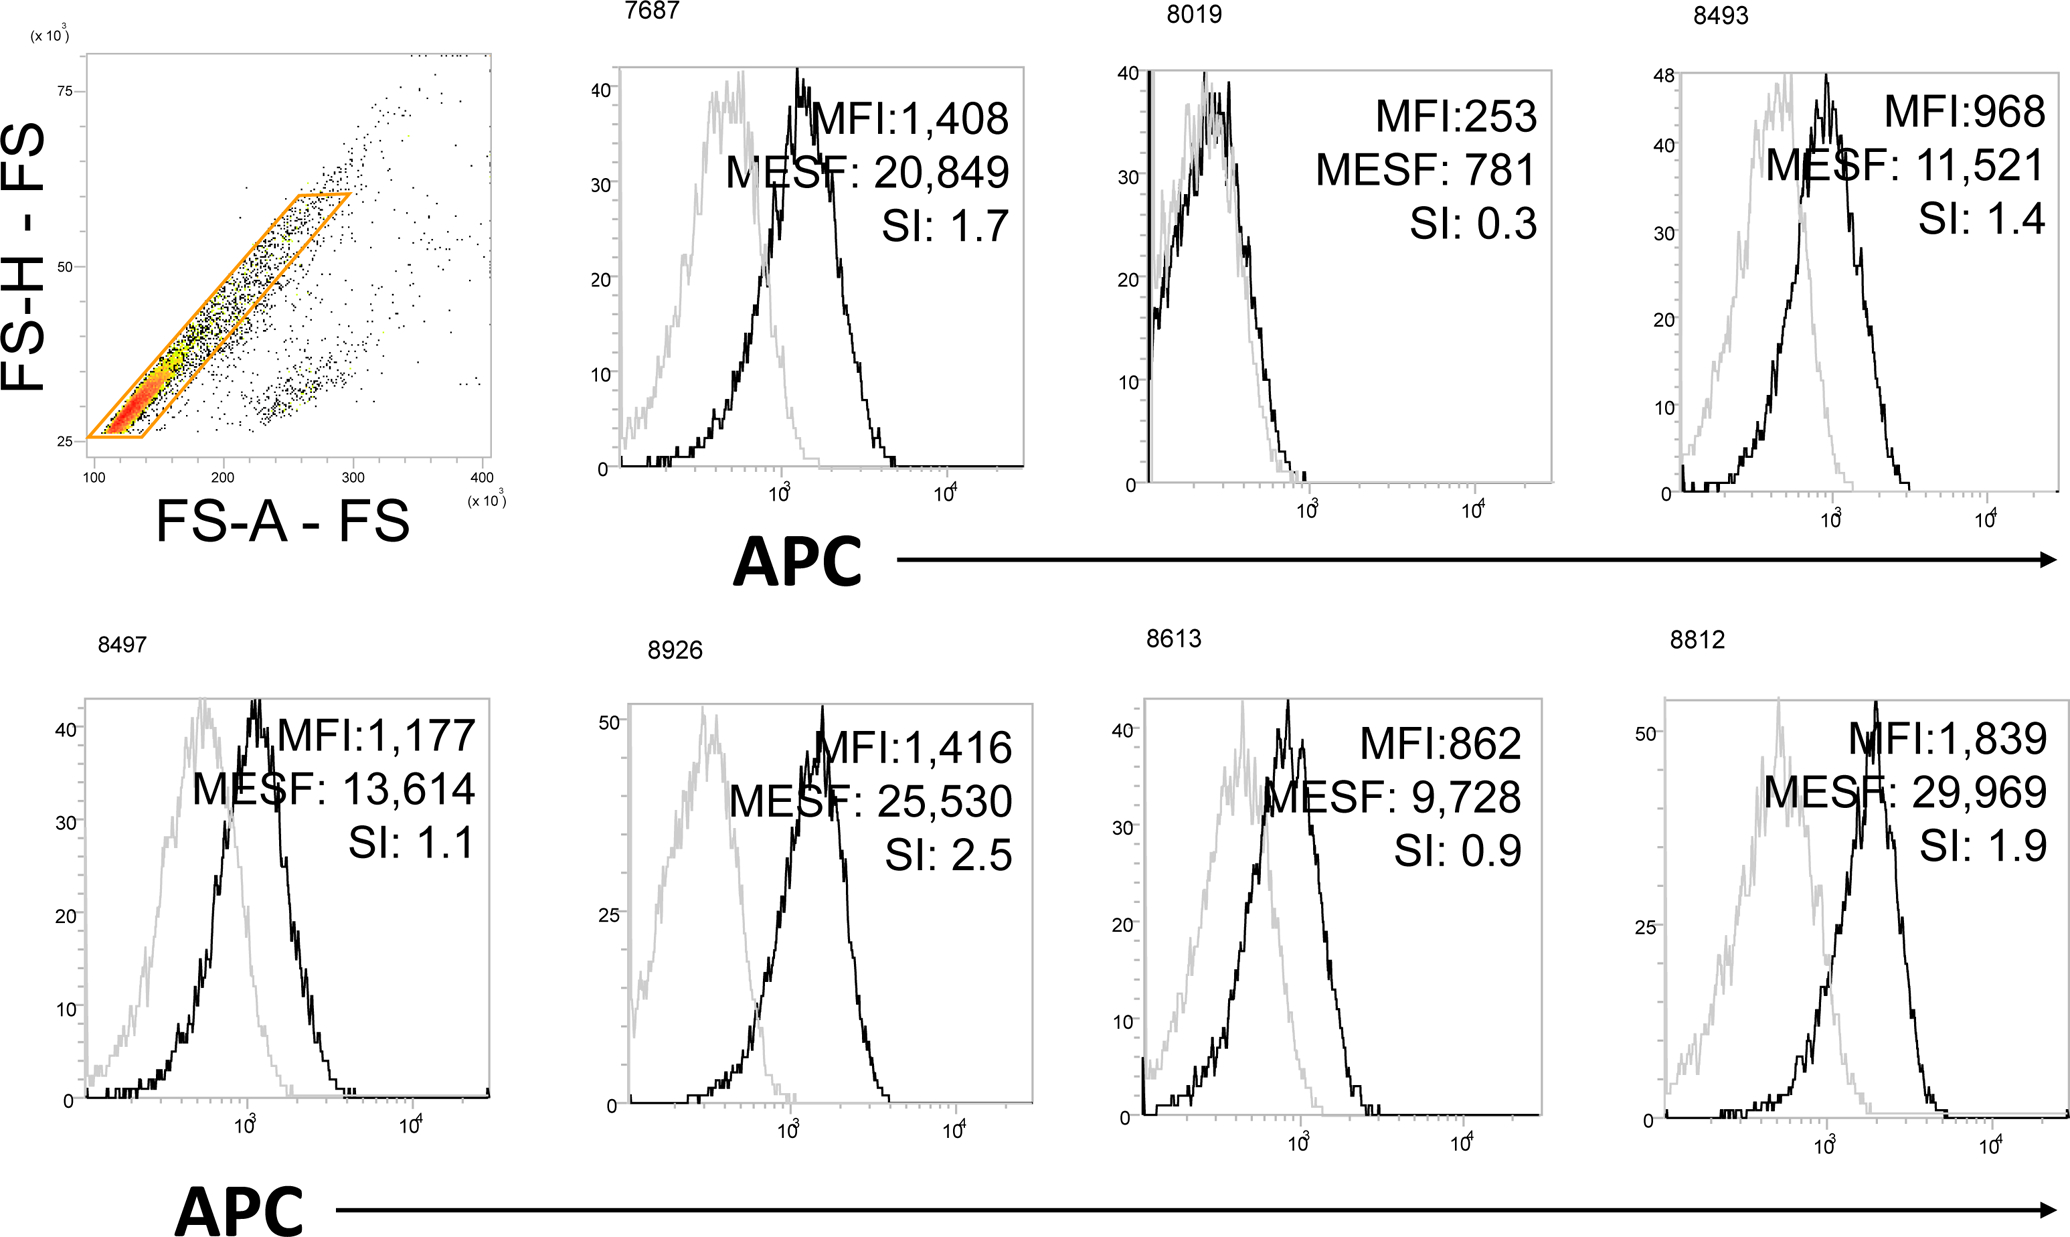
The MFI value was determined for each exosome sample and was converted to MESF units. SI were also calculated. Note a broad range of MESF units among the exosomes of these patients, allowing for the comparative quantitation of OX40L in every exosome sample. Biotinylated anti-CD63 Ab was used for exosome capture.
3f. Detection of intravesicular cytokines in exosomes
Since a single PE-conjugated IgG molecule has a diameter of about 60 nm, approaching the size of an average exosome, intra-vesicular staining with Abs by using conventional cellular permeabilization procedures did not seem applicable to exosomes. Therefore, exosomes (10–30μg protein) were pre-treated with 0.3% TritonX-100 for 10min, which effectively lysed all exosomes as confirmed by TME, and then the lysates were co-incubated with an aliquot (1μL) of Aldehyde/Sulfate Latex Beads (4μm) for 1h to load proteins in the lysate onto the beads. The beads were then blocked with 2% (w/v) BSA in PBS for 1h. After washing × 3 with PBS, the beads were stained with labeled detection Abs of choice and analyzed by flow cytometry.
Ethical Statement
The protocol for human sample collection for research was reviewed and approved by the Institutional Review Board (IRB) at the University of Pittsburgh (IRB #960279). All patients and healthy donors participating in this study signed an IRB approved informed consent. This work was carried out in accordance with the Helsinki Declaration of 1975, as revised in 2008.
Results
Binding of exosome-Ab complexes to beads
Using streptavidin beads and conventional flow cytometry, we successfully performed surface staining of nano-sized exosomes and measured MFI as well as SI of selected proteins carried by exosomes. As previously reported (20), two binding-to-beads strategies are possible: (i) exosomes are mixed with biotinylated Ab prior to the addition of beads or (ii) biotinylated Abs are added to streptavidin-labeled beads prior to exosome addition. The two strategies were compared, and the first was found to be more reproducible (20). The optimal ratio of exosome/biotinylated capture Ab was established by titrations using a defined concentration of exosome protein and increasing the Ab concentrations until the saturation point was reached (20). In the next step, the optimal ratio of the beads/exosome/detection Ab was determined by titrations as illustrated in Figure 6. Beads at increasing volumes were co-incubated with 10μg exosome protein complexed with a mix of anti-CD63 and anti-CD81 Abs. These two anti-tetraspanin Abs were used because they are carried by most although not all exosomes. The data indicated that 20μL beads gave the highest SI value, reflecting the greatest separation between isotype and Ab peaks.
Figure 6. Establishment of the bead/exosome ratio for antigen detection.
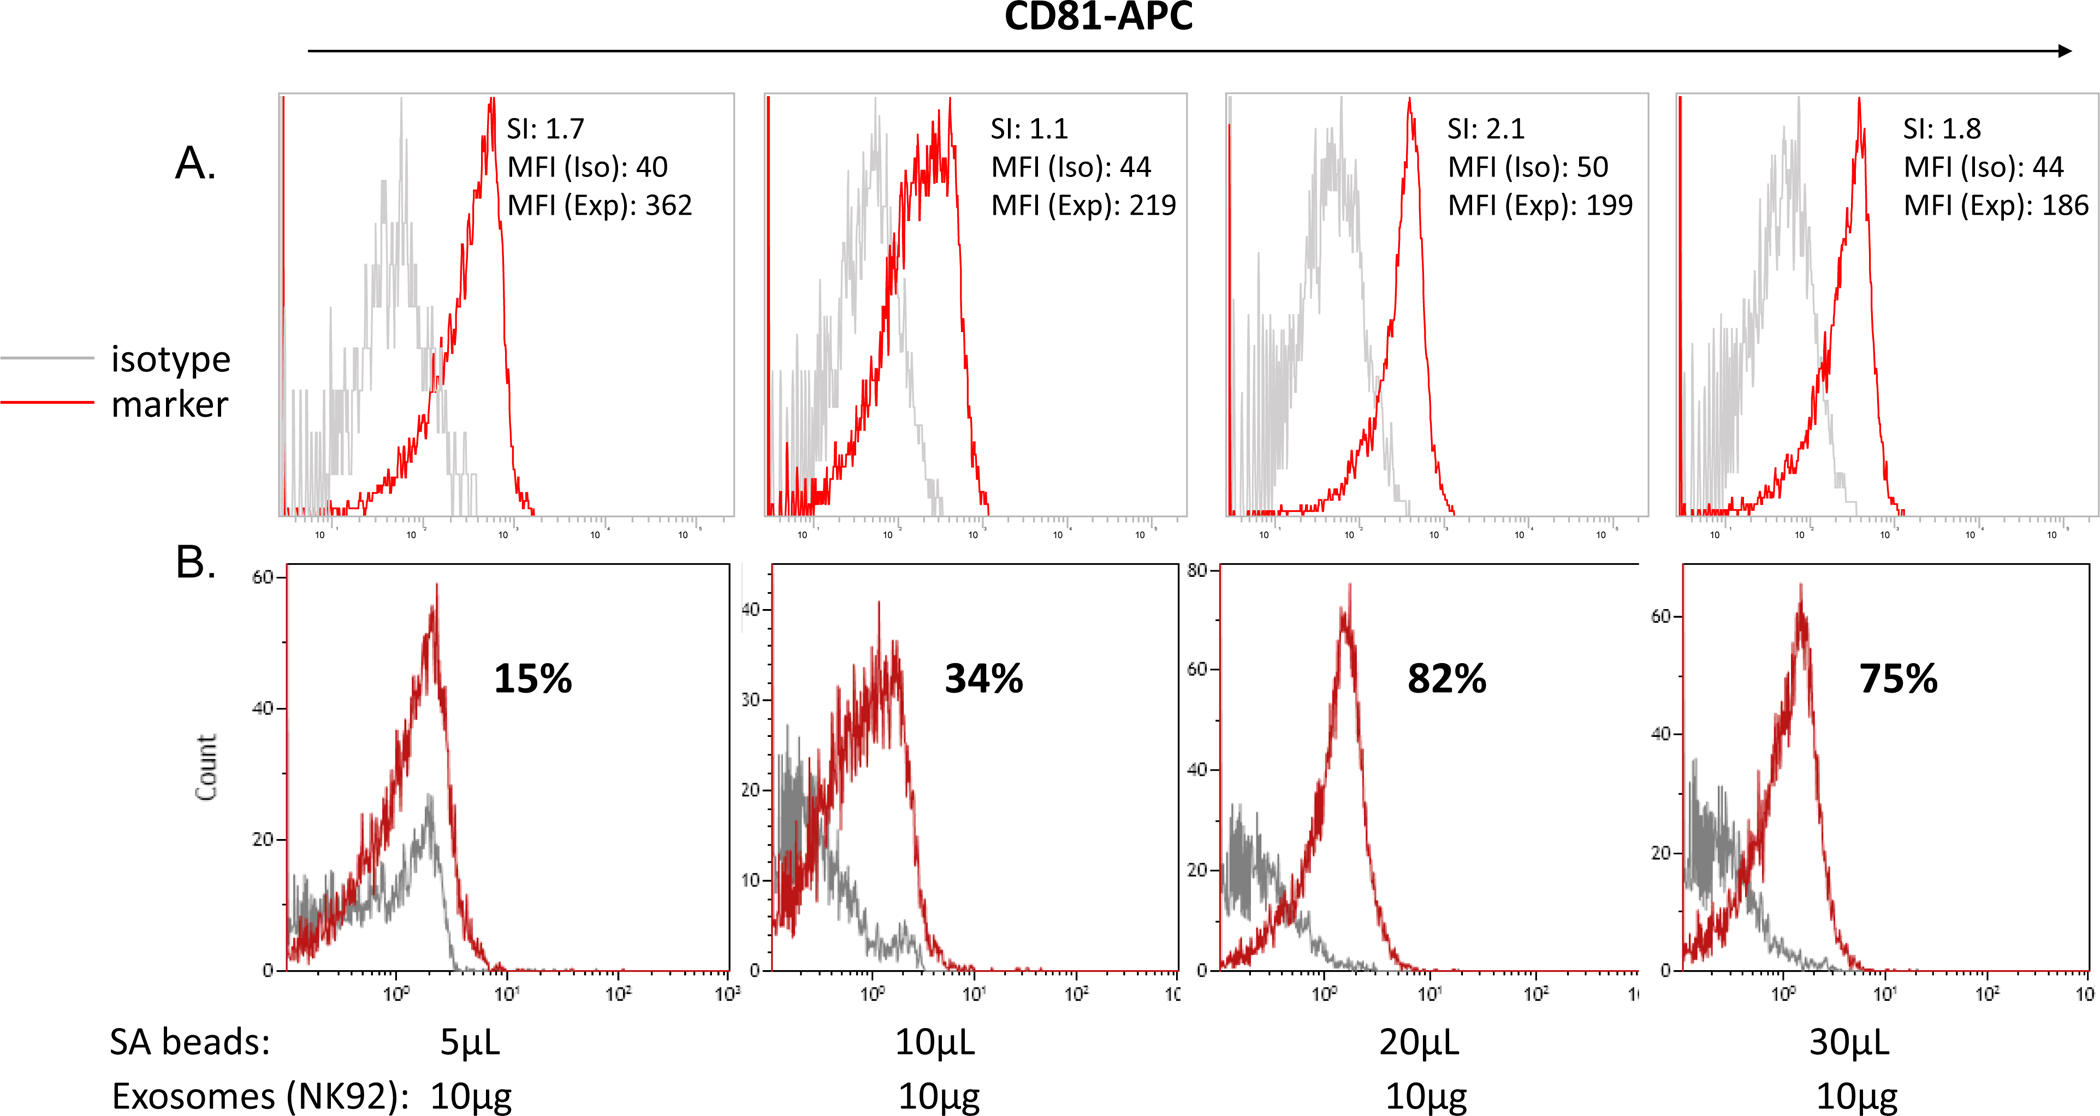
Exosomes at the protein concentration of 10μg were co-incubated with increasing volumes of SA beads coated with biotinylated anti-CD63 Abs. In A. Detection was with pre-titered APC-labeled anti-CD81 Ab and isotype control Abs. Capture with a mix of biotinylated anti-CD63 and -CD81 Abs at the 1:1 ratio). Note that the ratio of 20μL beads/10μg exosomes gave the optimal SI at 2.1. In B. The same data displayed using a different program (Kaluza, Beckman Coulter) shows percentages of on-bead positivity for CD81. While the optimal bead/exosome ratio is the same, the display of data as percentage-positive is incorrect.
As shown in Figure 1B, an immense number of exosomes may be captured per bead. Hence, exosomes which are positive for a specific antigen will be on the same bead as exosomes which are negative for this antigen, and captured exosomes (antigen-positive and -negative) will be dispersed on the beads with an approximately log-normal distribution. Although the lower tail of this distribution may fall below the assays limit of detection, presenting the results as percent positive exosomes captured on beads is misleading and incorrect (Figure 6B). The quantity of exosomes bound per bead follows a distribution which is reflected in the one-parameter fluorescence histograms. When the fluorescence of stained beads overlaps with the isotype control, it is because the lower portion of the distribution of stained beads falls below the assay’s limit of quantification, not because those beads contain no bound exosomes. In on-bead staining, the fluorescence intensity is a product of: (i) the positivity level of a targeted antigen and (ii) the density of this antigen on exosomes. This product is best described by the MFI of stained exosomes minus the MFI of isotype control, the significance of which is determined by the SI. Figure 3 illustrates the concept.
Advantages of MESF
Using the MESF beads for instrument calibration as described in Methods and illustrated in Figure 4a, is especially important for the on-bead assays. It allows for a standardized evaluation of the MFI by calculating MESF values estimated within the linear range of the standard curve generated by the fluorochrome-labeled beads. The logarithm of the MFI of the stain subtracted by the MFI of the isotype is used for calculation of the MESF value of each sample. Figure 5 provides an example of on-bead staining for OX40L on plasma-derived CD63+ exosomes in several different HNC patients. Results are presented as MFI, MESF and SI calculated using the standard curve shown in Figure 4b.
Gate-setting for exosomes on-beads
The use of beads introduces a requirement for establishing a gate that does not include aggregates of beads. Figures 2 and 4c illustrate the optimal gating strategy, where aggregates of beads are clearly discriminated from single exosome/detection Ab/bead complexes on the basis of forward light scatter pulse area versus forward scatter pulse height. Events with a pulse area too great for their pulse height represent bead aggregates. The gating strategy is especially critical when exosomes are disrupted in 0.3% Triton X-100 in PBS and the lysate proteins are placed on latex beads for detection of intraluminal antigens. SFigure 2 illustrates gating used for detection of intraluminal perforin or TGF-β in exosomes isolated from supernatants of NK92 cells.
Reproducibility of the flow cytometry-based detection assay
Reproducibility of the flow cytometry-based detection method for antigens carried by exosomes was tested and validated targeting PD-L1 on exosomes from plasma of patients with HNC as previously described by us (11). Exosomes isolated from plasma of 3 different HNSCC patients were divided into 3 aliquots. Each of these aliquots was divided again into 3 parts and stained for PD-L1 (the total of 3×9 aliquots). Results of flow cytometry (MFI of PD-L1+ exosomes) showed that the assay had excellent reproducibility with the experimental error of only 7% (11).
Flow cytometry-based detection of various surface or intraluminal antigens in exosomes
On-bead flow cytometry of exosomes isolated from supernatants of tumor cell lines or plasma of patients with cancer was successfully used to measure levels of selected antigens carried by exosomes on the membrane surface or in the lumen of these vesicles. To illustrate the versatility of the methodology for quantitative phenotyping of exosomes captured on beads, several selected examples are presented in Supplemental Figures 1–3.
We have previously used anti-CSPG4 Abs to capture melanoma-derived exosomes from plasma of patients with melanoma (14,21). SFIGURE 1 presents the results of immune capture of CSPG4+ exosomes, almost all of which are positive, and the absence of the CSPG4 protein on non-captured exosomes.
SFigure 2A shows an experiment in which NK92 cells and NK92-derived exosomes captured on SA beads were assessed for the presence of perforin. Western blots indicated that perforin and granzyme B were present in exosomes produced by NK92 cells. (SFigure 2C). Flow cytometry of permeabilized NK92 cells showed that perforin was largely found in cytosol, and cell surface staining showed only minimal perforin expression (SFigure 2A). NK92-derived exosomes captured on SA beads carried no perforin on the surface (SFigure 2B). Exosome treatment with BD permeabilzation buffer same as that used for cellular permeabilization procedure was negative for perforin (SFigure 2B), When, however, the exosome lysate-coated latex beads were used for detection, perforin was present in NK92 cell-derived exosomes (Figure 7A). Further, as shown in Figure 7A, levels of perforin measured in the exosome lumen depend on the ratio of beads/exosomes, suggesting that titrations to establish the optimal ratio is a critical aspect of on-bead flow cytometry with exosomes.
Figure 7. On-bead flow cytometry for exosomes disrupted with 0.3% Triton X.
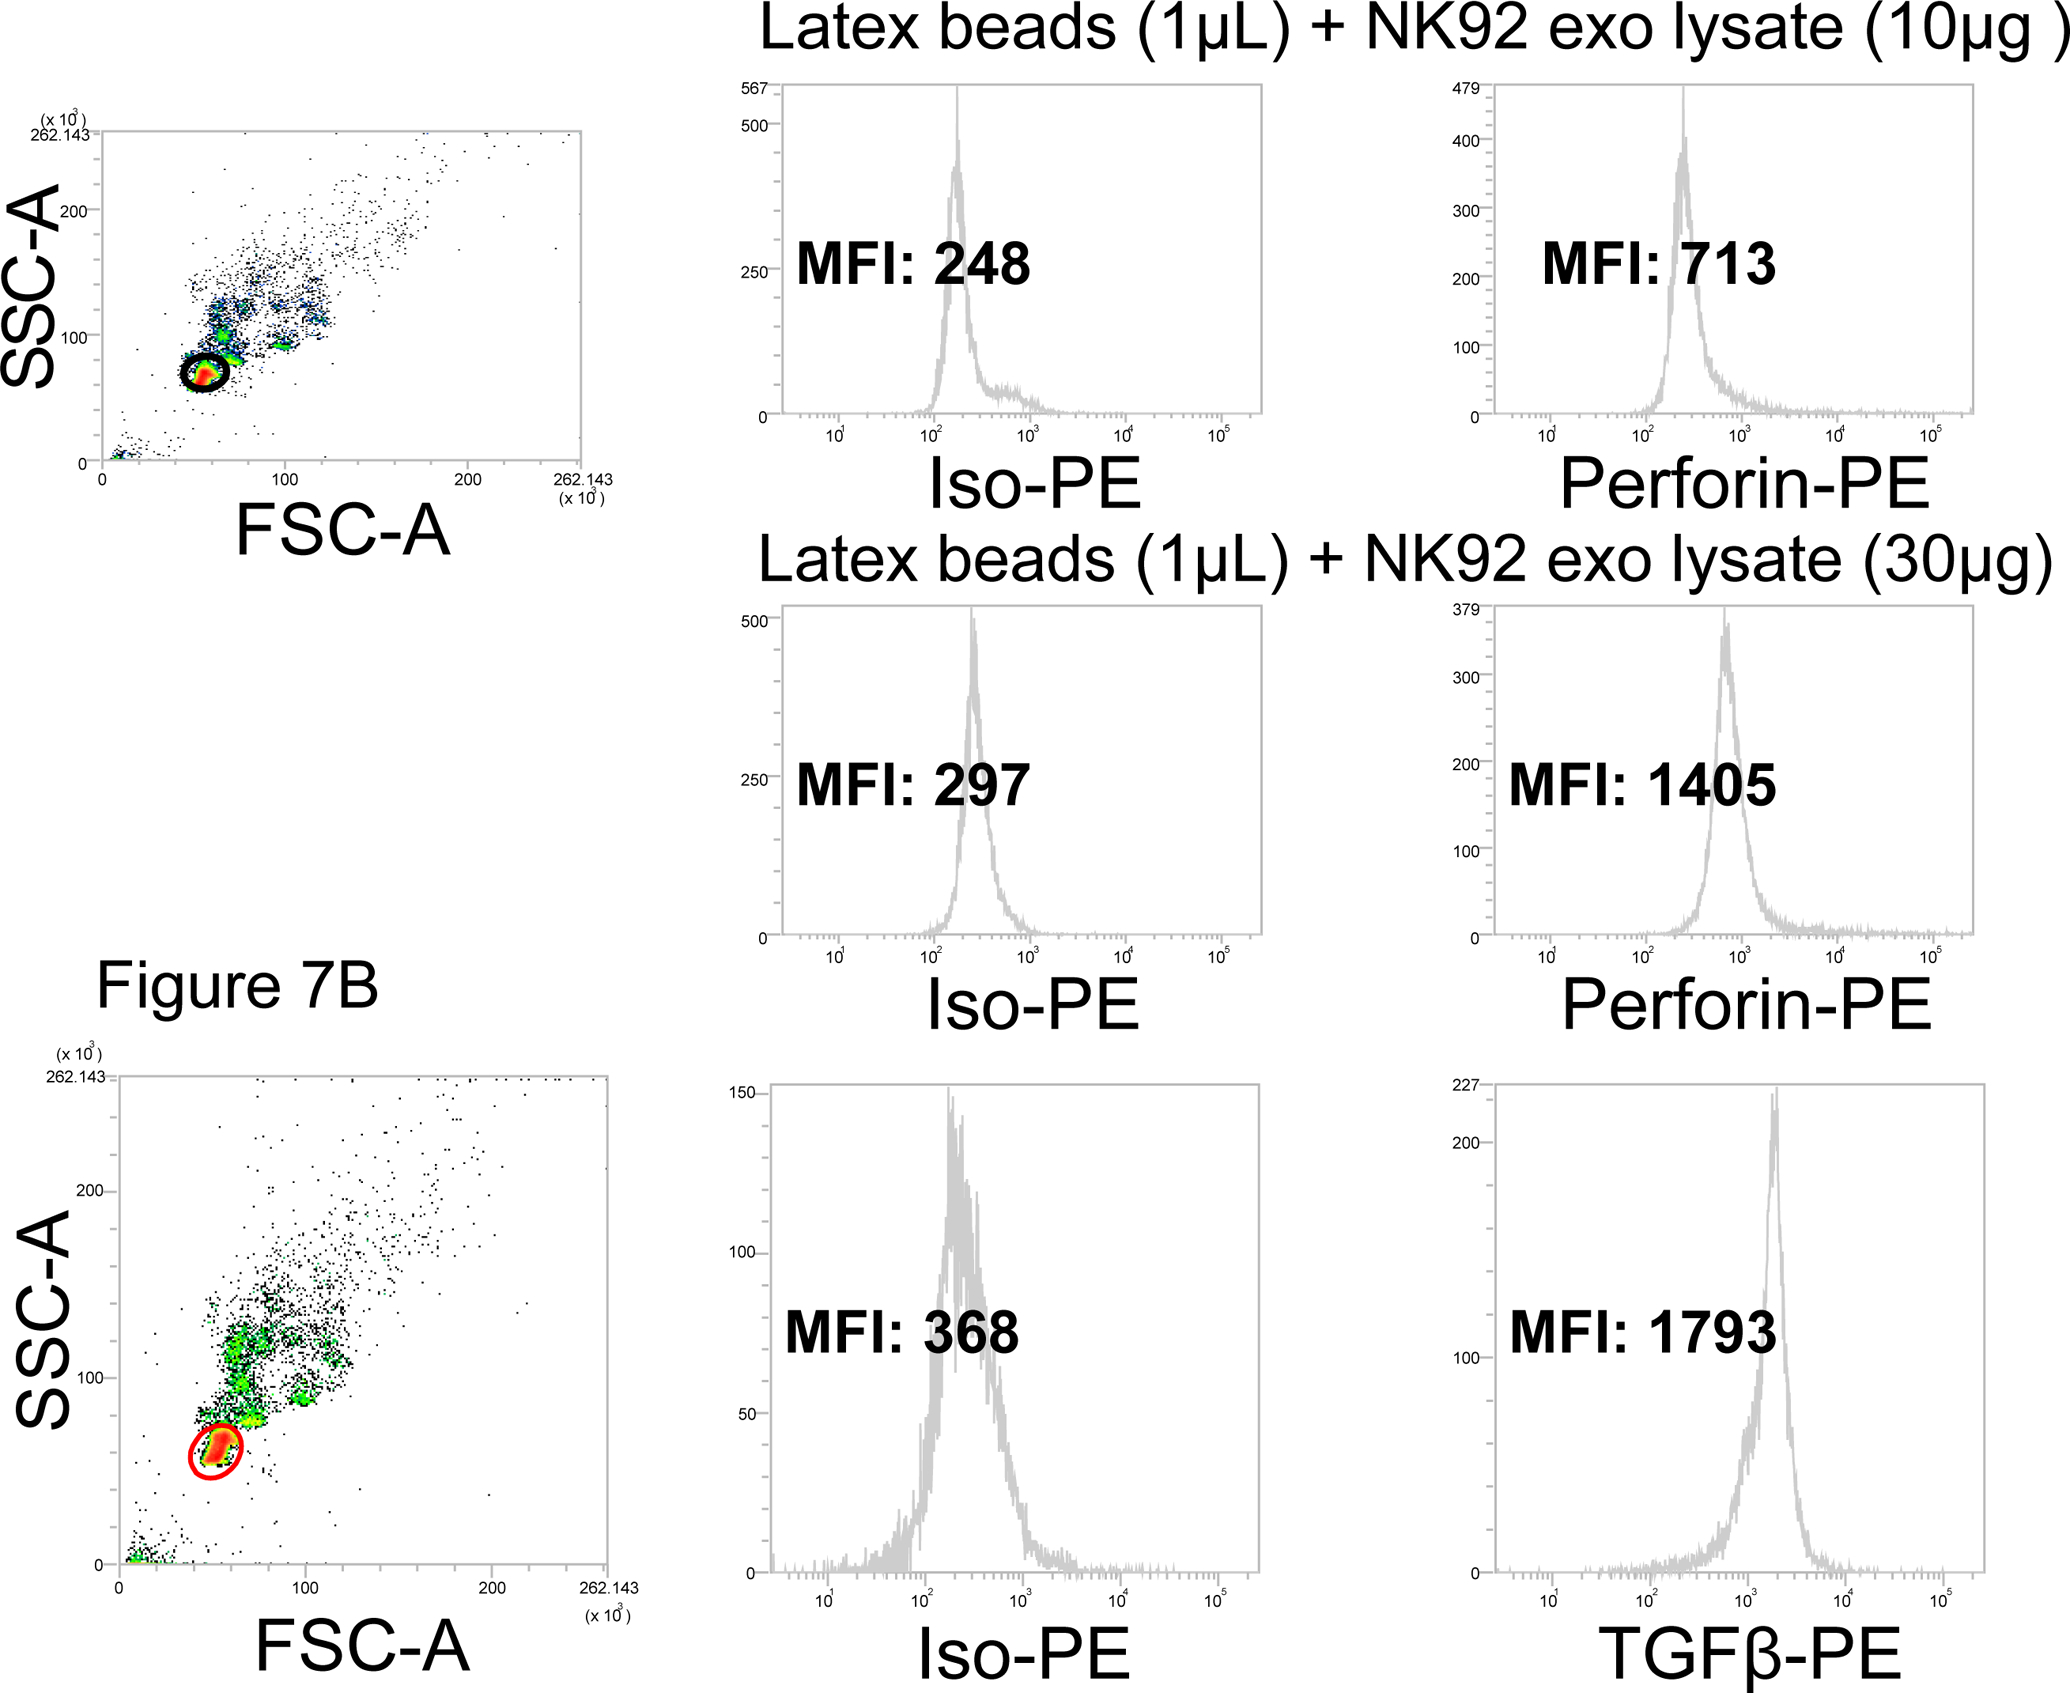
Exosomes produced by NK92 cells were treated with 0.3% Triton X-100 in PBS as described in Methods. Lysates were placed on latex beads (1μL) at the pre-determined exosome/beads ratios for detection with PE-labeled anti-perforin Abs. Upper panels: flow cytometry for perforin in 10μg lysate of exosomes produced by NK92 cells. Lower panels: flow cytometry for perforin in 30μg 30ug of the same lysate. At 50μg of lysate, MFI did not increase (not shown), indicating that saturation was reached at 30μg. In B, detection of intraluminal TGF-β on exosomes produced by NK92. We have previously reported that these exosomes carry TGF- β based on Western blotting of exosomes (25). In A and B, note that with latex beads, the gate should be carefully set to exclude bead aggregates. .
Intra-vesicle detection after disruption of exosomes with 0.3% Triton X-100 was used to detect and measure cytokines (e.g., TGF-β in Figure 7B and MIP-1β in SFigure 3) present in NK92 cell-derived exosomes. It is essential to confirm (e.g., by TEM) that under these conditions exosome lysis is complete. By parallel testing for surface cytokines and cytokine or chemokine detected in the exosome lysate, it is possible to evaluate the total cytokine content in and on the surface of the vesicles. These examples are provided to illustrate that not only proteins on the exosome surface but also intraluminal exosome proteins, including cytokines, chemokines and other soluble factors, can be detected and measured using Abs and on-bead flow cytometry.
Discussion
Labeling of EVs for nanoscale flow cytometry has been evaluated and described by Morales-Kastresana et al (12,22). The authors of these reports emphasize that on-bead flow cytometry does not provide multiparametric information at a single EV level. Instead, it enables phenotypic characterization of specific EV populations of interest enriched by selective capture with Abs and subsequent detection of the EV cargo within in the population of the captured vesicles. On-bead flow cytometry provides the positivity level and the density of targeted protein within the isolated and captured population of multiple EVs. Because EVs that we have been evaluating by on-bead flow cytometry are first isolated from plasma or culture supernatants by SEC and have characteristics consistent with those ascribed to exosomes, including virus-like size, the MVB origin and the presence of endocytic proteins in their cargo (2), we consider this method as an advantageous approach to the analysis of immunocaptured exosomes selectively captured on beads. The selection and preparation of beads and Abs used for exosome capture are the critical components of the strategy. The beads should be of the appropriate size to be recognized in a conventional flow cytometer (e.g., ~3μm) and should have no or minimal background fluorescence. While the use of mouse plasma for blocking of non-specific staining (Figure 1) in part improves antigen detection, the potential for artifacts is decreased with beads that deliver no background signal. The second critical factor for successful on-bead exosome analysis is the ratio of beads/Ab/exosomes which needs to be optimized for each and every Ab/exosome complex. We pointed out earlier that incubation of Abs with exosomes prior to introducing the beads may be preferable to the use of Ab/bead complexes for exosome binding (20). Since Ag/Ab interactions are always concentration dependent, optimization of this interaction is necessary before the beads, used at a pre-determined number, are added to form a complex detectable in a flow cytometer. The detection of pre-formed bead/Ab/exosome complexes with a selected labeled Ab requires a separate titration, but once established, the optimal ratio for a given detection Ab is a stable factor. Such optimization is essential if data are to be reported as MESF. The third critical factor for successful on-bead exosome analysis is isotype control, which again requires cross-titration against the labeled detection Ab to minimize non-specific reactivity. While the use of isotype control antibodies is controversial for cellular flow cytometry. for bead-based exosome staining it is of high importance. The objective is to achieve the best separation of the isotype MFI from the detection Ab MFI, which is defined as the separation index or SI. Achieving such a separation is difficult using unstained controls in place of the isotype, because the signal is very weak preventing discrimination. To quantify fluorescence by an instrument-independent objective metric, calibration of the MFI signal by the daily use of Quantum MESF microspheres is recommended. This allows for the calculation of MESF values within the linear range of the standard curve generated by the fluorochrome-labeled beads and allows for comparative estimates of signal intensity in different samples and between different laboratories.
With a suitably pre-titered Ab-based detection system, and the capability to express MIF values as MESF units, gating on exosome-bead complexes is the next critical step. Because beads, Ab-coated beads or bead-exosome complexes may and often do form aggregates, gating must eliminate these aggregates, so that only singlet analytes are in the gate. The gating on singlets is facilitated when exosomes are isolated by SEC instead of ultracentrifugation, because the vesicle morphology and integrity are maintained in SEC-isolated exosomes. Lysis of exosomes with mild detergents and subsequent on-bead detection by flow to assess the intraluminal protein content may increase aggregate formation and calls for especially vigilant gating (Figure 6A).
Despite many potential pitfalls, all of which can be avoided, advantages of on-bead flow cytometry analysis of exosomes are considerable. Quantification of proteins present on the surface or in the lumen of exosomes within a selected vesicle subset allows for the molecular definition of their cargos and for establishing correlations between exosome samples from different sources or different patients (Figure 5). Further, it allows for correlations to be established between exosome cargo and clinicopathological endpoints, as we have reported (23,24). Sensitivity of flow detection appears to be especially important for detection of proteins present in femtomolar quantities on the exosome surface or in the lumen, such as cytokines. Despite a multi-step method for detection of target antigens on/in exosomes, the reproducibility of both the Ab-based capture and detection methods is excellent as we have previously reported (11,14).
We have selected several examples to illustrate the usefulness of on-bead flow cytometry for assessments of their content. The analysis is applicable to the identification of distinct subpopuIations of exosomes that carry highly variable molecular cargos. Specifically, tumor-derived exosomes (TEX) can be quantitatively evaluated for protein content by this method and differentiated from exosomes produced by non-tumor cells (21,25). It is thus possible to establish correlations between the TEX cargo and their origin as well as their functional activities (21,25). Further, on-bead flow cytometry analyses allowed us to show that within the same subset of exosomes, vesicles are present that carry different proteins at vastly different densities. The implication of these results is that within a specific subset of exosomes in plasma of patients with cancer, there are subpopulations of vesicles carrying numerous different proteins at vastly different densities and capable of delivering signals that simultaneously target a variety of molecular pathways in recipient cells.
The dependence of the on-bead flow-based methodology on Abs provides specificity and sensitivity not achievable by other exosome evaluation methods, such as LC-MS/MS, for example. Consistently, mass spectrometry detection of cytokines in TEX has been negative in our hands, while both western blots and on-bead flow cytometry were positive. We have also used on-bead flow cytometry to confirm mass spectrometry detection of specific immunoregulatory antigens in exosomes produced by human tumor cell lines (26). The use of flow cytometry for studies of exosomes is likely to greatly expand with the recent introduction of new instruments that will enable identification of virus-size vesicles and their staining with Abs without the beads.
Supplementary Material
SFigure 1. Capture and development of melanoma cell-derived exosomes with biotinylated anti-CSPG4 mAb on streptavidin beads. The capture conditions were as described by us earlier (14). Detection with the APC-labeled anti-CSPG4 (this Ab clone was different from the Ab clone used for capture) showed that nearly all immuocaptured exosomes were positive (upper panels). In contrast, exosomes NOT captured by anti-CSPG4 mAb were negative when stained with APC-labeled detection mAb.
SFigure 2. Surface and intracellular/intravesicular detection of perforin in NK92 cells and in NK92-derived exosomes on SA beads. In A, NK92 cels carried no surface perforin (upper panels), while permeabilized NK92 cells with fixation/permeabilization buffer (Cytoperm, BD Biosciences) have a high intracytoplasmic perforin content. In B, exosomes captured on SA beads using biotinylated anti-CD63 Ab had no surface perforin (upper panel) and after treatment with with BD fixation/permeabilization buffer for 30min, no perforin was detected, suggesting that the fixation and permeabilization treatment were not applicable to exosomes. In C, Western blots of the same NK92-derived exosomes showing the presence of perforin and granzyme B.
SFigure 3. NK92 cell-derived exosomes carry surface MIP-1β. In A, exosomes were captured on SA beads using biotinylated anti-CD81+anti-CD63 Abs and the development was performed with anti-PE-labeled MIP-1β Abs. Exosomes carry high levels of MIP-1β on the surface. In B, after treatment with 0.3% Triton X-100, detection of MIP-1β in lysate proteins captured on latex beads confirms its presence in exosomes.
Acknowledgements
Funding Information:
This work has been supported in part by NIH grants RO-1CA 168628 and R21-C205644 as well as NCI-SBIR Phase II 75N91019C00042 to TLW and by the Deutsche Forschungsgemeinschaft to M-NT (research fellowship # TH 2172/1-1).
Footnotes
Conflict of Interest: The authors declare no conflict of interest.
References
- 1.Whiteside TL. Exosomes and tumor-mediated immune suppression. J Clin Invest 2016;126:1216–23. [DOI] [PMC free article] [PubMed] [Google Scholar]
- 2.Thery C, Witwer KW, et al. E. Minimal information for studies of extracellular vesicles 2018 (MISEV2018): a position statement of the International Society for Extracellular Vesicles and update of the MISEV2014 guidelines. J Extracell Vesicles 2018;7:1535750. [DOI] [PMC free article] [PubMed] [Google Scholar]
- 3.Mathieu M, Martin-Jaular L, Lavieu G, Thery C. Specificities of secretion and uptake of exosomes and other extracellular vesicles for cell-to-cell communication. Nat Cell Biol 2019;21:9–17. [DOI] [PubMed] [Google Scholar]
- 4.Hessvik NP, Llorente A. Current knowledge on exosome biogenesis and release. Cell Mol Life Sci 2018;75:193–208. [DOI] [PMC free article] [PubMed] [Google Scholar]
- 5.Kalluri R The biology and function of exosomes in cancer. J Clin Invest 2016;126:1208–15. [DOI] [PMC free article] [PubMed] [Google Scholar]
- 6.Whiteside TL. The emerging role of plasma exosomes in diagnosis, prognosis and therapies of patients with cancer. Contemp Oncol (Pozn) 2018;22:38–40. [DOI] [PMC free article] [PubMed] [Google Scholar]
- 7.Ruivo CF, Adem B, Silva M, Melo SA. The Biology of Cancer Exosomes: Insights and New Perspectives. Cancer Res 2017;77:6480–6488. [DOI] [PubMed] [Google Scholar]
- 8.Muller L, Simms P, Hong CS, Nishimura MI, Jackson EK, Watkins SC, Whiteside TL. Human tumor-derived exosomes (TEX) regulate Treg functions via cell surface signaling rather than uptake mechanisms. Oncoimmunology 2017;6:e1261243. [DOI] [PMC free article] [PubMed] [Google Scholar]
- 9.Mulcahy LA, Pink RC, Carter DR. Routes and mechanisms of extracellular vesicle uptake. J Extracell Vesicles 2014;3. [DOI] [PMC free article] [PubMed] [Google Scholar]
- 10.Muller L, Mitsuhashi M, Simms P, Gooding WE, Whiteside TL. Tumor-derived exosomes regulate expression of immune function-related genes in human T cell subsets. Sci Rep 2016;6:20254. [DOI] [PMC free article] [PubMed] [Google Scholar]
- 11.Theodoraki MN, Yerneni SS, Hoffmann TK, Gooding WE, Whiteside TL. Clinical Significance of PD-L1(+) Exosomes in Plasma of Head and Neck Cancer Patients. Clin Cancer Res 2018;24:896–905. [DOI] [PMC free article] [PubMed] [Google Scholar]
- 12.Morales-Kastresana A, Jones JC. Flow Cytometric Analysis of Extracellular Vesicles. Methods Mol Biol 2017;1545:215–225. [DOI] [PMC free article] [PubMed] [Google Scholar]
- 13.Koliha N, Wiencek Y, Heider U, Jungst C, Kladt N, Krauthauser S, Johnston IC, Bosio A, Schauss A, Wild S. A novel multiplex bead-based platform highlights the diversity of extracellular vesicles. J Extracell Vesicles 2016;5:29975. [DOI] [PMC free article] [PubMed] [Google Scholar]
- 14.Hong CS, Funk S, Muller L, Boyiadzis M, Whiteside TL. Isolation of biologically active and morphologically intact exosomes from plasma of patients with cancer. J Extracell Vesicles 2016;5:29289. [DOI] [PMC free article] [PubMed] [Google Scholar]
- 15.Ludwig N, Hong C-S, Ludwig S, Azambuja JH, Sharma P, Theodoraki M-N, Whiteside TL. Isolation and Analysis of Tumor-Derived Exosomes. Current Protocols in Immunology 2019;127:e91. [DOI] [PMC free article] [PubMed] [Google Scholar]
- 16.Wang Y, Sabbatino F, Wang X, Ferrone S. Detection of chondroitin sulfate proteoglycan 4 (CSPG4) in melanoma. Methods Mol Biol 2014;1102:523–35. [DOI] [PubMed] [Google Scholar]
- 17.CLSI. Performance of Single Cell Immune Reponses Assays: Approved Guideline -- Second Edition. Wayne, PA: Clinical and Laboratory Standards Institute; 2013. [Google Scholar]
- 18.Zenger VE, Vogt R, Mandy F, Schwartz A, Marti GE. Quantitative flow cytometry: Inter-laboratory variation. Cytometry 1998;33:138–145. [DOI] [PubMed] [Google Scholar]
- 19.Schwartz A, Gaigalas AK, Wang L, Marti GE, Vogt RF, Fernandez-Repollet E. Formalization of the MESF unit of fluorescence intensity. Cytometry Part B: Clinical Cytometry 2004;57B:1–6. [DOI] [PubMed] [Google Scholar]
- 20.Sharma P, Ludwig S, Muller L, Hong CS, Kirkwood JM, Ferrone S, Whiteside TL. Immunoaffinity-based isolation of melanoma cell-derived exosomes from plasma of patients with melanoma. J Extracell Vesicles 2018;7:1435138. [DOI] [PMC free article] [PubMed] [Google Scholar]
- 21.Sharma P, Diergaarde B, Ferrone S, Kirkwood M, Whiteside T. Melanoma cell-derived exosomes in plasma of melanoma patients suppress functions of immune effector cells. Scientific Reports 2019;in press. [DOI] [PMC free article] [PubMed] [Google Scholar]
- 22.Morales-Kastresana A, Telford B, Musich TA, McKinnon K, Clayborne C, Braig Z, Rosner A, Demberg T, Watson DC, Karpova TS and et al. Labeling Extracellular Vesicles for Nanoscale Flow Cytometry. Sci Rep 2017;7:1878. [DOI] [PMC free article] [PubMed] [Google Scholar]
- 23.Ludwig S, Floros T, Theodoraki MN, Hong CS, Jackson EK, Lang S, Whiteside TL. Suppression of Lymphocyte Functions by Plasma Exosomes Correlates with Disease Activity in Patients with Head and Neck Cancer. Clin Cancer Res 2017;23:4843–4854. [DOI] [PMC free article] [PubMed] [Google Scholar]
- 24.Theodoraki MN, Hoffmann TK, Whiteside TL. Separation of plasma-derived exosomes into CD3((+)) and CD3((−)) fractions allows for association of immune cell and tumour cell markers with disease activity in HNSCC patients. Clin Exp Immunol 2018;192:271–283. [DOI] [PMC free article] [PubMed] [Google Scholar]
- 25.Theodoraki MN, Yerneni S, Gooding WE, Ohr J, Clump DA, Bauman JE, Ferris RL, Whiteside TL. Circulating exosomes measure responses to therapy in head and neck cancer patients treated with cetuximab, ipilimumab, and IMRT. Oncoimmunology 2019;8:1593805. [DOI] [PMC free article] [PubMed] [Google Scholar]
- 26.Ludwig S, Marczak L, Sharma P, Abramowicz A, Gawin M, Widlak P, Whiteside TL, Pietrowska M. Proteomes of exosomes from HPV(+) or HPV(−) head and neck cancer cells: differential enrichment in immunoregulatory proteins. Oncoimmunology 2019;8:1593808. [DOI] [PMC free article] [PubMed] [Google Scholar]
Associated Data
This section collects any data citations, data availability statements, or supplementary materials included in this article.
Supplementary Materials
SFigure 1. Capture and development of melanoma cell-derived exosomes with biotinylated anti-CSPG4 mAb on streptavidin beads. The capture conditions were as described by us earlier (14). Detection with the APC-labeled anti-CSPG4 (this Ab clone was different from the Ab clone used for capture) showed that nearly all immuocaptured exosomes were positive (upper panels). In contrast, exosomes NOT captured by anti-CSPG4 mAb were negative when stained with APC-labeled detection mAb.
SFigure 2. Surface and intracellular/intravesicular detection of perforin in NK92 cells and in NK92-derived exosomes on SA beads. In A, NK92 cels carried no surface perforin (upper panels), while permeabilized NK92 cells with fixation/permeabilization buffer (Cytoperm, BD Biosciences) have a high intracytoplasmic perforin content. In B, exosomes captured on SA beads using biotinylated anti-CD63 Ab had no surface perforin (upper panel) and after treatment with with BD fixation/permeabilization buffer for 30min, no perforin was detected, suggesting that the fixation and permeabilization treatment were not applicable to exosomes. In C, Western blots of the same NK92-derived exosomes showing the presence of perforin and granzyme B.
SFigure 3. NK92 cell-derived exosomes carry surface MIP-1β. In A, exosomes were captured on SA beads using biotinylated anti-CD81+anti-CD63 Abs and the development was performed with anti-PE-labeled MIP-1β Abs. Exosomes carry high levels of MIP-1β on the surface. In B, after treatment with 0.3% Triton X-100, detection of MIP-1β in lysate proteins captured on latex beads confirms its presence in exosomes.


