Abstract
Among the conducting polymers, poly(3,4-ethylene dioxythiophene):polystyrene sulfonate (PEDOT:PSS) has been extensively investigated for organic thermoelectric device applications owing to its high electrical conductivity (σ), flexibility and easy processability. The thermoelectric (TE) power factor – a factor that determines the efficiency of a thermoelectric material, is very critical in developing high-efficiency thermoelectric devices. The TE power factor of PEDOT:PSS requires further enhancement in realizing efficient organic TE devices. Recently, we have reported a layer-by-layer deposition technique to deposit PEDOT:PSS and poly aniline-camphor sulfonic acid (PANI-CSA) forming a PEDOT:PSS/PANI-CSA multilayer (ML) thin film structure with an enhanced thermoelectric power factor up to 49 μW m−1 K−1. However, there exist several ambiguities regarding the parameters that control the TE power factor in (ML) thin films. In order to identify the parameters that control the TE power factor of ML thin films, PEDOT:PSS/PANI-CSA ML thin films have been deposited by varying the deposition conditions such as spin speed, the number of layers, solvent treatment, and thickness of each layer. A thermoelectric power factor up to 325 μW m−1 K−1 is achieved by properly optimizing the spin speed, number of layers, and the thickness of each layer in ML thin films. The enhanced thermoelectric power factor is the result of multiple factors such as stretching of PEDOT chains, structural conformation change from benzoid to quinoid, and excess PSS removal from the top of the PEDOT:PSS layer through solvent treatment and at the PEDOT:PSS/PANI-CSA interface. Our study provides the basis for realizing an enhanced thermoelectric power factor of organic thermoelectric multilayer structures consisting of ultra-thin polymer thin films similar to inorganic superlattices having 2D confinement.
The key factors that control the thermoelectric (TE) properties of PEDOT:PSS/PANI-CSA multilayer thin films to enhance the TE power factor.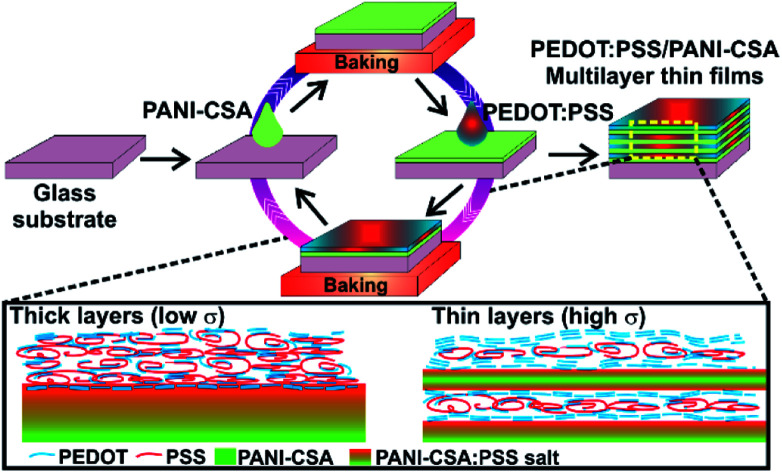
Introduction
The layer-by-layer (LBL) sequential deposition of polymers is an easy, efficient, and versatile way to fabricate nanostructured macroscopic films exhibiting a wide range of applications. In the LBL process, the alternate polymers are adsorbed onto each other via hydrogen bonding, hydrophobic or covalent interactions.1–4 Our group and others have used this technique to fabricate multilayer (ML) thermoelectric (TE) thin films exhibiting an enhanced thermoelectric power factor (P). The multilayer thin films mostly comprise sequentially deposited polymers as well as polymer/inorganic hybrids.5–11 The major advantage of this technique is that enhanced thermoelectric properties can be achieved regardless of the inferior TE properties of the individual layers. Moreover, the thermal conductivity of polymers is intrinsically low and the thermal conductivity of such ML thin films will be even lower because of the phonon scattering at the chain/grain boundaries.12 PEDOT:PSS and PANI-CSA are the two major polymers that have been used for various applications such as TE thin films, solar cells, and energy devices.13–17 PEDOT:PSS has been widely used polymer to fabricate organic TE thin films so that various strategies have been developed to improve the TE parameters – electrical conductivity (σ) and Seebeck coefficient (S).18–28 Our group has developed PEDOT:PSS/PANI-CSA ML thin films and observed enhanced TE properties compared to those of individual PEDOT:PSS or PANI-CSA layers.5 The interdependency of the TE parameters of PEDOT:PSS thin films was decoupled through growing alternating layers of PEDOT:PSS and PANI-CSA thin films.5 In a recent study on PEDOT:PSS/PANI ML thin films, Andrei et al. reported that the enhancement in TE properties is observed because of the removal of excess PSS chains from the PEDOT:PSS via the formation of PANI:PSS salt at the PEDOT:PSS/PANI interface.6 However, the TE properties of the ML thin films deposited by them were inferior.6 The inconsistency in the TE properties of our films and those reported by Andrei et al. is because of various reasons such as the differences in the precursor solutions, deposition method, spin speed, etc. Fan et al. reported that higher molecular weight has been found to enhance the TE properties of Clevios PH1000 PEDOT:PSS.29 This suggests that various factors contribute toward the enhancement of the TE properties and the lack of understanding of those key factors will result in the inferior TE properties of the grown ML thin films. A thorough experimental study is required and the parameters to control TE performances such as σ, S, and power factor should be figured out to further improve the TE performances of PEDOT:PSS/PANI-CSA ML thin films. Apart from the inherent issues of polymers such as low σ and S, the degradation of the conducting polymer thin films over time is also a major issue which requires further attention.30 However, we have not focussed the issue of degradation of polymer thin films in this study.
Herein we grow the PEDOT:PSS/PANI-CSA ML thin film structures via layer-by-layer deposition using a spin coating technique. In order to identify how TE properties of ML thin films vary, a detailed study was carried out by varying the spin speed, the thickness of each layer, and number of layers in the ML thin films. The proper control of the experimental parameters has resulted in the optimization of the σ, and S values which resulted in achieving an enhanced TE power factor in PEDOT:PSS/PANI-CSA ML thin films.
Experiment
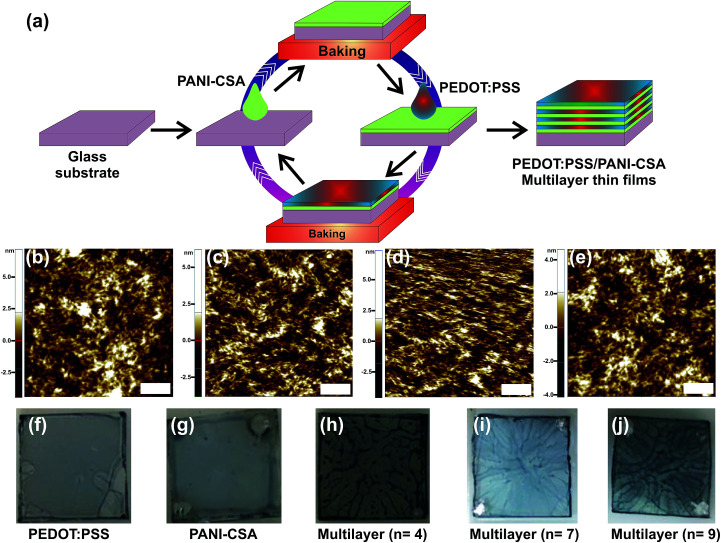
The preparation methods of the precursor solutions and the deposition of the multilayer thin films were carried out as described in our early report.5 Note that the PANI-CSA solution is different from that we used in our early studies.5 The detailed description of the experimental methods is given in the ESI.† The difference in the PANI-CSA precursor solution used in both studies is also given in detail. The PEDOT:PSS/PANI-CSA thin films were deposited at various spin speeds ranging from 3000–9000 rpm, in steps of 1000 rpm. A schematic showing the deposition of ML thin films is shown in Fig. 1(a).
Fig. 1. (a) The schematic showing the deposition of PEDOT:PSS/PANI-CSA ML thin films via layer-by-layer deposition technique. After the deposition of the ML thin films the top layer PEDOT:PSS is treated with DMSO to further enhance the conductivity. (b–e) AFM images of the ML thin films deposited at a spin speed of 4000, 5000, 7000, and 9000 rpm, respectively. The scale bar is 200 nm. (f–j) Digital photographs of the PEDOT:PSS, PANI-CSA, and PEDOT:PSS/PANI-CSA ML thin films deposited at a spin speed of 7000 rpm.
Fig. 1(b–e) show the atomic force microscope (AFM) images of the ML thin films deposited at various spin speeds. The as-deposited single-layer and ML thin films were post-treated using dimethyl sulfoxide (DMSO). In the ML thin films only top layer PEDOT:PSS thin film was treated using DMSO solvent. All the films were deposited in a glove box under N2 ambient.
Results and discussions
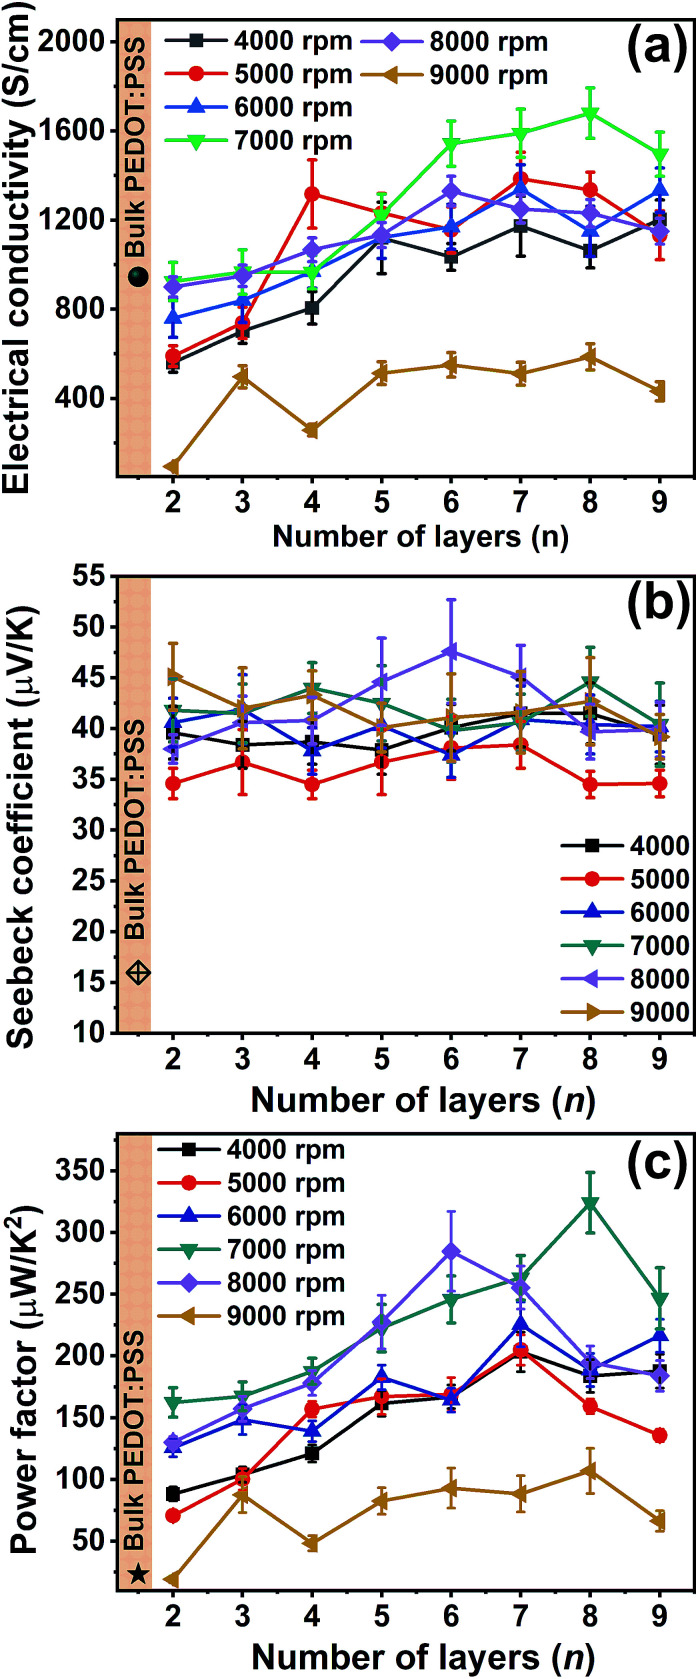
The AFM images displayed in the Fig. 1(b–e) and the root mean square (rms) roughness data show that, as the spin speed increases, the films become rougher. The digital photographs of the as-deposited PEDOT:PSS, PANI-CSA, and PEDOT:PSS/PANI-CSA ML thin films are also shown in Fig. 1(f–j). The as-deposited PEDOT:PSS and PANI-CSA thin films are highly uniform and transparent while the PEDOT:PSS/PANI-CSA ML thin films are less transparent compared to the component thin films. The σ and S values of the PEDOT:PSS/PANI-CSA ML thin films according to the number of layers and various spin speeds are shown in Fig. 2(b–c), respectively. Interestingly, the σ of the ML thin films increases with the number of layers as well as spin speed.
Fig. 2. (a) The electrical conductivity, (b) the Seebeck coefficient and (c) the power factor of PEDOT:PSS/PANI-CSA ML thin films deposited with respect to the number of layers and at various spin speed.
The highest σ of 1680 S cm−1 was achieved for the eight-layer thin film which was deposited at a spin speed of 7000 rpm. However, the S values did not show any significant variation with an increase in the number of layers or spin speed. It should be noted that the S values of all the ML thin films were higher than those of the bulk PEDOT:PSS thin films.
Several mechanisms have been proposed for the enhancement of σ in PEDOT:PSS thin films. The chemical used to treat the PEDOT:PSS thin film has been found critical in determining the σ of the PEDOT:PSS thin films.31 Several studies have been focused on the morphological variations of the PEDOT:PSS thin films.32–35 The phase separation of PEDOT and PSS resulting in inter-grain hopping, removal of excess PSS removal from the surface of the PEDOT:PSS thin film, conformation changes from benzoid to quinoid, formation of PEDOT nanocrystals, etc have been accounted for the observed enhancement of σ in PEDOT:PSS thin films.32–35 The post-treatment of the spin cast PEDOT:PSS thin films is critical and treatment using polar solvents has been found beneficial in enhancing σ.36 In the present study, we have treated the top-most layer of PEDOT:PSS thin film in the ML structure using the DMSO solvent. The enhancement of conductivity achieved through solvent treatment should be similar in all the films; however, the σ enhances with the number of layers in the ML thin films. Several reasons can be attributed to the observed enhancement in σ of ML thin films. This is because, with an increase in the number of layers, stretching of the PEDOT chains occurs which consequently results in an enhanced σ.5 In addition to the stretching, complimentary doping can also be accounted for the enhanced σ.6 It is reported that the PSS is selectively removed from PEDOT:PSS layer at the PEDOT:PSS/PANI-CSA interface via the formation of PANI:PSS salt.6 In the present study, with an increase in the number of the layer in ML thin films, additional PSS removal occurs which resulted in an enhanced σ (discussed later).
The Seebeck coefficient variation occurs when the doping level is varied in PEDOT:PSS. This is because the carrier concentration varies when the doping level is varied. For example, the reduction of PEDOT:PSS (PSS removal) results in the change in the carrier type from bipolaron to polaron and then even to neutral chains.37 Such variations in the carrier type occur when the oxidation state is changed and therefore by controlling the oxidation state, tuning of the S values is possible. However, in the present study, the S value as high as 44 μV K−1 was observed for 8 layer films whereas bilayer films have an S value of around 39 μV K−1, which implies only a nominal increment in S values could be achieved. This is indicative of the fact that only a nominal alteration of the oxidation state of the PEDOT could be achieved. It should be noted that an enhancement in σ usually results in a decrease of the S values. The increase of σ and slight increment in the S values of the ML thin films have resulted in an overall enhancement of the power factor. The power factor as high as 325 μW m−1 K−2 was achieved for eight-layer ML thin films.
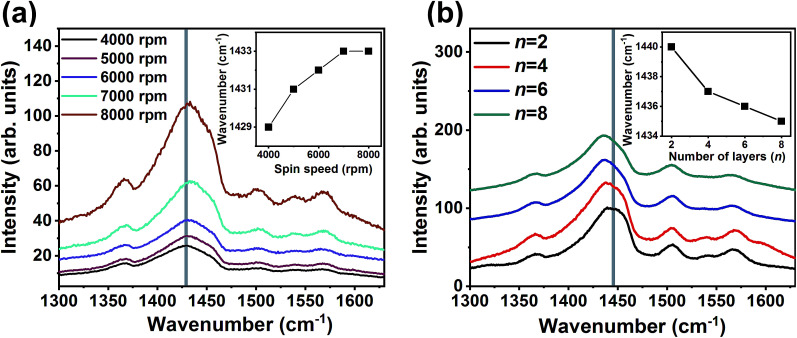
The enhancement observed for σ values could also be possible through the variation in the conformation of the PEDOT chains. In order to analyze the conformation of PEDOT chains in the single and ML thin films, Raman spectra were recorded and are shown in Fig. 3. The spectra consist of an intense vibration peaking at 1440 cm−1. This peak originates from the Cα = Cβ stretching vibrations. The Raman spectra (Fig. 3a) appear similar for all the single-PEDOT:PSS thin films deposited at various spin speed and the Cα = Cβ stretching vibration peak position slightly shifts towards higher vibrational frequencies suggesting no significant variation in conformation occurs with a variation in the spin speed. For the ML thin films the intense peak at 1440 cm−1 shifts towards lower vibrational frequencies with an increase in the number of layers. The peak shifts from 1440 cm−1 for one – PEDOT:PSS/PANI-CSA layer to 1434 cm−1 for the eight-layer thin films. This shift corresponds to a conformation change from benzoid to the quinoid structure of the PEDOT chains.5,38,39
Fig. 3. The Raman spectra of single layer-PEDOT:PSS thin films as a function of spin speed and (b) PEDOT:PSS/PANI-CSA ML thin films with respect to the number of layers. The insets of (a) and (b) show the corresponding variations of the peak of the Cα = Cβ vibrations.
The benzoid structure is coiled while quinoid structure has a linear chain conformation which helps in the formation of highly interconnected PEDOT chains. This transformation in the conformation results in the formation of highly interconnected PEDOT chains which consequently enhanced σ in the ML thin films.
In order to obtain a deeper insight on the variations in the oxidation state along with the conformation change, the Raman spectra of two layers and eight layers films were resolved and fitted spectra are shown in ESI Fig. S1.† The intense peak observed around 1440 cm−1 can be resolved into two peaks – one around 1422 cm−1 and the other around 1448 cm−1. The band appeared around 1448 cm−1 suggests the existence of oxidized structure while the band at 1422 cm−1 arises from the neutral structure. For the ML thin films having eight layers, the relative intensity of the 1422 cm−1 peak increases as compared to the intensity of 1448 cm−1 peak. The increased percentage of neutral (reduced) structure in PEDOT:PSS is the result of de-doping which occurs through PSS removal. This agrees well with the observed increase in S values. Additionally, the intensity of the peak at 1540 cm−1 which also corresponds to the oxidized structure, also decreases when the number of layers is increased from two to eight. In the ML films having eight layers, an additional peak at 1594 cm−1 also appears. This peak is absent in films having only two layers – an indication of the transformation from an oxidized state to a neutral state. The conformation change from benzoid to quinoid enhances the σ while the de-doping occurs through the removal of PSS from the PEDOT:PSS layer increases the S values.
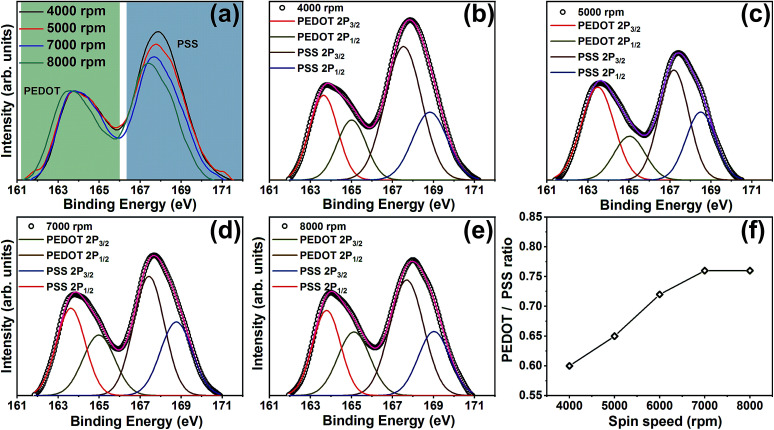
Further confirmation on excess PSS removal has been obtained from the S 2p XPS spectra of ML thin films. Fig. 4(a) shows the S 2p spectra of ML thin films (eight-layer) deposited at various spin speeds. There are two XPS bands in which the one ranging between 166–172 eV corresponds to the sulfur atoms in PSS while the sulfur atoms in PEDOT contributes to the band observed from 161–166 eV. The peak fitting analysis of the spectra recorded at 4000, 5000, 7000, and 8000 rpm is shown in Fig. 4(b–e). Both the peaks were deconvoluted into two peaks corresponding to S 2p3/2 and 2p1/2. The PEDOT/PSS ratio of the films with respect to the spin speeds are shown in Fig. 4(f). It is evident from Fig. 4(a) that the PSS removal occurs with an increase in the spin speed. Note that the top PEDOT:PSS layer of all our ML thin films were treated using DMSO. If the PSS removal occurs only from the top layer, then the PEDOT/PSS ratio of the films should remain the same. In order to confirm whether any variation in the PEDOT/PSS ratio occurs in single-layer-PEDOT:PSS thin films with the variation of spin speed, we also recorded the S 2p XPS spectra of single-layer-PEDOT:PSS thin films, which is shown in ESI Fig. S2.†
Fig. 4. S 2p XPS spectra of (a) PEDOT:PSS/PANI-CSA multilayer (eight-layers) thin films deposited at various spin speeds, (b–e) the fitted XPS spectra, and (f) PEDOT:PSS ratio at various spin speeds.
Interestingly, the S 2p XPS spectra of all the single-layer-PEDOT:PSS thin films deposited at various spin speed show similar spectra and PEDOT/PSS ratio remain almost same in all the films, irrespective of the spin speed. Therefore it is beyond doubt that the additional PSS removal occurred during the formation of PEDOT:PSS/PANI-CSA ML thin films. In the S 2p XPS spectra of ML thin films, along with the observed reduction in PSS, a shift of both the peaks corresponding to sulfur atoms in PEDOT and PSS towards lower binding energy is observed. This is interesting because the shift of the XPS peak position indicates the weakening of the electrostatic interaction between PEDOT and PSS.40,41 The shift towards lower binding energy also hints at the de-doping of the PEDOT that occurs via PSS removal.41 This dedoping has been found beneficial in slightly enhancing the S values of the ML thin films, as compared to the single-layer PEDOT:PSS thin films. The PEDOT/PSS ratio was calculated using the integral intensity of PEDOT and PSS peaks and shows that an increase in PEDOT/PSS ratio occurs with an increase in the spin speed which significantly contributed to the enhancement in σ.
Even though the removal of excess PSS has been verified from Raman and XPS analyses, the role of the thickness of each layer in the ML structure needs to be analyzed. As the spin speed increases, the thickness of each layer considerably decreases. In order to shed light on the role of the thickness of each layer on the ML thin films, we prepared eight layer-ML thin films by varying the individual layer thickness at a fixed spin speed of 7000 rpm. We found that one of the major parameters that affect the TE properties of the PEDOT:PSS thin films is the thickness of the films.
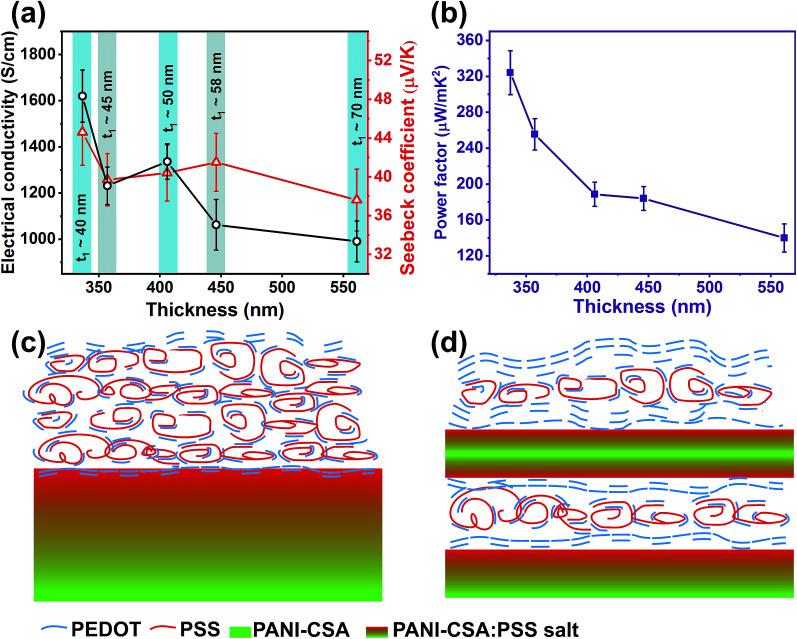
The variations in σ and S values with respect to the thickness of the ML thin films are shown in Fig. 5(a). When the thickness of each PEDOT:PSS/PANI-CSA layer was increased, the σ, S, and the power factor decreased, confirming the fact that the thickness of each PEDOT:PSS/PANI-CSA layer is also critical in deciding the TE parameters of the ML thin films. It is reported that at the interface of the PEDOT:PSS/PANI layers in ML thin films, selective removal of PSS occurs via the formation of PANI:PSS salt.6 In our study, we also expect a similar salt formation at the PEDOT:PSS/PANI-CSA interface region. Since the top layer is treated using DMSO, PSS removal occurs from the top region of the PEDOT:PSS thin films. If the thickness of the PEDOT:PSS thin films are high, then PSS will only be removed from a small region (around 10 nm) from the top and bottom of the films. If the films are thin enough, then it is possible to remove PSS from the wider regions of PEDOT:PSS thin films which will result in enhanced σ and S values. Therefore, the thickness of the PEDOT:PSS and PANI-CSA thin films is found to be one of the major factors in determining the electrical conductivity of the PEDOT:PSS/PANI-CSA ML thin films. As the thickness (t1) of each layer (one-PEDOT:PSS/PANI-CSA layer) increases, the σ and S values decreases. A schematic showing the excess PSS removal from the top and at the PEDOT:PSS/PANI-CSA interface is shown in Fig. 5(c and d).
Fig. 5. (a) The electrical conductivity and Seebeck coefficients, (b) power factor of the PEDOT:PSS/PANI-CSA ML thin films at different layer thickness. The t1 in the figure shows the thickness of one PEDOT:PSS/PANI-CSA layer. (c and d) Schematics of the PEDOT:PSS/PANI-CSA ML thin films at different thickness. When the thickness of each layer decreases, the TE performances are enhanced through the removal of PSS from the PEDOT:PSS layer.
In order to observe the conformation changes in the films with an increase in the thickness of each PEDOT:PSS/PANI-CSA layer, the Raman spectra of ML thin films prepared by varying the thickness exhibit were recorded (ESI, Fig. S3†). The Raman spectra exhibit no significant change in the peak at 1435 cm−1, which suggest conformation variations does not occur when the number of layers and spin speed are fixed. Therefore, a combination of parameters such as (1) stretching of PEDOT chains, (2) conformation change from benzoid to quinoid, and (3) excess PSS removal from the top surface through solvent treatment and at the PEDOT:PSS/PANI-CSA interface has resulted in the enhanced σ, S, and power factor in our ML thin films. It should be noted that any variations in these parameters would significantly affect the σ and S and are found to be detrimental for achieving a high TE power factor. Through a proper engineering of the PEDOT:PSS/PANI-CSA ML structures, we could achieve a minimum thickness of one-PEDOT:PSS/PANI-CSA layer up to 40 nm (17 nm for PEDOT:PSS and 23 nm for PANI-CSA) for which we obtained σ up to 1680 S cm−1, S value up to 44 μV K−1, which corresponds to a power factor of 325 μW m−1 K−1.
Conclusions
The experimental parameters such as spin speed, solvent treatment, number and the thickness of each layer used for the preparation of PEDOT:PSS/PANI-CSA ML thin films were optimized in this study. The enhancement in σ and S values were achieved by properly controlling the experimental parameters. For ML thin films constituting of eight–PEDOT:PSS/PANI-CSA layers deposited at a spin speed of 7000 rpm, we achieved a σ up to 1680 S cm−1, S value of 44 μV K−1 and a power factor up to 325 μW m−1 K−1. It is concluded that the enhancement in the TE parameters was achieved because of multiple parameters – morphological variations via stretching of PEDOT chains, conformation changes from benzoid to quinoid, and excess PSS removal from the top of the PEDOT:PSS thin film through solvent treatment and at the PEDOT:PSS/PANI-CSA interface. Further optimization is possible by reducing the thickness of each layer in ML thin films and such films would benefit from the 2D confinement as observed in inorganic superlattices which would result in further enhancement of the TE properties.
Conflicts of interest
There are no conflicts to declare.
Supplementary Material
Acknowledgments
JYJ acknowledges support by Creative Materials Discovery Program (2017M3D1A1040828) funded by the Ministry of Science and ICT, by LG electronics, and the “GRI (GIST Research Institute)” project through a grant provided by GIST in 2016 and by the National Strategic Project-Fine particle of the National Research Foundation of Korea (NRF) funded by the Ministry of Science and ICT (MSIT), the Ministry of Environment (ME), and the Ministry of Health and Welfare (MOHW) (2017M3D8A1091937).
Electronic supplementary information (ESI) available: Fitted Raman spectra of PEDOT:PSS/PANI-CSA multilayer thin films and XPS and Raman spectra of single layer PEDOT:PSS thin films. See DOI: 10.1039/c9ra02112d
Notes and references
- Borges J. Mano J. F. Chem. Rev. 2014;114:8883–8942. doi: 10.1021/cr400531v. [DOI] [PubMed] [Google Scholar]
- Richardson J. J. Cui J. Björnmalm M. Braunger J. A. Ejima H. Caruso F. Chem. Rev. 2016;116:14828–14867. doi: 10.1021/acs.chemrev.6b00627. [DOI] [PubMed] [Google Scholar]
- Sukhishvili S. A. Granick S. Macromolecules. 2002;35:301–310. doi: 10.1021/ma011346c. [DOI] [Google Scholar]
- Yu Y. Si Y. Bechler S. L. Liu B. Lynn D. M. Biomacromolecules. 2015;16:2998–3007. doi: 10.1021/acs.biomac.5b00905. [DOI] [PMC free article] [PubMed] [Google Scholar]
- Lee H. J. Anoop G. Lee H. J. Kim C. Park J. W. Choi J. Kim H. Kim Y. J. Lee E. Lee S. G. Kim Y. M. Lee J. H. Jo J. Y. Energy Environ. Sci. 2016;9:2806–2811. doi: 10.1039/C5EE03063C. [DOI] [Google Scholar]
- Andrei V. Bethke K. Madzharova F. Bronneberg A. C. Kneipp J. Rademann K. ACS Appl. Mater. Interfaces. 2017;9:33308–33316. doi: 10.1021/acsami.7b10106. [DOI] [PubMed] [Google Scholar]
- Cho C. Stevens B. Hsu J.-H. H. Bureau R. Hagen D. A. Regev O. Yu C. Grunlan J. C. Adv. Mater. 2015;27:2996–3001. doi: 10.1002/adma.201405738. [DOI] [PubMed] [Google Scholar]
- Culebras M. Cho C. Krecker M. Smith R. Song Y. Gómez C. M. Cantarero A. Grunlan J. C. ACS Appl. Mater. Interfaces. 2017;9:6306–6313. doi: 10.1021/acsami.6b15327. [DOI] [PubMed] [Google Scholar]
- Cho C. Culebras M. Wallace K. L. Song Y. Holder K. Hsu J.-H. H. Yu C. Grunlan J. C. Nano Energy. 2016;28:426–432. doi: 10.1016/j.nanoen.2016.08.063. [DOI] [Google Scholar]
- Fan Z. Du D. Guan X. Ouyang J. Nano Energy. 2018;51:481–488. doi: 10.1016/j.nanoen.2018.07.002. [DOI] [Google Scholar]
- Goo G. Anoop G. Unithrattil S. Kim W. S. Lee H. J. Bin Kim H. Jung M. Park J. Ko H. C. Jo J. Y. Adv. Electron. Mater. 2019;5:1800786. doi: 10.1002/aelm.201800786. [DOI] [Google Scholar]
- Zheng Y. Zeng H. Zhu Q. Xu J. J. Mater. Chem. C. 2018;6:8858–8873. doi: 10.1039/C8TC01900B. [DOI] [Google Scholar]
- Sun K. Zhang S. Li P. Xia Y. Zhang X. Du D. Isikgor F. H. Ouyang J. J. Mater. Sci.: Mater. Electron. 2015;26:4438–4462. doi: 10.1007/s10854-015-2895-5. [DOI] [Google Scholar]
- Sen T. Mishra S. Shimpi N. G. RSC Adv. 2016;6:42196–42222. doi: 10.1039/C6RA03049A. [DOI] [Google Scholar]
- Baker C. O. Huang X. Nelson W. Kaner R. B. Chem. Soc. Rev. 2017;46:1510–1525. doi: 10.1039/C6CS00555A. [DOI] [PubMed] [Google Scholar]
- Ahamed M. I. Inamuddin Asiri A. M. Luqman M. Lutfullah Adv. Mater. Sci. Eng. 2019;2019:1–11. doi: 10.1155/2019/4764198. [DOI] [Google Scholar]
- Kirchmeyer S. Reuter K. J. Mater. Chem. 2005;15:2077. doi: 10.1039/B417803N. [DOI] [Google Scholar]
- Zhang S. FAN Z. Wang X. Zhang Z. Ouyang J. J. Mater. Chem. A. 2018;6:7080–7087. doi: 10.1039/C7TA11148G. [DOI] [Google Scholar]
- Xiong J. Jiang F. Zhou W. Liu C. Xu J. RSC Adv. 2015;5:60708–60712. doi: 10.1039/C5RA07820B. [DOI] [Google Scholar]
- Guan X. Cheng H. Ouyang J. J. Mater. Chem. A. 2018;6:19347–19352. doi: 10.1039/C8TA08387H. [DOI] [Google Scholar]
- Wang C. Sun K. Fu J. Chen R. Li M. Zang Z. Liu X. Li B. Gong H. Ouyang J. Adv. Sustainable Syst. 2018:1800085. doi: 10.1002/adsu.201800085. [DOI] [Google Scholar]
- Shi H. Liu C. Jiang Q. Xu J. Adv. Electron. Mater. 2015;1:1–16. [Google Scholar]
- Kim Y. Cho W. Kim Y. Cho H. Kim J. H. J. Mater. Chem. C. 2018;6:8906–8913. doi: 10.1039/C8TC02598C. [DOI] [Google Scholar]
- Reyes-Reyes M. Cruz-Cruz I. López-Sandoval R. J. Phys. Chem. C. 2010;114:20220–20224. doi: 10.1021/jp107386x. [DOI] [Google Scholar]
- Ouyang J. ACS Appl. Mater. Interfaces. 2013;5:13082–13088. doi: 10.1021/am404113n. [DOI] [PubMed] [Google Scholar]
- Andrei V. Bethke K. Madzharova F. Beeg S. Knop-Gericke A. Kneipp J. Rademann K. Adv. Electron. Mater. 2017;3:1600473. doi: 10.1002/aelm.201600473. [DOI] [Google Scholar]
- Wu F. Li P. Sun K. Zhou Y. Chen W. Fu J. Li M. Lu S. Wei D. Tang X. Zang Z. Sun L. Liu X. Ouyang J. Adv. Electron. Mater. 2017;3:1700047. doi: 10.1002/aelm.201700047. [DOI] [Google Scholar]
- Tee B. C. K. Ouyang J. Adv. Mater. 2018:1802560. doi: 10.1002/adma.201802560. [DOI] [PubMed] [Google Scholar]
- Fan Z. Du D. Yao H. Ouyang J. ACS Appl. Mater. Interfaces. 2017;9:11732–11738. doi: 10.1021/acsami.6b15158. [DOI] [PubMed] [Google Scholar]
- Láng G. G. Ujvári M. Vesztergom S. Kondratiev V. Gubicza J. Szekeres K. J. Z. Phys. Chem. 2016;230:1281–1302. [Google Scholar]
- Alemu D. Wei H. Y. Ho K. C. Chu C. W. Energy Environ. Sci. 2012;5:9662–9671. doi: 10.1039/C2EE22595F. [DOI] [Google Scholar]
- Takano T. Masunaga H. Fujiwara A. Okuzaki H. Sasaki T. Macromolecules. 2012;45:3859–3865. doi: 10.1021/ma300120g. [DOI] [Google Scholar]
- Kim Y. H. Sachse C. Machala M. L. May C. Müller-Meskamp L. Leo K. Adv. Funct. Mater. 2011;21:1076–1081. doi: 10.1002/adfm.201002290. [DOI] [Google Scholar]
- Na S.-I. Kim S.-S. Jo J. Kim D.-Y. Adv. Mater. 2008;20:4061–4067. doi: 10.1002/adma.200800338. [DOI] [Google Scholar]
- Huang J. Miller P. F. Wilson J. S. de Mello A. J. de Mello J. C. Bradley D. D. C. Adv. Funct. Mater. 2005;15:290–296. doi: 10.1002/adfm.200400073. [DOI] [Google Scholar]
- Alemu Mengistie D. Wang P. C. Chu C. W. J. Mater. Chem. A. 2013;1:9907–9915. doi: 10.1039/C3TA11726J. [DOI] [Google Scholar]
- Lee S. H. Park H. Kim S. Son W. Cheong I. W. Kim J. H. J. Mater. Chem. A. 2014;2:7288–7294. doi: 10.1039/C4TA00700J. [DOI] [Google Scholar]
- Fan Z. Li P. Du D. Ouyang J. Adv. Energy Mater. 2017;7:1602116. doi: 10.1002/aenm.201602116. [DOI] [Google Scholar]
- Ouyang J. Xu Q. Chu C. W. Yang Y. Li G. Shinar J. Polymer. 2004;45:8443–8450. doi: 10.1016/j.polymer.2004.10.001. [DOI] [Google Scholar]
- Zhu Z. Liu C. Jiang Q. Shi H. Xu J. Jiang F. Xiong J. Liu E. Synth. Met. 2015;209:313–318. doi: 10.1016/j.synthmet.2015.08.006. [DOI] [Google Scholar]
- Spanninga S. A. Martin D. C. Chen Z. J. Phys. Chem. C. 2009;113:5585–5592. doi: 10.1021/jp811282f. [DOI] [Google Scholar]
Associated Data
This section collects any data citations, data availability statements, or supplementary materials included in this article.


