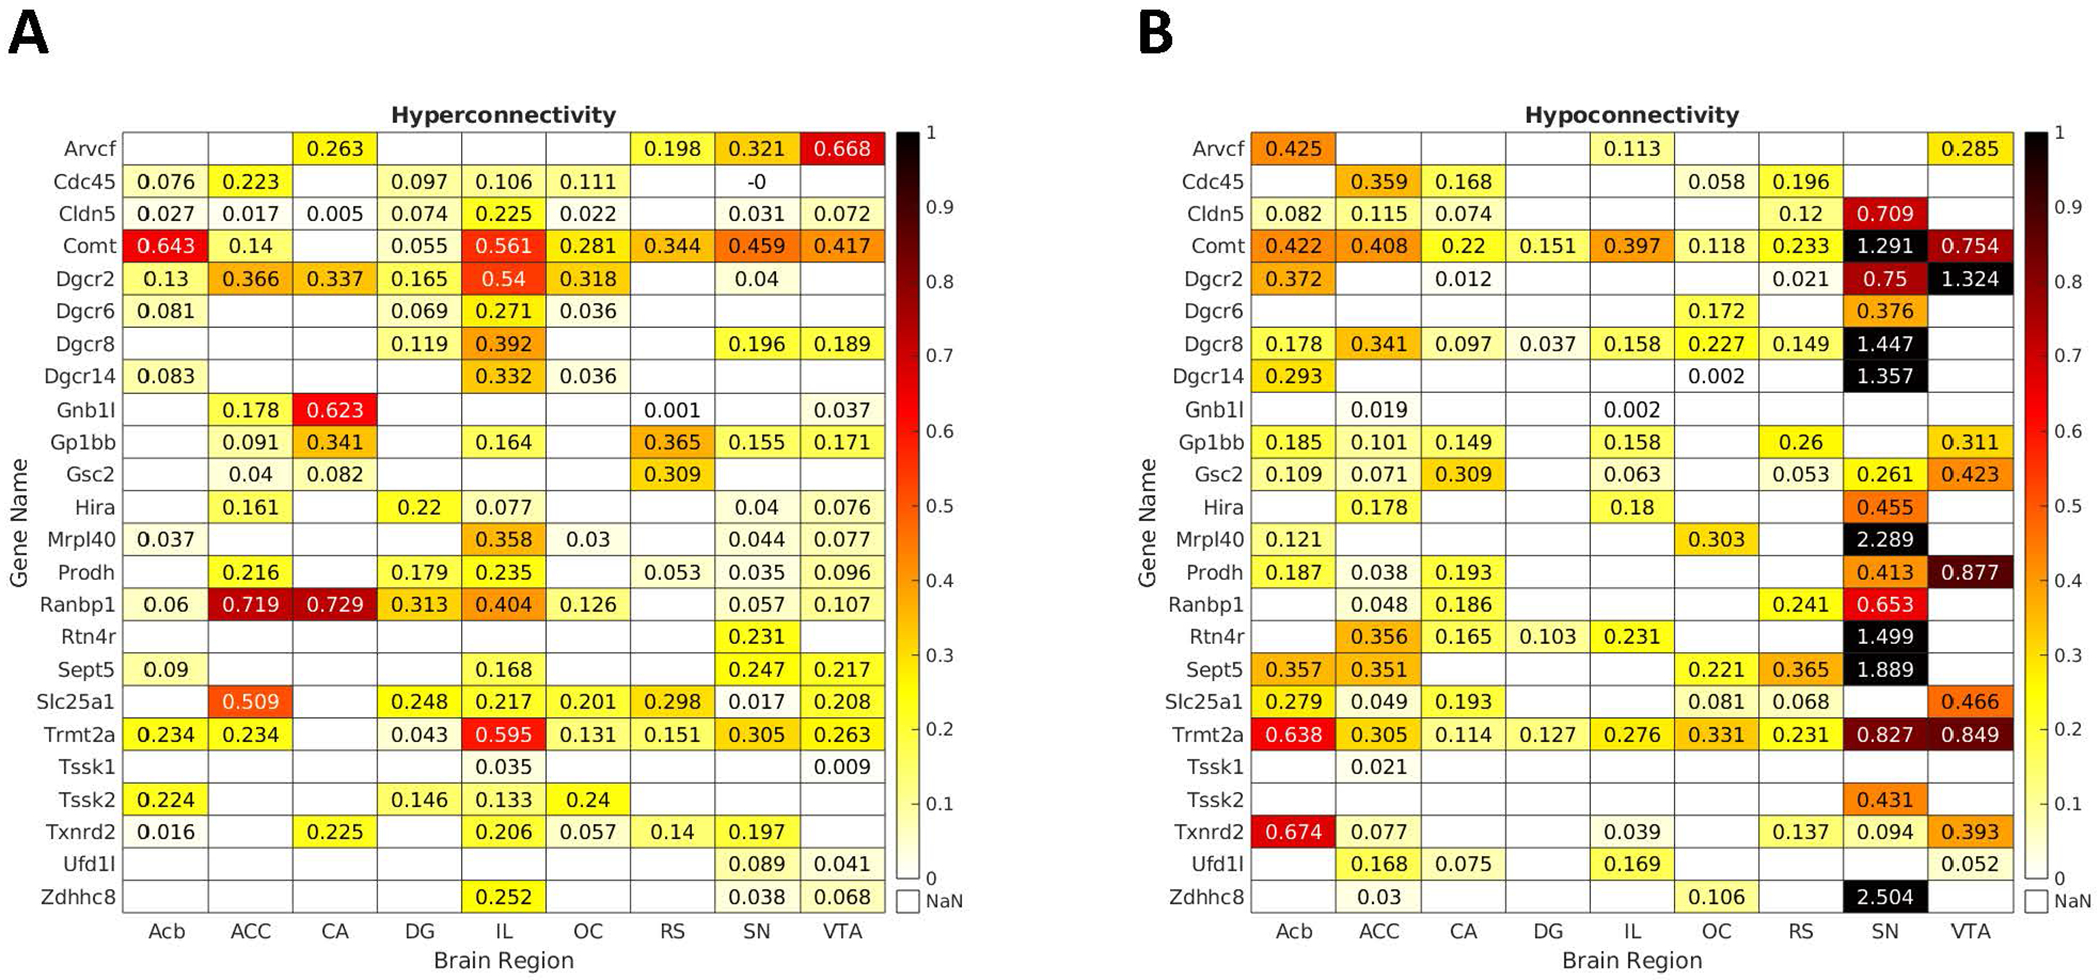
Figure 5. Genes overexpressed in networks indicating hyper- and hypoconnectivity for seed regions.

Depicted are the matrices presenting fold changes between neural networks hyper- (left) and hypoconnected (right) to the seed regions and spatial expression patterns of the hemi-deleted genes in these networks. Only values for significant overexpression are provided. Comt and Trmt2a were the most consistently implicated genes across the studied networks. Other genes showed expression patterns that were associated either with hyper- or hypoconnected networks.
