

Abstract
Prescribed fire is an increasingly important tool in restoring ecological conditions and reducing uncontrolled wildfire. Prescribed burn techniques could reduce public health impacts associated with wildfire smoke exposure. However, there have been few assessments of the health impacts of prescribed burning, and potential vulnerabilities among populations exposed to smoke from prescribed fires. Our study area focused on counties in and near U.S. National Forests – a set of lands distributed across the U.S. In county-level analyses, we compared the sociodemographic and health characteristics of areas that were exposed with those that were not exposed to prescribe burns during the years 2010–2019 on a national level and within three regions. In addition, using spatial error regression models, we looked for associations between prescribed fire exposure and health behaviors and outcomes while controlling for spatial autocorrelation. On a national level, we found disproportionate prescribed fire exposure in rural counties with higher percentage mobile home and vacant housing units, and higher percentage African-American and white populations. Regionally, we found evidence of disproportionate exposure to prescribed burns among counties with lower percentage white population, higher percentage Hispanic population and mobile homes in the southern region, and to high poverty counties with high vacancy in the western region. These findings could indicate that vulnerable populations face potential health risks from prescribed burning smoke exposure, but also that they are not missing out on the benefits of prescribed burning, which could involve considerably lower smoke exposure compared to uncontrolled wildfire. In addition, in regression analyses, we found no evidence of disproportionate health burden in exposed compared to unexposed counties. Awareness of these patterns could influence both large-scale or institutional polices about prescribed burning practice, and could be used to build decision-making factors into modeling tools and smoke management plans, as well as community-engagement around wildfire risk reduction.
Keywords: Prescribed burning, Smoke exposure, Social and health burden
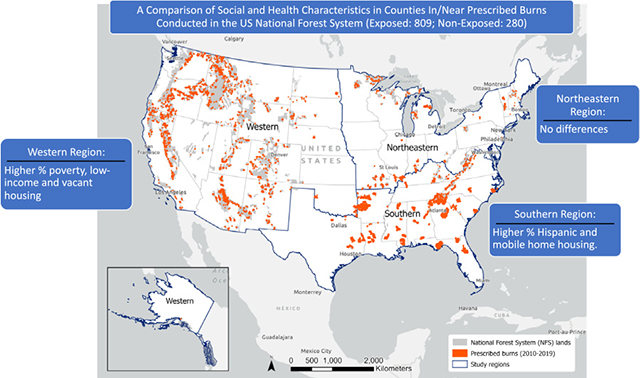
Graphical Abstract
1. Introduction
Over the past 40 years, the annual number of wildfires and the length of the wildfire season have increased rapidly (Abatzoglou and Williams, 2016; Dennison et al., 2014). In the United States (U.S.) over the past 40 years, wildfire-related burned area has increased by a factor of four (Burke et al., 2021). Rapidly expanding residential development within and in close proximity to wildland vegetation has the dual outcomes of increasing wildfire ignitions and placing more homes and people at wildfire risk (e.g. associated with burning or smoke exposure) (Radeloff et al., 2018). Furthermore, climate conditions conducive to larger and more frequent wildfires (e.g. droughts, favorable fireweather patterns, longer fire seasons, increased fuel loads) are predicted for the future in much of the U.S. (Bowman et al., 2017; Luo et al., 2013; Spracklen et al., 2009; Tang et al., 2015; Yue et al., 2013; Zhang et al., 2010).
One of the most substantial impacts of wildfires on human health comes from exposure to smoke during and after wildfire events (Finlay et al., 2012; Haikerwal et al., 2015a; Kondo et al., 2019; Rappold et al., 2019; Wettstein et al., 2018). Consistent evidence has demonstrated an association between wildfire-related particulate matter (PM) exposure and adverse respiratory health outcomes, including asthma, chronic obstructive pulmonary disease (COPD), and upper respiratory symptoms (Adetona et al., 2016; Liu et al., 2015; Reid et al., 2016). Some recent studies also document higher proportions of emergency room admission for heart attack and stroke as well as increased mortality rates in the days shortly after major smoke episodes among vulnerable populations (Haikerwal et al., 2015a; Wettstein et al., 2018).
However, thus far it is unclear how wildfires and associated smoke exposure is distributed across the U.S., a large and diverse country. Most previous studies find that areas of high wildfire risk tend to be socioeconomically advantaged (Davies et al., 2018; Wigtil et al., 2016). However, in the Southeastern U.S., communities vulnerable due to sociodemographic and pre-existing health conditions have been more likely to experience wildfire smoke exposure (Rappold et al., 2017). Communities that are vulnerable due to cardiopulmonary illness, inflammatory disease, and low socioeconomic status are disproportionately impacted by exposure in general to fine particulate matter (PM), and these impacts may also hold for PM from wildfire smoke (Rappold et al., 2017). However, epidemiological evidence is inconclusive about disproportionate health impacts of wildland fire smoke on vulnerable groups (Kondo et al., 2019).
In the U.S., national wildfire policy seeks to promote living with fire, balancing ecologically functional levels of fire while also protecting human health, life, and property (National Science and Analysis Team et al., 2014). The National Cohesive Wildland Fire Management Strategy (2014) recognizes prescribed burning as one of the three primary means of managing fuels, along with managing wildfires for ecological purposes once ignited and the application of non-fire treatments (e.g., mechanical thinning of fuels). Prescribed burning can restore and maintain fire-dependent ecosystems and is considered a valuable silvicultural treatment tool (National Science and Analysis Team et al., 2014). It can also reduce available fuels (e.g., brush and understory), thereby reducing the occurrence, area and severity of uncontrolled wildfires. In general, smoke plumes from prescribed burns are of a shorter duration and impact smaller areas than smoke from wildfires (Navarro et al., 2018), and may reduce overall smoke exposure (Afrin and Garcia-Menendez, 2020; Jaffe et al., 2020).
Smoke-related PM concentrations during wildfire and prescribed fire events have not been adequately compared because monitoring is not conducted using comparable methods (Navarro et al., 2018) and over the long-term. However, some evidence points to greater health impacts from wildfire smoke exposure compared to prescribed fire smoke exposure. One study of children in California exposed either to smoke from a prescribed fire or wildfire (of equal distance and burned area), or no fires over a two-year period found that air pollution concentrations were on average higher for the group exposed to wildfire smoke, and measured immune responses (methylation levels) were greater in the wildfire compared to the prescribed fire exposure group (Prunicki et al., 2019). In addition, health outcomes including wheezing episodes, asthma exacerbations and blood pressure were worse in the wildfire compared to prescribed fire exposure group (Prunicki et al., 2019).
Prescribed burning is conducted by private and public land owners using a variety of techniques often depending on understory and vegetation characteristics. Prescribed burning on public land in the U.S. is carried out within Federal, State, and local jurisdictions. Most of the prescribed burning conducted on Federal land is carried out by the Forest Service (National Interagency Fire Center, 2021). In 2019, more than 3000 prescribed fires were conducted within National Forest System (NFS) lands, resulting in a burned area of more than 1.2 million acres (National Interagency Fire Center, 2021; USDA Forest Service, 2020). The level of prescribed burning at state and local levels is higher; State forestry agencies reported more than 10 million acres were treated with prescribed burns in 2019 (Melvin, 2020). In the U.S., there was an upward trend in the number of forested and rangeland acres treated with prescribed fire from 2011 to 2019 (Melvin, 2020).
Prescribed burning practices in the U.S. vary by region, in part due to political and socio-demographic factors (Haines et al., 2001; Schultz et al., 2019a; Wonkka et al., 2015). Within the southeastern region of the U.S. extending westward from the Atlantic seaboard to Texas, prescribed burning has historically been accepted as a valuable land management tool and continues to be a common practice (National Science and Analysis Team et al., 2014). More prescribed burning occurs in the southeastern U.S. than in any other region. The National Association of State Foresters (NASF) and the Coalition of Prescribed Fire Councils (CPFC) reported that more than 5.9 million acres were burned in 2019 via prescribed fires in the southeastern region (Melvin, 2020). Prescribed burning in the northeastern region (as defined by Melvin (2020) and corresponding to the eastern region of the NFS) is much more sporadic, with burning most common in scattered counties within the states of Minnesota, Wisconsin, Michigan, Pennsylvania, and New Jersey (National Science and Analysis Team et al., 2014). The NASF and CPFC reported about 365,000 acres were treated with prescribed fires in 2019 within this region (Melvin, 2020). Over the western region (as defined by Melvin (2020) and corresponding to regions 1–6 of the NFS) extending from the central Great Plains westward to the Pacific, the counties where substantial prescribed burning occurs are also fairly scattered (National Science and Analysis Team et al., 2014). The NASF/CPFC-reported prescribed-burn area was about 3.7 million acres in 2019 within this region (Melvin, 2020). In California, the number of legislative bills introduced to promote prescribed burns has been steadily increasing, especially during or right after major wildfires (Miller et al., 2020).
Exposure to prescribed burns may represent a net benefit when considering socio-demographic and health impacts of wildfire. Yet, understanding of the geographic extent and potential benefits or risks of prescribed burns on populations remains limited. It is therefore difficult to assess which populations are exposed to prescribed burns, and whether potential socio-demographic and health-related costs and benefits of prescribed burning are evenly distributed. To date, there have been no national analyses of the geographic distribution of prescribed burn practices and how they overlap spatially with vulnerable populations. When considering fuel treatments more broadly (mechanical treatments along with prescribed fire), Adams and Charnley (2018, 2020) found no relationship between fuel treatment allocation and minority populations or renter-occupied housing in study areas in the western U.S., whereas Anderson et al. (2020) found more affluent and educated communities (as measured by percent above the poverty line and percent with a college education) are more likely to receive fuel treatments after a wildfire in the western U.S. In contrast, Afrin and Garcia-Menendez (2021) found that prescribed burning occurred in areas with high social vulnerability in the state of Georgia. A recent study also found that prescribed-burn smoke exposure in 2018 was positively associated with percent African American and mobile home housing at the Census tract level in Georgia (Johnson Gaither et al., 2019).
In this study, we examine socio-demographic and health characteristics of counties, and associations between exposure and health outcomes, in and near a set of lands across the U.S. for which consistent prescribed burn records exist – U.S. National Forests. The National Forests are the largest federal land holdings distributed across the U.S., and this dataset allowed us to examine regional variation in prescribed fire use and resultant population exposure. In particular, we compare the characteristics of areas that were exposed to prescribed burns with those that were not exposed to prescribed burns during the years 2010–2019.
2. Data and methods
2.1. Data
2.1.1. Prescribed burns in National Forest System lands
The U.S. Forest Service (USFS) manages all National Forest System lands. We obtained the most up-to-date NFS Administrative Forest Area boundary file of these lands from 2015 (USDA Forest Service, 2015). This dataset includes National Forests, National Grasslands, Research and Experimental Areas, Purchase Units, or Land Utilization Projects administered not only by the USFS, but also by other government agencies and private landowners.
We obtained locations of prescribed burns occurring on NFS lands between 2010 and 2019 from the Forest Activity Tracking System (FACTS). The USFS uses FACTS to manage information about activities related to fire/fuels and other programs throughout the National Forest System. Specifically, the Hazardous Fuel Treatments is a polygon dataset (shown in Fig. 1) representing areas of hazardous fuels reduction treatments. These treatments have been defined as a “Vegetative manipulation designed to create and maintain resilient and sustainable landscapes, including burning, mechanical treatments, and/or other methods that reduce the quantity or change the arrangement of living or dead fuel so that the intensity, severity, or effects of wildland fire are reduced within acceptable ecological parameters and consistent with land management plan objectives, or activities that maintain desired fuel conditions.” (USDA Forest Service, 2020).
Fig. 1.

Prescribed burns (orange) in NFS land (gray) between 2010 and 2019 (source: USFS fuel treatment data).
While there are nine USFS regions, for the purpose of our study we have combined regions west of the eastern and southern regions. The study regions, and states included, are shown in Fig. 1. Our northeastern study region is the same as the northeastern region of the USFS and our southern study region is the same as the southern region of the USFS. The western study region is a combination of six sub-regions of the USFS. We stratified our statistical tests by region because of potential regional differences in housing density and development patterns, demographics, and use of prescribed burning.
While prescribed burns can impact regional air quality, the highest exposures are frequently felt in the immediate vicinity of fires. Smoke exposure could be precisely estimated using smoke dispersion modeling from each prescribed burn; however to model this dispersion for each prescribed burn was beyond the scope of this study. Moreover, at the time of this study, the county was the smallest geographic unit for which appropriate health prevalence data were available across the U.S.
As a first-order estimate of the local spatial extent of the potential exposure of populations to smoke plumes from each prescribed fire, we assigned an exposure indicator to counties based on whether they were within/outside 10 km of each prescribed burn location. The 10 km distance is consistent with previous analyses of local smoke dispersion from low-intensity prescribed fires conducted in New Jersey (Charney et al., 2019; Haikerwal et al., 2015b; Heilman et al., 2013).
We generated two measures of exposure for counties, each representing a different and independent aspect of exposure. The first measure of exposure (Exposure 1) was a count of prescribed burns (based on the 10 km radial buffer around each burn area) within a given county. We built a second measure of exposure (Exposure 2) that represented the percent of each county’s population exposed to one or more burns. We determined the percent of the population exposed using the smallest Census unit and corresponding data available at the time of the study; 2010 population at the Census block-level. We summed the population from Census blocks that intersected any prescribed burn exposure area (within 10 km of NFS prescribed burns), and divided this value by the county’s total population (from 2010 Decennial Census).
2.1.2. Sociodemographic data
We assessed county demographic characteristics that could be indicators of human vulnerability to natural hazards and disasters (Centers for Disease Control and Prevention, 2020; Flannigan et al., 2009). We used data from the 2018 5-year ACS (accessed 11/18/2020 from Census.gov). Demographic variables included: total population; percent of the population that was Native American, Hispanic, African American, or white; percent of individuals below the federal poverty line; median household income; percent of households receiving public assistance; percent of the population age 25 and over without a high school diploma, and percent of the civilian labor force unemployed. Housing variables included percent of housing units that were vacant, renter-occupied, or mobile homes, and percent of the population living in group quarters. In addition, we represented urban/rural status with rural-urban continuum codes, last assessed in 2013 by the Economic Research Service of the U.S. Department of Agriculture (Economic Research Service of the US Department of Agriculture, 2020). Urbanrural status contains 9 classes, ranging from 1 (urban – counties in metro areas of 1 million population or more) to 9 (non-metro –completely rural or less than 2500 urban population, not next to a metro area).
2.1.3. Health data
Health conditions that may be indicators of vulnerability to wildland fire smoke exposure include hypertension, asthma, chronic obstructive pulmonary disease (COPD), cardiovascular disease, and diabetes (Rappold et al., 2017). The Behavioral Risk Factor Surveillance System (BRFSS) provides state-level data about health-related risk behaviors, chronic health conditions, and use of preventive services based on telephone surveys with a representative sample of U.S. residents. We obtained 2018 small-area (county level) model-based age-adjusted estimates of prevalence of primary health outcomes that could be associated with exposure to smoke from the Centers for Disease Control and Prevention. These estimates include prevalence of current asthma, high blood pressure, coronary heart disease (CHD), COPD, diagnosed diabetes, and stroke. All estimates represent prevalence among adults aged ≥ 18 years. In addition, we gathered estimates of prevalence of health behaviors or healthcare access by county that could influence disease prevalence, including current smoking, low physical activity, current lack of health insurance, and prevalence of doctor visits for routine checkup within the past year, and older adult men and women aged ≥ 65 years who are up to date on a core set of clinical preventive services.
2.2. Statistical analyses
We assessed basic descriptive statistics of our exposures, demographic data, and health outcome prevalence and health behavior prevalence data, including frequencies and Pearson correlations. Correlations among demographic variables are shown in Table A.1 and among health outcome and behavior prevalences are shown in Table A.2.
Next, we used t-tests to assess differences in demographic and health outcome and behavior variables between exposure categories, defined as zero-exposure versus some-exposure for both Exposure 1 (burn count) and Exposure 2 (percent population exposed to one or more burns). We report statistics based on comparisons within nation-wide and regional geographies.
Finally, we estimated regression models using significance criteria of p < 0.05 to test for associations between each prescribed burn exposure (i.e., Exposure 1 and Exposure 2) and health outcomes while controlling for demographic and health behavior variables. We first tested for spatial autocorrelation in the residuals of an OLS model using Moran’s I, and found significant spatial autocorrelation (Moran’s I = 0.47, p = 0.000), indicating lack of independence of observations. We then used spatial error (SE) models to address this issue. SE models use clustering of the error terms to account for outcome variable clustering that is not explained by independent variables (Anselin et al., 2010). We chose the optimum weights matrix (2nd-order Queen’s contiguity) using model diagnostics the Breusch-Pagan test for non-constant variance in the errors (heteroskedasticity) and model fit statistics including R2 and Akaike Info Criterion (AIC). Among covariates, we found strong correlation between the two education variables (no high school diploma and no bachelor’s degree) (r = 0.63), between percent poverty and percent unemployed (r = 0.69), percent poverty and percent receiving public assistance (r = 0.85), and percent poverty and median household income (r = −0.78). To address the problem of multicollinearity, we excluded one from each pair from our regression analyses. Due to strong correlation between current smoking and low physical activity (r = 0.89), we excluded low physical activity from regression analyses. Our final SE models tested the association between each health outcome and exposure, while controlling for total population, percent poverty, percent with no high school diploma, percent mobile homes, urban/rural status, percent uninsured, prevalence of preventative care among older adults (men and women), and current smoking, as well as spatial autocorrelation in the residuals. For the SE models, we classified exposure variables (Exposure 1 and Exposure 2) as zero values (0) and above zero values (1) and interpreted the corresponding estimate. We estimated models for all counties and stratified by region. We performed all statistical analyses using Stata v15 (College Station, TX) and GeoDa v1.18.
3. Results
In our analysis, there were 22,734 fuel treatments included in the database (after removal of duplicates) across 111 administrative forest units, shown in Fig. 1. Most (>96%) fuel treatments were broadcast burns (prescribed burning of entire areas). The burns ranged in size from less than one acre to 205,000 acres. One thousand eighty-nine counties were located within 10 km of NFS lands and thus comprise our dataset.
Descriptive statistics of Exposure 1 and Exposure 2 variables are shown in Table 1. Counts of counties within exposure categories, defined using zero-value, for the U.S. and by region, are shown in Table 2. Maps of Exposure 1 and 2 variables are shown in Figs. 2 and 3.
Table 1.
Descriptive statistics of exposure variables for counties within 10 km of National Forest System (NFS) land.
| Variable | N | Mean | Median | 75th percentile | 90th percentile | Std. Dev. | Min | Max | |
|---|---|---|---|---|---|---|---|---|---|
|
| |||||||||
| Exposure 1 | Count of burn buffers in county | 1089 | 41.0 | 11.0 | 45.0 | 114.0 | 82.4 | 0.0 | 859.0 |
| Exposure 2 | Proportion of total county population exposed to 1+ burns | 1089 | 0.2 | 0.0 | 0.2 | 0.6 | 0.3 | 0.0 | 1.0 |
Table 2.
Counts of counties in categories based on Exposure 1 and Exposure 2 by region.a
| Exposure 1 |
Exposure 2 |
|||
|---|---|---|---|---|
| No exposure | Some exposure | Zero proportion | Some proportion | |
|
| ||||
| All counties | 280 | 809 | 322 | 767 |
| South | 94 | 439 | 111 | 422 |
| Northeast | 41 | 76 | 44 | 73 |
| West | 114 | 294 | 136 | 272 |
Exposure 1: Count of prescribed burn buffers in the county; Exposure 2: Proportion of total county population exposed to 1+ burns.
Fig. 2.

Count of prescribed burns within 10 km of NFS lands (Exposure 1) by county.
Fig. 3.

Percent of the population exposed to one or more prescribed burns within 10 km of NFS lands (Exposure 2).
Exposure 1, or count of 10 km buffer areas surrounding burns in the county, values ranged from zero to 859, with an average of 41. The majority of counties within 10 km of NFS lands (809) contained one or more burn buffers while 280 contained zero burn buffers.
Exposure 2, or percent of the total county population exposed to one or more burns, values ranged from 0 to 100%, with an average of 20%. The majority of counties (767) had some population exposure whereas 322 counties had no population exposure.
3.1. Demographic comparisons in exposed versus unexposed counties
Considering all U.S. counties, compared to counties within 10 km of NFS lands that were not exposed to any prescribed burns (n = 280), counties within 10 km of NFS lands that were exposed to any prescribed burns using Exposure 1 (n = 808) were more rural and had a higher percentage of the population that was African-American, and (non-Hispanic) white, and a higher percentage of mobile home and vacant housing units. They also had a lower percentage of the population that was Hispanic, below the poverty threshold, receiving public assistance, unemployed, and a lower percentage of renter-occupied units (Table 3). However, these statistically-significant associations were not consistent across regions. In the southern region, compared to counties within 10 km of NFS lands that were not exposed to any prescribed burns (n = 94), counties within 10 km of NFS lands that were exposed to prescribed burns (n = 439) had a higher percentage of Hispanic population, and of mobile home housing. They also had a lower percentage of the population that was non-Hispanic white, receiving public assistance, and a lower percentage of renter-occupied housing units. In the western region, counties within 10 km of NFS lands that were exposed to prescribed burns (n = 294) had a higher percentage of the population below poverty, a higher percentage of vacant housing units, lower median household income, and a lower percentage renter-occupied units compared to counties within 10 km of NFS lands that were not exposed to any prescribed burns (n = 114). There were no statistically significant differences between exposed (n = 76) and unexposed (n = 41) counties in the northern region, possibly because there were few counties within 10 km of NFS lands.
Table 3.
Demographic characteristics of zero versus some burn buffer counties (Exposure 1) and tests of difference for the U.S. as a whole and the southern, northeastern and western regions of analysis.a,b
| All counties |
South |
Northeast |
West |
|||||||||||||
|---|---|---|---|---|---|---|---|---|---|---|---|---|---|---|---|---|
| No exposure |
Some exposure |
No exposure |
Some exposure |
No exposure |
Some exposure |
No exposure |
Some exposure |
|||||||||
| Mean | Mean | SE | p | Mean | Mean | SE | p | Mean | Mean | SE | p | Mean | Mean | SE | p | |
|
| ||||||||||||||||
| n | 280 | 808 | 94 | 439 | 41 | 76 | 114 | 294 | ||||||||
| Total population | 87,675 | 88,648 | 27,620 | 0.97 | 64,046 | 50,590 | 10,685 | 0.21 | 81,650 | 51,966 | 19,592 | 0.13 | 121,000 | 155,000 | 70,189 | 0.63 |
| 2010 population in 2018 county boundary | 82,639 | 84,767 | 26,277 | 0.94 | 59,847 | 48,865 | 9462 | 0.25 | 80,658 | 51,702 | 19,021 | 0.13 | 112,000 | 147,000 | 66,911 | 0.60 |
| Age < 18, % | 21.7 | 21.8 | 0.3 | 0.80 | 21.2 | 21.5 | 0.3 | 0.24 | 20.1 | 19.4 | 0.6 | 0.29 | 22.9 | 22.7 | 0.5 | 0.71 |
| Age 65 and up, % | 18.5 | 19.1 | 0.3 | 0.08 | 18.4 | 18.7 | 0.4 | 0.52 | 20.5 | 21.3 | 0.9 | 0.39 | 18.0 | 19.1 | 0.6 | 0.09 |
| African American, % | 4.4 | 8.5 | 1.0 | 0.00 | 10.6 | 14.5 | 2.0 | 0.05 | 2.4 | 2.5 | 0.8 | 0.88 | 1.2 | 0.9 | 0.2 | 0.09 |
| American Indian, % | 2.4 | 2.6 | 0.6 | 0.72 | 0.4 | 0.9 | 0.3 | 0.21 | 1.4 | 3.4 | 1.6 | 0.23 | 5.0 | 5.0 | 1.4 | 0.99 |
| Hispanic, % | 18.2 | 8.9 | 1.3 | 0.00 | 3.6 | 4.7 | 0.6 | 0.04 | 2.9 | 3.1 | 0.6 | 0.81 | 13.8 | 16.5 | 1.8 | 0.14 |
| White (non-Hispanic), % | 71.5 | 77.1 | 1.6 | 0.00 | 82.9 | 77.3 | 2.0 | 0.01 | 90.3 | 87.9 | 2.1 | 0.26 | 74.7 | 73.9 | 2.2 | 0.73 |
| Median household income | 47,519 | 47,700 | 906 | 0.84 | 42,590 | 43,554 | 1076 | 0.37 | 52,142 | 51,284 | 1819 | 0.64 | 57,314 | 52,983 | 1486 | 0.00 |
| Poverty, % | 19.2 | 17.2 | 0.6 | 0.00 | 20.1 | 19.2 | 0.7 | 0.21 | 13.2 | 13.9 | 0.8 | 0.39 | 13.4 | 15.2 | 0.7 | 0.01 |
| Households w/ public assistance, % | 18.1 | 14.8 | 0.6 | 0.00 | 18.5 | 16.8 | 0.7 | 0.02 | 13.5 | 13.8 | 0.8 | 0.69 | 12.5 | 12.0 | 0.8 | 0.56 |
| Unemployment, % | 7.2 | 6.4 | 0.2 | 0.00 | 7.0 | 6.9 | 0.3 | 0.78 | 5.5 | 5.8 | 0.4 | 0.50 | 5.3 | 5.8 | 0.4 | 0.20 |
| No high school diploma, % | 14.0 | 14.0 | 0.4 | 0.99 | 16.9 | 16.9 | 0.6 | 0.92 | 9.0 | 9.2 | 0.6 | 0.68 | 10.5 | 11.0 | 0.7 | 0.45 |
| Renter occupied units, % | 29.3 | 28.2 | 0.5 | 0.04 | 29.7 | 27.9 | 0.9 | 0.04 | 23.5 | 23.9 | 1.3 | 0.75 | 31.7 | 29.8 | 0.9 | 0.04 |
| Vacant housing units, % | 21.0 | 22.9 | 0.9 | 0.03 | 18.8 | 20.3 | 1.0 | 0.13 | 27.6 | 32.3 | 3.1 | 0.13 | 20.0 | 24.3 | 1.6 | 0.01 |
| Mobile home housing units, % | 12.1 | 16.7 | 0.6 | 0.00 | 16.6 | 20.1 | 1.0 | 0.00 | 7.9 | 9.0 | 0.9 | 0.20 | 13.0 | 13.8 | 0.9 | 0.43 |
| Group quarters pop, % | 3.3 | 3.5 | 0.3 | 0.56 | 4.7 | 3.9 | 0.6 | 0.16 | 2.8 | 4.2 | 1.1 | 0.19 | 3.2 | 2.8 | 0.4 | 0.43 |
| Urban vs rural | 5.1 | 5.4 | 0.2 | 0.04 | 5.3 | 5.1 | 0.3 | 0.42 | 5.4 | 6.1 | 0.5 | 0.10 | 5.7 | 5.7 | 0.3 | 0.94 |
p < 0.05 are in bold.
Standard error (SE); p-value (p).
Exposure 1: Count of prescribed burn buffers in the county.
Comparing all U.S. counties within 10 km of NFS lands with zero exposure to prescribed burns (Exposure 2) to counties within 10 km of NFS lands with some county population exposed to prescribed burns, we found the same demographic differences as we observed for Exposure 1, except that difference in urban/rural status was not statistically significant (Table 4). In the southern region, there were no significant differences in racial or ethnic composition between Exposure 2 categories. In the western region, differences were largely the same as in Exposure 1 except that there was no difference in percentage of vacant housing units. Again, in the northern region there were no statistically significant differences.
Table 4.
Demographic characteristics of zero versus some proportion population counties (Exposure 2) and tests of differencea for the U.S. as a whole and the southern, northeastern and western regions of analysis.a,b
| All counties |
South |
Northeast |
West |
|||||||||||||
|---|---|---|---|---|---|---|---|---|---|---|---|---|---|---|---|---|
| Zero proportion |
Some proportion |
Zero proportion |
Some proportion |
Zero proportion |
Some proportion |
Zero proportion |
Some proportion |
|||||||||
| Mean | Mean | SE | p | Mean | Mean | SE | p | Mean | Mean | SE | p | Mean | Mean | SE | p | |
|
| ||||||||||||||||
| n | 322 | 767 | 111 | 422 | 41 | 75 | 136 | 272 | ||||||||
| Total population | 81,844 | 91,149 | 26,450 | 0.73 | 62,858 | 50,361 | 10,029 | 0.21 | 77,394 | 53,312 | 19,358 | 0.22 | 108,000 | 165,000 | 66,769 | 0.40 |
| 2010 population in 2018 county boundary | 77,216 | 87,160 | 25,164 | 0.69 | 58,956 | 48,656 | 8881 | 0.25 | 76,494 | 53,022 | 18,795 | 0.21 | 99,341 | 156,000 | 63,649 | 0.37 |
| Age < 18, % | 21.8 | 21.7 | 0.3 | 0.67 | 21.4 | 21.5 | 0.3 | 0.71 | 20.4 | 19.2 | 0.6 | 0.06 | 22.8 | 22.7 | 0.5 | 0.84 |
| Age 65 and up, % | 18.5 | 19.1 | 0.3 | 0.06 | 18.3 | 18.7 | 0.4 | 0.31 | 20.4 | 21.4 | 0.9 | 0.25 | 18.2 | 19.1 | 0.6 | 0.14 |
| African American, % | 5.0 | 8.4 | 0.9 | 0.00 | 12.2 | 14.3 | 1.9 | 0.27 | 2.3 | 2.6 | 0.8 | 0.69 | 1.1 | 0.9 | 0.1 | 0.18 |
| American Indian, % | 2.9 | 2.4 | 0.6 | 0.36 | 0.5 | 0.9 | 0.3 | 0.32 | 3.5 | 2.2 | 1.6 | 0.41 | 5.4 | 4.9 | 1.3 | 0.71 |
| Hispanic, % | 17.2 | 8.8 | 1.3 | 0.00 | 3.7 | 4.7 | 0.5 | 0.07 | 2.9 | 3.1 | 0.6 | 0.80 | 14.1 | 16.6 | 1.7 | 0.14 |
| White (non-Hispanic), % | 71.6 | 77.3 | 1.5 | 0.00 | 81.0 | 77.6 | 1.9 | 0.07 | 88.4 | 89.0 | 2.1 | 0.77 | 74.6 | 73.9 | 2.1 | 0.76 |
| Median household income | 47,569 | 47,689 | 868 | 0.89 | 42,855 | 43,523 | 1010 | 0.51 | 51,655 | 51,543 | 1793 | 0.95 | 56,303 | 53,139 | 1421 | 0.03 |
| Poverty, % | 18.9 | 17.2 | 0.5 | 0.00 | 19.9 | 19.2 | 0.7 | 0.29 | 13.7 | 13.6 | 0.8 | 0.86 | 13.8 | 15.1 | 0.7 | 0.04 |
| Households w/ public assistance, % | 17.6 | 14.8 | 0.5 | 0.00 | 18.4 | 16.8 | 0.7 | 0.02 | 14.0 | 13.5 | 0.8 | 0.54 | 12.4 | 12.0 | 0.7 | 0.64 |
| Unemployment, % | 7.0 | 6.4 | 0.2 | 0.01 | 6.9 | 6.9 | 0.3 | 0.97 | 5.5 | 5.8 | 0.4 | 0.50 | 5.4 | 5.8 | 0.3 | 0.28 |
| No high school diploma, % | 14.0 | 14.0 | 0.4 | 0.98 | 16.9 | 16.9 | 0.6 | 0.98 | 9.1 | 9.2 | 0.5 | 0.84 | 10.8 | 10.9 | 0.6 | 0.99 |
| Renter occupied units, % | 29.4 | 28.1 | 0.5 | 0.01 | 29.8 | 27.8 | 0.8 | 0.02 | 23.8 | 23.8 | 1.2 | 1.00 | 31.4 | 29.8 | 0.8 | 0.04 |
| Vacant housing units, % | 21.6 | 22.8 | 0.8 | 0.18 | 18.7 | 20.4 | 0.9 | 0.06 | 28.3 | 32.1 | 3.1 | 0.22 | 21.6 | 23.9 | 1.6 | 0.15 |
| Mobile home housing units, % | 12.5 | 16.8 | 0.6 | 0.00 | 16.8 | 20.2 | 1.0 | 0.00 | 7.9 | 9.0 | 0.9 | 0.23 | 13.2 | 13.7 | 0.9 | 0.53 |
| Group quarters pop, % | 3.3 | 3.6 | 0.3 | 0.41 | 4.5 | 3.9 | 0.5 | 0.27 | 2.7 | 4.3 | 1.1 | 0.14 | 3.1 | 2.8 | 0.4 | 0.46 |
| Urban vs rural | 5.2 | 5.4 | 0.2 | 0.19 | 5.3 | 5.1 | 0.3 | 0.51 | 5.6 | 6.1 | 0.5 | 0.27 | 5.8 | 5.7 | 0.3 | 0.68 |
Standard error (SE); p-value (p).
Exposure 2: Proportion of total county population exposed to 1+ burns.
3.2. Descriptive health comparisons in exposed versus unexposed counties
Differences in healthcare access, health behaviors and health outcomes between exposure categories country-wide were almost entirely driven by differences in the western region (see Tables 5 and 6). Nationwide, counties within 10 km of NFS lands that were exposed to prescribed burns (n = 808), compared to counties that were not exposed (n = 280), had a higher percentage of the population lacking health insurance, and diagnosed with high blood pressure, diabetes, and physical inactivity, but a higher percentage of the population that had received an annual check-up, and lower percentage that had participated in core preventive services (women only). These differences were similar in the western region, with additionally significant lower prevalence of core preventative services for men, and significantly higher prevalence of asthma, CHD, COPD, and smoking in exposed counties compared to unexposed counties. Differences in percentage of the population lacking of health insurance, core preventive services (for women) and reporting high blood pressure were non-significant in the western region. In the southern region, counties within 10 km of NFS lands with exposure had significantly higher levels of the population lacking health services and lower prevalence of core preventative services for women than counties with in 10 km of NFS lands with no exposure.
Table 5.
Comparison of health outcomes in zero versus some exposure counties (Exposure 1), and tests of differencea for the U.S. as a whole and the southern, northeastern and western regions of analysis.a,b
| All Counties |
South |
Northeast |
West |
|||||||||||||
|---|---|---|---|---|---|---|---|---|---|---|---|---|---|---|---|---|
| No exposure |
Some exposure |
No exposure |
Some exposure |
No exposure |
Some exposure |
No exposure |
Some exposure |
|||||||||
| Mean | Mean | SE | p | Mean | Mean | SE | p | Mean | Mean | SE | p | Mean | Mean | SE | p | |
|
| ||||||||||||||||
| Lack of health insurance | 21.9 | 23.9 | 0.7 | 0.00 | 22.4 | 24.7 | 1.0 | 0.03 | 14.4 | 14.9 | 1.5 | 0.76 | 24.2 | 25.0 | 0.9 | 0.36 |
| Annual checkup | 75.6 | 76.4 | 0.3 | 0.00 | 77.6 | 77.4 | 0.3 | 0.61 | 75.7 | 75.5 | 0.6 | 0.78 | 73.9 | 75.2 | 0.6 | 0.02 |
| Core preventive services for older men | 26.8 | 26.4 | 0.4 | 0.25 | 22.7 | 22.3 | 0.6 | 0.04 | 22.1 | 21.7 | 1.0 | 0.36 | 20.3 | 18.2 | 0.6 | 0.78 |
| Core preventive services for older women | 21.5 | 20.8 | 0.3 | 0.01 | 27.7 | 26.4 | 0.4 | 0.29 | 25.2 | 24.2 | 0.6 | 0.49 | 26.7 | 26.9 | 0.4 | 0.00 |
| High blood pressure | 52.0 | 55.4 | 1.6 | 0.03 | 53.2 | 54.6 | 2.4 | 0.57 | 36.2 | 37.3 | 3.5 | 0.75 | 56.7 | 61.3 | 2.4 | 0.06 |
| Current asthma | 42.4 | 46.9 | 2.6 | 0.08 | 38.4 | 41.4 | 4.1 | 0.46 | 21.1 | 23.0 | 5.3 | 0.72 | 53.3 | 61.3 | 3.8 | 0.03 |
| Coronary heart disease | 36.6 | 41.3 | 2.4 | 0.06 | 34.9 | 38.1 | 4.0 | 0.43 | 16.9 | 17.9 | 5.0 | 0.86 | 45.1 | 52.0 | 3.4 | 0.04 |
| COPDc | 18.3 | 19.5 | 0.8 | 0.14 | 19.2 | 18.6 | 1.2 | 0.65 | 11.4 | 12.4 | 1.9 | 0.61 | 20.1 | 22.7 | 1.2 | 0.04 |
| Diabetes | 22.4 | 24.9 | 1.0 | 0.01 | 23.3 | 24.7 | 1.5 | 0.35 | 14.4 | 16.7 | 2.3 | 0.34 | 24.6 | 27.4 | 1.3 | 0.04 |
| Current smoking | 39.7 | 42.1 | 1.4 | 0.10 | 38.6 | 38.5 | 1.9 | 0.98 | 29.7 | 34.0 | 3.8 | 0.26 | 44.3 | 49.5 | 2.4 | 0.03 |
| Physical inactivity | 45.8 | 49.2 | 1.6 | 0.03 | 47.9 | 48.7 | 2.3 | 0.71 | 33.9 | 36.3 | 4.1 | 0.56 | 48.5 | 53.3 | 2.4 | 0.04 |
| Stroke | 10.2 | 10.8 | 0.6 | 0.28 | 10.8 | 11.4 | 1.0 | 0.57 | 5.5 | 5.4 | 1.0 | 0.89 | 11.3 | 11.2 | 0.8 | 0.94 |
Standard error (SE); p-value (p).
Exposure 1: Count of prescribed burn buffers in the county.
Chronic obstructive pulmonary disease (COPD).
Table 6.
Comparison of health outcomes in zero versus some proportion population counties (Exposure 2), and tests of differencea for the U.S. as a whole and the southern, northeastern and western regions of analysis.a,b
| All counties |
South |
Northeast |
West |
|||||||||||||
|---|---|---|---|---|---|---|---|---|---|---|---|---|---|---|---|---|
| Zero proportion |
Some proportion |
Zero proportion |
Some proportion |
Zero proportion |
Some proportion |
Zero proportion |
Some proportion |
|||||||||
| Mean | Mean | SE | p | Mean | Mean | SE | p | Mean | Mean | SE | p | Mean | Mean | SE | p | |
|
| ||||||||||||||||
| Lack of health insurance | 22.1 | 23.9 | 0.6 | 0.00 | 22.6 | 24.7 | 1.0 | 0.03 | 14.8 | 14.6 | 1.5 | 0.90 | 24.2 | 25.1 | 0.9 | 0.28 |
| Annual checkup | 75.6 | 76.5 | 0.3 | 0.00 | 77.5 | 77.4 | 0.3 | 0.89 | 75.7 | 75.5 | 0.6 | 0.67 | 74.0 | 75.3 | 0.6 | 0.02 |
| Core preventive services for older men | 26.6 | 26.4 | 0.4 | 0.62 | 22.6 | 22.4 | 0.6 | 0.19 | 21.9 | 21.8 | 1.0 | 0.43 | 20.2 | 18.1 | 0.6 | 0.54 |
| Core preventive services for older women | 21.4 | 20.8 | 0.3 | 0.04 | 27.3 | 26.5 | 0.4 | 0.58 | 25.1 | 24.3 | 0.6 | 0.80 | 26.6 | 27.0 | 0.4 | 0.00 |
| High blood pressure | 52.2 | 55.5 | 1.5 | 0.03 | 52.4 | 54.8 | 2.3 | 0.28 | 37.1 | 36.8 | 3.4 | 0.94 | 57.0 | 61.5 | 2.3 | 0.05 |
| Current asthma | 42.4 | 47.2 | 2.5 | 0.06 | 36.7 | 41.9 | 3.8 | 0.17 | 22.1 | 22.5 | 5.2 | 0.93 | 53.6 | 61.8 | 3.6 | 0.02 |
| Coronary heart disease | 36.7 | 41.5 | 2.3 | 0.04 | 33.3 | 38.6 | 3.7 | 0.15 | 18.0 | 17.3 | 5.0 | 0.89 | 45.5 | 52.3 | 3.2 | 0.03 |
| COPDc | 18.3 | 19.6 | 0.8 | 0.09 | 18.5 | 18.8 | 1.2 | 0.82 | 11.8 | 12.2 | 1.9 | 0.81 | 20.3 | 22.9 | 1.2 | 0.03 |
| Diabetes | 22.3 | 25.1 | 0.9 | 0.00 | 22.6 | 24.9 | 1.4 | 0.11 | 14.8 | 16.5 | 2.3 | 0.48 | 24.5 | 27.7 | 1.3 | 0.01 |
| Current smoking | 39.4 | 42.3 | 1.4 | 0.04 | 37.5 | 38.8 | 1.8 | 0.45 | 30.4 | 33.8 | 3.8 | 0.37 | 44.0 | 50.1 | 2.3 | 0.01 |
| Physical inactivity | 45.5 | 49.6 | 1.5 | 0.01 | 46.8 | 49.0 | 2.2 | 0.30 | 34.5 | 36.0 | 4.1 | 0.70 | 48.0 | 54.0 | 2.3 | 0.01 |
| Stroke | 10.1 | 10.9 | 0.6 | 0.15 | 10.3 | 11.6 | 0.9 | 0.19 | 5.8 | 5.2 | 1.0 | 0.58 | 11.2 | 11.2 | 0.8 | 0.98 |
Standard error (SE); p-value (p).
Exposure 2: Proportion of total county population exposed to 1+ burns.
Chronic obstructive pulmonary disease (COPD).
In summary, considering all counties, there were mixed findings regarding access to insurance and healthcare. However, in the southern region, comparisons suggest higher lack of health insurance and lower participation in core preventive services in exposed compared to unexposed counties. Regarding health conditions, there was a higher prevalence of some health conditions in the exposed counties, especially in the western region. There were no statistically significant differences between exposed (n = 76) and unexposed (n = 41) counties in the northern region.
These differences are largely mirrored for Exposure 2 categories (Table 6), with a few differences. Considering all counties, difference in percentage of the population with coronary heart disease and smokers became significant (higher in exposed counties). Again, there were no statistically significant differences between exposed (n = 75) and unexposed (n = 41) counties in the northern region.
3.3. Regression-based health comparisons in exposed versus unexposed counties
While we found health outcomes with statistically significant differences between exposed and unexposed counties, no health outcomes showed statistically significant association with exposure in adjusted spatial regression analyses. As shown in Tables 7 and 8, neither any exposure to prescribed burns within the county nor share of the population exposed to 1+ burns were associated with the health conditions of concern, controlling for differences in demographic factors, in urban/rural status, access to health insurance, rate of preventative care, smoking, and for spatial autocorrelation in each outcome variable. The models had a very significant lambda which is the autoregressive coefficient for the errors, however, we still observed some residual spatial autocorrelation. The spatial error model performed better (when comparing Akaike information criterion values; shown in Table 9) than an OLS regression model.
Table 7.
| All counties |
South |
North |
West |
|||||||||
|---|---|---|---|---|---|---|---|---|---|---|---|---|
| Coef | SEc | p | Coef | SE | p | Coef | SE | p | Coef | SE | p | |
|
| ||||||||||||
| Asthma | 1.07 | 1.41 | 0.45 | 2.20 | 2.18 | 0.31 | 3.67 | 3.16 | 0.25 | −0.06 | 1.93 | 0.98 |
| CHDc | 1.10 | 1.26 | 0.38 | 2.95 | 2.01 | 0.14 | 2.05 | 2.68 | 0.44 | −0.61 | 1.65 | 0.71 |
| COPDc | −0.34 | 0.40 | 0.39 | −0.24 | 0.60 | 0.69 | 0.07 | 0.62 | 0.91 | −0.56 | 0.61 | 0.35 |
| Diabetes | 0.37 | 0.40 | 0.36 | 0.92 | 0.59 | 0.12 | −0.53 | 0.70 | 0.45 | 0.04 | 0.58 | 0.94 |
| High BPc | 0.36 | 0.96 | 0.70 | 1.10 | 1.42 | 0.44 | 1.77 | 2.02 | 0.38 | −0.38 | 1.40 | 0.79 |
| Stroke | −0.28 | 0.44 | 0.53 | 0.41 | 0.69 | 0.54 | −0.59 | 0.59 | 0.31 | −0.50 | 0.69 | 0.47 |
Adjusted for differences in demographic factors and in urban/rural status, access to health insurance, rate of preventative care, smoking, and spatial autocorrelation.
Exposure 1: Count of prescribed burn buffers in the county.
Coronary heart disease (CHD); chronic obstructive pulmonary disease (COPD); blood pressure (BP); standard error (SE); p-value (p).
Table 8.
| All counties |
South |
North |
West |
|||||||||
|---|---|---|---|---|---|---|---|---|---|---|---|---|
| Coef | SEc | p | Coef | SE | p | Coef | SE | p | Coef | SE | p | |
|
| ||||||||||||
| Asthma | 1.26 | 1.31 | 0.34 | 2.34 | 2.03 | 0.25 | 1.73 | 3.10 | 0.58 | 0.23 | 1.80 | 0.90 |
| CHDc | 1.11 | 1.18 | 0.35 | 3.07 | 1.86 | 0.10 | 0.53 | 2.63 | 0.84 | −0.42 | 1.53 | 0.78 |
| COPDc | −0.36 | 0.38 | 0.34 | −0.27 | 0.56 | 0.63 | −0.20 | 0.60 | 0.74 | −0.52 | 0.65 | 0.42 |
| Diabetes | 0.33 | 0.38 | 0.38 | 0.80 | 0.55 | 0.14 | −0.60 | 0.68 | 0.38 | 0.06 | 0.55 | 0.91 |
| High BPc | 0.35 | 0.90 | 0.70 | 0.88 | 1.33 | 0.51 | 0.38 | 1.99 | 0.85 | −0.14 | 1.30 | 0.91 |
| Stroke | −0.20 | 0.42 | 0.63 | 0.57 | 0.64 | 0.37 | −0.74 | 0.57 | 0.20 | −0.52 | 0.65 | 0.42 |
Adjusted for differences in demographic factors and in urban/rural status, access to health insurance, rate of preventative care, smoking, and spatial autocorrelation.
Exposure 2: Proportion of total county population exposed to 1+ burns.
Coronary heart disease (CHD); chronic obstructive pulmonary disease (COPD); blood pressure (BP); standard error (SE); p-value (p).
Table 9.
Comparison of Akaike Information Criterion (AIC) values between ordinary least squares (OLS) regression model and spatial error (SE) model for exposures 1 and 2, all counties.
| Exposure 1 |
Exposure 2 |
|||
|---|---|---|---|---|
| OLS model | SE model | OLS model | SE model | |
|
| ||||
| Asthma | 9501.88 | 9284.43 | 9455.15 | 9284.24 |
| CHDa | 8987.84 | 9063.93 | 9274.20 | 9063.89 |
| COPDa | 8987.84 | 6576.26 | 6654.81 | 6576.05 |
| Diabetes | 6406.86 | 6560.38 | 6622.76 | 6560.43 |
| High BPa | 8305.63 | 8448.54 | 8583.65 | 8448.55 |
| Stroke | 6505.66 | 6787.69 | 6858.13 | 6787.87 |
Coronary heart disease (CHD); chronic obstructive pulmonary disease (COPD); blood pressure (BP).
4. Discussion
Prescribed burning is a risk reduction strategy that can restore and maintain ecosystems, and ultimately reduce the occurrence, area and severity of uncontrolled wildfires. Whereas, other studies have shown clear long term racially-based environmental justice biases (e.g., Yi et al., 2019), our study is the first to assess potential inequalities in social or health-related effects of prescribed burning on a national level. We found some indicators that populations with sociodemographic or health vulnerabilities are more likely to be in close proximity to, and thereby exposed to prescribed burns conducted on National Forest System lands than less vulnerable populations. Differences seen on a national level were largely driven by differences in the southern and western regions. In the southern region, exposed counties had a lower percentage of the population that was non-Hispanic white, and a higher percentage of mobile home housing compared to non-exposed counties. These findings reflect what has been found in the state of Georgia; more socially-vulnerable populations are exposed to more prescribed burning and associated (estimated) air pollution (Afrin and Garcia-Menendez, 2021; Johnson Gaither et al., 2019). The authors suggested that the prescribed burning was not commenced by or within these communities, but instead by nearby wealthier private landowners. In the western region of our study, exposed counties had higher percentage of the population below poverty and greater percentage of vacant housing units, and lower median household income compared to non-exposed counties.
While there were some significant demographic differences between exposed and unexposed counties in unadjusted comparisons, we found no significant associations between exposure and prevalence of chronic diseases of concern, including asthma, coronary heart disease, COPD, diabetes, high blood pressure, and stroke, when controlling for sociodemographic characteristics, health behaviors, and healthcare access or preventative care that might affect disease prevalence. Although we see some sociodemographic vulnerabilities in exposed areas, we found no association between prescribed burning, as we have defined it, in and around NFS lands and potentially smoke-related ill health in any region of the U.S.
Our findings could be interpreted to indicate that health in lowerresource communities is not comprised by exposure to smoke from prescribed burning practices in National Forest System lands. At the same time, smoke exposure, whether from prescribed burning or wildfire, represents a health burden, and vulnerable populations are often not engaged in land management decisions and practices (Schelhas et al., 2016). Adams and Charnley’s (2020) study of prescribed burning practices in 12 forests found equitable distribution of costs and benefits based on demographic characteristics of exposed populations, but also found that socially vulnerable populations and underrepresented groups were rarely involved in wildfire hazard reduction decisions or in project planning which raises environmental justice concerns. In addition, greater concern about the side effects of prescribed burning exists among women and people of color (Lim et al., 2009).
Our study has a number of limitations. First, because there is no comprehensive event-level dataset of prescribed burning in the U.S., we used an administrative dataset representing a sub-set of prescribed burning. Our findings therefore only apply to exposure to prescribed burns on NFS lands in counties proximate to NFS lands. However, use of a national data set avoids the pitfalls of patching together prescribed fire records across states. The USFS is a national leader in fire policy, both directly managing federal lands, and shaping fire management and policy across federal and state agencies (Schultz et al., 2019b). Understanding the different components of exposure of affected populations to prescribed fire from USFS lands contributes valuable insight to calls for increasing use of prescribed fire.
In addition, local exposure to smoke from prescribed burning is dependent on local ambient and fire-induced atmospheric conditions at the time of burning and on the burning technique. These conditions, and smoke plume and pollutant concentrations, can be determined using coupled meteorological, fire, and smoke dispersion modeling systems capable of resolving local atmospheric dynamics and smokeplume structures (e.g. canopy version of the Advanced Regional Modeling System (ARPS-Canopy) coupled with the FLEXPART particle dispersion model (Charney et al., 2019; Kiefer et al., 2013; Kiefer et al., 2014; Stohl et al., 2005)), and the coupled wildland fire and chemistry versions of the Weather Research and Forecasting model (WRFSC) (Grell et al., 2005; Kochanski et al., 2016; Mandel et al., 2011; Shamarock et al., 2008). However, modeling individual plumes from the extensive suite of prescribed-fire events considered in this study and therefore precise local population smoke exposure was beyond the scope of this study. Therefore, we relied on the assumption of uniformly and evenly-distributed smoke exposure within 10 km of prescribed burning locations. This assumption could both assign exposure to populations unexposed to smoke from these fires, and could assign less than actual exposure to some proportions of exposed populations. The initiation of prescribed burns typically occurs only after prescription guidelines are met, which include required meteorological conditions related to wind speed, direction, humidity, and temperature (Chiodi et al., 2018). As a result, our estimate of the local spatial extent of smoke exposure is likely an overestimate of the area actually exposed during each prescribed fire.
Another approach is to attribute measured particulate matter concentrations to, for example, wildfire versus prescribed burn versus other sources and then estimate health impact. Although the source of prescribed burn data is not mentioned, Arriagada et al. (2020) estimated that prescribed burns contributed more PM than wildfires between 2002 and 2017 in Western Australia. In the US in 2017, Jaffe et al. (2020) calculated that in the top five states for annual area burned for wildfire and prescribed burns (which do no overlap), while area burned was comparable, estimated month total and maximum daily PM emitted were approximately 10 times higher for wildfires compared to prescribed burns. Further research should aim to model the heterogeneity of smoke exposures and understand differential health risk to prescribed fire smoke exposure.
Health condition prevalences in our analyses are based on survey data from the Behavioral Risk Factor Surveillance System, and are therefore subject to limitations of this dataset. The data are based on self-reporting information, which can be subject to recall error and bias. Participants were limited to >18 years of age and who lived in a private residences. Therefore, individuals living in institutions (such as nursing homes or prisons) were not included in the sample. The survey is offered only in English, Portuguese, and Spanish. In addition, the survey is conducted by telephone, and telephone survey response rates have been declining over time. Finally, BRFSS sampling is designed to provide state-level estimates and therefore small-area (county-level) estimates could have limited inference. After embarking on this study, the CDC published national-level Census-tract estimates, however they were not age-adjusted. Additionally, these data are measures of the prevalence of specific health conditions in the county and do not indicate whether the health conditions were due to any exposure to prescribed fire or wildfire smoke and are annual averages that cannot discern whether there were exacerbations of any health outcome in temporal and spatial proximity to a specific prescribed fire.
Finally, this is a county-level analysis and therefore all findings only hold at the level of the county and should not be inferred to the scale of the individual. Additionally, this study was cross-sectional we did not examine data longitudinally, such that we could infer whether high levels of prescribed fires within a county were associated with prevalence of chronic health outcomes of concern later. Nevertheless, this study is a first nationwide examination of the socio-demographic and health-related distribution of prescribed burning exposures and potential effects.
5. Conclusions
Prescribed fire has increasingly emerged as an important tool in both restoring ecological conditions and reducing uncontrolled wildfire. It is possible that public health impacts associated with wildfire smoke exposure could be reduced using prescribed burn techniques. From a public health perspective, the tradeoff is between more frequent short-term and small-scale smoke exposure at strategically chosen locations when smoke production and dispersion conditions are deemed tolerable, and less frequent large-scale population-level smoke exposure under potentially undesirable dispersion and dangerous fire propagation conditions. However, there have been relatively few assessments of the practice of prescribed burning and potential vulnerabilities among different segments of populations exposed to smoke from prescribed fires. Our socio-demographic and health assessment of exposed compared to unexposed populations in and near National Forest System lands found some evidence of disproportionate exposure of rural, African-American and (non-Hispanic) white populations in counties with more mobile home and vacant housing units on a national level. It also found evidence of disproportionate exposure of Hispanic populations, the uninsured, and mobile-home communities in the southern region, and of high poverty/low-income populations and communities with high vacancy in the western region. While we see potential disproportionate exposures, based on adjusted regression analyses we found no evidence of disproportionate health burden in exposed compared to unexposed counties after adjustment for potential confounding factors, although more tailored exposure data at a smaller geographic level would be required to validate our findings. Awareness of these patterns could influence both large-scale or institutional-based polices about prescribed burning practice and could be used to build decision-making factors into modeling tools and into Federal and State smoke management plans and guidelines, as well as community-engagement practices around wildfire risk reduction.
Supplementary Material
HIGHLIGHTS.
We examined SES and health in counties exposed to prescribed burns (2010–2019).
We examined associations between prescribed fire exposure and health outcomes.
There was disproportionate prescribed burn exposure among some vulnerable groups.
However, adjusted results showed no evidence of health burden in exposed counties.
These findings could be used improve land-owner decision-making tools.
Funding
This work was supported by unnamed funding from the USDA Forest Service. The findings and conclusions in this report are those of the authors and do not necessarily represent the official position of the USDA Forest Service.
Abbreviations:
- ARPS-Canopy
Advanced Regional Modeling System
- ACS
American Community Survey
- BRFSS
Behavioral Risk Factor Surveillance System
- COPD
chronic obstructive pulmonary disease
- CPFC
Coalition of Prescribed Fire Councils
- CHD
coronary heart disease
- FACTS
Forest Activity Tracking System
- NASF
National Association of State Foresters
- NFS
National Forest System
- CDC
United States Centers for Disease Control and Prevention
- USDA
United States Department of Agriculture
- USFS
United States Forest Service
Footnotes
Declaration of competing interest
The authors declare that they have no known competing financial interests or personal relationships that could have appeared to influence the work reported in this paper.
CRediT authorship contribution statement
All authors contributed to conception and design of the study; acquisition, analysis and interpretation of data; drafting or critically reviewing the article; and final approval of the version to be submitted.
Appendix A. Supplementary data
Supplementary data to this article can be found online at https://doi.org/10.1016/j.scitotenv.2021.150564.
References
- Abatzoglou JT, Williams AP, 2016. Impact of anthropogenic climate change on wildfire across western US forests. Proc. Natl. Acad. Sci. U. S. A. 113, 11770–1775. [DOI] [PMC free article] [PubMed] [Google Scholar]
- Adams MD, Charnley S, 2018. Environmental justice and US Forest Service hazardous fuels reduction: a spatial method for impact assessment of federal resource management actions. Appl. Geogr. 90, 257–71. [Google Scholar]
- Adams MD, Charnley S, 2020. The environmental justice implications of managing hazardous fuels on Federal Forest Lands. Ann. Am. Assoc. Geogr 110, 1907–935. [Google Scholar]
- Adetona O, Reinhardt TE, Domitrovich J, Broyles G, Adetona AM, Kleinman MT, et al. , 2016. Review of the health effects of wildland fire smoke on wildland firefighters and the public. Inhal. Toxicol. 28, 95–139. [DOI] [PubMed] [Google Scholar]
- Afrin S, Garcia-Menendez F, 2020. The influence of prescribed fire on fine particulate matter pollution in the southeastern United States. Geophys. Res. Lett. 47, e2020GL088988. [Google Scholar]
- Afrin S, Garcia-Menendez F, 2021. Potential impacts of prescribed fire smoke on public health and socially vulnerable populations in a southeastern U.S. state. Sci. Total Environ. 794, 148712. [DOI] [PubMed] [Google Scholar]
- Anderson S, Plantinga A, Wibbenmeyer M, 2020. Inequality in Agency Responsiveness: Evidence From Salient Wildfire Events. Working Paper 20–22. [Google Scholar]
- Anselin L, Syabri I, Kho Y, 2010. GeoDa: an introduction to spatial data analysis. Handbook of Applied Spatial Analysis. Springer, pp. 73–89. [Google Scholar]
- Arriagada NB, Palmer AJ, Bowman DM, Johnston FH, 2020. Exceedances of national air quality standards for particulate matter in Western Australia: sources and health-related impacts. Med. J. Aust 50547. [DOI] [PubMed] [Google Scholar]
- Bowman DM, Williamson GJ, Abatzoglou JT, Kolden CA, Cochrane MA, Smith AM, 2017. Human exposure and sensitivity to globally extreme wildfire events. Nat. Ecol. Evol. Nat Ecol Evol 1, 1–6. [DOI] [PubMed] [Google Scholar]
- Burke M, Driscoll A, Heft-Neal S, Xue J, Burney J, Wara M, 2021. The changing risk and burden of wildfire in the United States. Proc. Natl. Acad. Sci. U. S. A. 118. [DOI] [PMC free article] [PubMed] [Google Scholar]
- Centers for Disease Control and Prevention, 2020. Social Vulernability Index (SVI). [Google Scholar]
- Charney JJ, Kiefer MT, Zhong S, Heilman WE, Nikolic J, Bian X, et al. , 2019. Assessing Forest canopy impacts on smoke concentrations using a coupled numerical model. Atmosphere 10, 273. [Google Scholar]
- Chiodi A, Larkin N, Varner JM, 2018. An analysis of southeastern US prescribed burn weather windows: seasonal variability and El Niño associations. Int. J. Wildland Fire 27, 176–189. [Google Scholar]
- Davies IP, Haugo RD, Robertson JC, Levin PS, 2018. The unequal vulnerability of communities of color to wildfire. PLoS One 13, e0205825. [DOI] [PMC free article] [PubMed] [Google Scholar]
- Dennison PE, Brewer SC, Arnold JD, Moritz MA, 2014. Large wildfire trends in the western United States, 1984–2011. Geophys. Res. Lett. 41, 2928–2933. [Google Scholar]
- Economic Research Service of the US Department of Agriculture, 2020. Rural-Urban Continuum Codes 2013. [Google Scholar]
- Finlay SE, Moffat A, Gazzard R, Baker D, Murray V, 2012. Health impacts of wildfires. PLoS Curr. 4, e4f959951cce2c. [DOI] [PMC free article] [PubMed] [Google Scholar]
- Flannigan MD, Krawchuk MA, de Groot WJ, Wotton BM, Gowman LM, 2009. Implications of changing climate for global wildland fire. Int. J. Wildland Fire 18, 483–507. [Google Scholar]
- Grell GA, Peckham SE, Schmitz R, McKeen SA, Frost G, Skamarock WC, et al. , 2005. Fully coupled “online” chemistry within the WRF model. Atmos. Environ. 39, 6957–6975. [Google Scholar]
- Haikerwal A, Akram M, Del Monaco A, Smith K, Sim MR, Meyer M, et al. , 2015a. Impact of fine particulate matter (PM 2.5) exposure during wildfires on cardiovascular health outcomes. J. Am. Heart Assoc. 4, e001653. [DOI] [PMC free article] [PubMed] [Google Scholar]
- Haikerwal A, Reisen F, Sim MR, Abramson MJ, Meyer CP, Johnston FH, et al. , 2015b. Impact of smoke from prescribed burning: is it a public health concern? J. Air Waste Manage. Assoc. 65, 592–598. [DOI] [PubMed] [Google Scholar]
- Haines TK, Busby RL, Cleaves DA, 2001. Prescribed burning in the south: trends, purpose, and barriers. South. J. Appl. For. 25, 149–153. [Google Scholar]
- Heilman WE, Zhong S, John L, Charney JJ, Kiefer MT, Clark KL, 2013. Development of modeling tools for predicting smoke dispersion from low-intensity fires. Final Report, U.S. Joint Fire Science Program, Project 09–1-04–1.
- Jaffe DA, O’Neill SM, Larkin NK, Holder AL, Peterson DL, Halofsky JE, et al. , 2020. Wildfire and prescribed burning impacts on air quality in the United States. J. Air Waste Manage. Assoc. 70, 583–615. [DOI] [PMC free article] [PubMed] [Google Scholar]
- Johnson Gaither C, Afrin S, Garcia-Menendez F, Odman MT, Huang R, Goodrick S, et al. , 2019. African american exposure to prescribed fire smoke in Georgia, USA. Int. J. Env. Res. Public Health 16, 3079. [DOI] [PMC free article] [PubMed] [Google Scholar]
- Kiefer M, Zhong S, Heilman W, Charney J, Bian X, 2013. Evaluation of an ARPS-based canopy flow modeling system for use in future operational smoke prediction efforts. J. Geophys. Res. Atmos 118, 6175–6188. [Google Scholar]
- Kiefer MT, Heilman WE, Zhong S, Charney JJ, Bian X, Skowronski NS, et al. , 2014. Multiscale simulation of a prescribed fire event in the New Jersey pine barrens using ARPS-CANOPY. J. Appl. Meteorol. Clim. 53, 793–812. [Google Scholar]
- Kochanski AK, Jenkins MA, Yedinak K, Mandel J, Beezley J, Lamb B, 2016. Toward an integrated system for fire, smoke and air quality simulations. Int. J. Wildland Fire 25, 534–546. [Google Scholar]
- Kondo MC, De Roos AJ, White LS, Heilman WE, Mockrin MH, Gross-Davis CA, et al. , 2019. Meta-analysis of heterogeneity in the effects of wildfire smoke exposure on respiratory health in North America. Int. J. Env. Res. Public Health 16, 960. [DOI] [PMC free article] [PubMed] [Google Scholar]
- Lim SH, Bowker J, Johnson CY, Cordell HK, 2009. Perspectives on prescribed fire in the south: does ethnicity matter? South. J. Appl. For. 33, 17–24. [Google Scholar]
- Liu JC, Pereira G, Uhl SA, Bravo MA, Bell ML, 2015. A systematic review of the physical health impacts from non-occupational exposure to wildfire smoke. Environ. Res. 136, 120–132. [DOI] [PMC free article] [PubMed] [Google Scholar]
- Luo L, Tang Y, Zhong S, Bian X, Heilman WE, 2013. Will future climate favor more erratic wildfires in the western United States? J. Appl. Meteorol. Clim. 52, 2410–417. [Google Scholar]
- Mandel J, Beezley JD, Kochanski AK, 2011. Coupled atmosphere-wildland fire modeling with WRF 3.3 and SFIRE 2011. Geosci. Model Dev. 4, 591–610. [Google Scholar]
- Melvin M, 2020. 2020 National Prescribed Fire Use Report. Technical Bulletin 04–20. Coalition of Prescribed Fire Councils, Inc. [Google Scholar]
- Miller RK, Field CB, Mach KJ, 2020. Barriers and enablers for prescribed burns for wildfire management in California. Nat. Sustain. 3, 101–109. [Google Scholar]
- National Interagency Fire Center, 2021. Prescribed Fire Statistics.
- National Science and Analysis Team, USDA, USDOI, 2014. National Cohesive Wildland Fire Management Strategy. USDA Forest Service. [Google Scholar]
- Navarro KM, Schweizer D, Balmes JR, Cisneros R, 2018. A review of community smoke exposure from wildfire compared to prescribed fire in the United States. Atmosphere 9, 185. [Google Scholar]
- Prunicki M, Rodd Kelsey JL, Zhou X, Smith E, Haddad F, Wu J, et al. , 2019. The impact of prescribed fire versus wildfire on the immune and cardiovascular systems of children. Allergy 74, 1989. [DOI] [PMC free article] [PubMed] [Google Scholar]
- Radeloff VC, Helmers DP, Kramer HA, Mockrin MH, Alexandre PM, Bar-Massada A, et al. , 2018. Rapid growth of the US wildland-urban interface raises wildfire risk. Proc. Natl. Acad. Sci. U. S. A. 115, 3314–3319. [DOI] [PMC free article] [PubMed] [Google Scholar]
- Rappold AG, Reyes J, Pouliot G, Cascio WE, Diaz-Sanchez D, 2017. Community vulnerability to health impacts of wildland fire smoke exposure. Environ. Sci. Technol. 51, 6674–6682. [DOI] [PMC free article] [PubMed] [Google Scholar]
- Rappold AG, Hano MC, Prince S, Wei L, Huang SM, Baghdikian C, et al. , 2019. Smoke sense initiative leverages citizen science to address the growing wildfire-related public health problem. Geohealth 3 (12), 443–457. [DOI] [PMC free article] [PubMed] [Google Scholar]
- Reid CE, Brauer M, Johnston FH, Jerrett M, Balmes JR, Elliott CT, 2016. Critical review of health impacts of wildfire smoke exposure. Environ. Health Perspect. 124, 1334. [DOI] [PMC free article] [PubMed] [Google Scholar]
- Schelhas J, Hitchner S, Johnson Gaither C, Fraser R, Jennings V, Diop A, 2016. Engaging african american landowners in sustainable Forest management. J. For. 115, 26–33. [Google Scholar]
- Schultz CA, McCaffrey SM, Huber-Stearns HR, 2019a. Policy barriers and opportunities for prescribed fire application in the western United States. Int. J. Wildland Fire 28, 874–884. [Google Scholar]
- Schultz CA, Thompson MP, McCaffrey SM, 2019b. Forest service fire management and the elusiveness of change. Fire Ecol. 15, 1–15. [Google Scholar]
- Shamarock W, Klemp J, Dudhia J, 2008. A Description of the Advanced Research WRF. NCAR Technical Note TN–475þ STR, Version, p. 3. [Google Scholar]
- Spracklen DV, Mickley LJ, Logan JA, Hudman RC, Yevich R, Flannigan MD, 2009. Impacts of climate change from 2000 to 2050 on wildfire activity and carbonaceous aerosol concentrations in the western United States. J. Geophys. Res. Atmos. 114. [Google Scholar]
- Stohl A, Forster C, Frank A, Seibert P, Wotawa G, 2005. The lagrangian particle dispersion model FLEXPART version 6.2. Atmos. Chem. Phys. 5, 2461–2474. [Google Scholar]
- Tang Y, Zhong S, Luo L, Bian X, Heilman WE, Winkler J, 2015. The potential impact of regional climate change on fire weather in the United States. Ann. Am. Assoc. Geogr. 105, 1–21. [Google Scholar]
- USDA Forest Service, 2015. NFS Administrative Forest Area.
- USDA Forest Service, 2020. Hazardous Fuel Treatments - Polygon Dataset. Forest Service Activity Tracking System (FACTS) Database.
- Wettstein ZS, Hoshiko S, Fahimi J, Harrison RJ, Cascio WE, Rappold AG, 2018. Cardiovascular and cerebrovascular emergency department visits associated with wildfire smoke exposure in California in 2015. J. Am. Heart Assoc. 7, e007492. [DOI] [PMC free article] [PubMed] [Google Scholar]
- Wigtil G, Hammer RB, Kline JD, Mockrin MH, Stewart SI, Roper D, et al. , 2016. Places where wildfire potential and social vulnerability coincide in the coterminous United States. Int. J. Wildland Fire 25, 896–908. [Google Scholar]
- Wonkka CL, Rogers WE, Kreuter UP, 2015. Legal barriers to effective ecosystem management: exploring linkages between liability, regulations, and prescribed fire. Ecol. Appl. 25, 2382–2393. [DOI] [PubMed] [Google Scholar]
- Yi H, Kreuter UP, Han D, Güneralp B, 2019. Social segregation of ecosystem services delivery in the San Antonio region, Texas, through 2050. Sci. Total Environ. 667, 234–247. [DOI] [PubMed] [Google Scholar]
- Yue X, Mickley LJ, Logan JA, Kaplan JO, 2013. Ensemble projections of wildfire activity and carbonaceous aerosol concentrations over the western United States in the mid-21st century. Atmos. Environ. 77, 767–780. [DOI] [PMC free article] [PubMed] [Google Scholar]
- Zhang C, Tian H, Wang Y, Zeng T, Liu Y, 2010. Predicting response of fuel load to future changes in climate and atmospheric composition in the southern United States. For. Ecol. Manag. 260, 556–564. [Google Scholar]
Associated Data
This section collects any data citations, data availability statements, or supplementary materials included in this article.