Abstract
Kappa carrageenan was used to prepare hydrogels having novel compositions with poly(vinyl alcohol) (PVA) and a crosslinker (3-aminopropyl)triethoxysilane (APTES). FTIR was used to confirm the structure and composition of hydrogels. The swelling behavior of hydrogels was studied under different conditions of pH and electrolytic aqueous media. The most efficient swelling result (200%) was observed by the sample containing a low fraction of crosslinker. It also showed different swelling responses in different pH solutions that made it suitable for drug delivery. Thermogravimetric analysis (TGA) illustrated that with the increase in crosslinker amount, the stability of hydrogel was increased. The biodegradation analysis of the hydrogels exhibited the break down by various enzymes into small chain polysaccharides that further broke down in the metabolic pathways. It was revealed that all the hydrogel samples showed strong antibacterial activity against S. aureus and a little against E. coli. Cephradine was used as a model drug and its in vitro release was studied in simulated intestinal fluids (SIF). This release account of the cephradine demonstrated that the release of the drug increased as the time and pH increased, reaching its maximum amount of 85.5% after 7.5 h.
Kappa carrageenan was used to prepare hydrogels having novel compositions with poly(vinyl alcohol) (PVA) and a crosslinker (3-aminopropyl)triethoxysilane (APTES).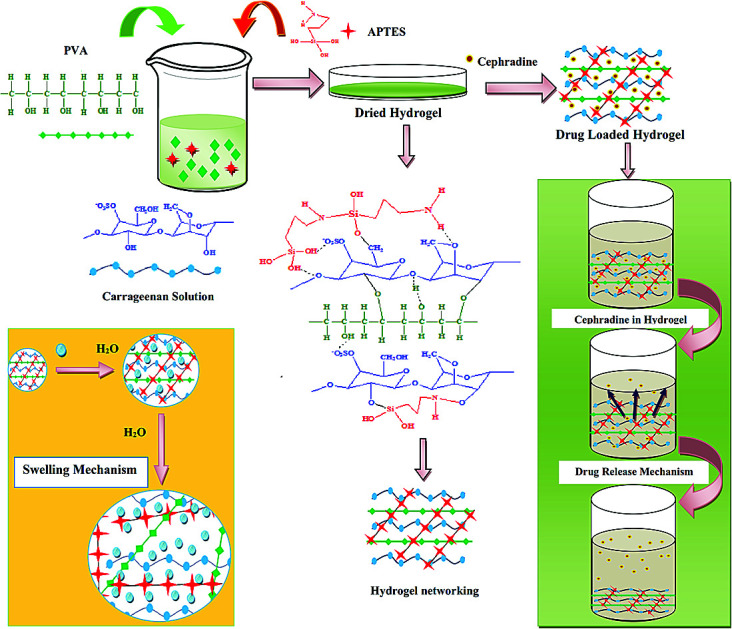
Introduction
Hydrogel is a polymeric network that has crosslinking structures or relocation of functional groups depending upon the interactions with the water molecules. The hydrophobicity or hydrophilicity of these systems makes them the best suited in biomedicine.1,2 Almost all biopolymers have hydroxyl and amine (i.e. chitosan) functional groups that can be helpful in the production of intermolecular hydrogen bonding, though they also exhibit hydrophobicity, which might be due to alkyl branches.3 Well suited to living organisms and eco-friendly hydrogels are produced by means of biopolymers,4,5 or with the use of synthetic polymers which are biocompatible. In biopolymers, chitosan attracts consideration because of its accepted biocompatibility and biodegradation by enzymatic action.6
The development of stimuli responsive blends of biopolymers is a dynamic field of research, due to the effect of the nature of the medium, heat, presence of ions and electro-positivity or electronegativity of ions, etc.7 The blending of chitosan with chemical species having polyhydroxy nature produces stimuli responsive hydrogels. The heat responsive gels are transformed from liquid to gel by increasing temperature; therefore, they are useful as injectable systems for drug delivery.8
Among natural polymers, kappa carrageenan has linear arrangement of monomers i.e.d-galactose-4-sulfate and 3,6-anhydro-d-galactose. There are three basic types of carrageenan, but only iota and kappa are mostly used for gel formation.9 These are hydrocolloids and used in dairy products as well as in pharmaceutics.10,11 In various types of polymers, polysaccharides are considered best for hydrogel formation because of their composition, elasticity and biocompatibility. In addition, carrageenan is abundant in nature with acidic or neutral structures. Biopolymer based hydrogels have reduced mechanical properties that might be due to non-crystalline structures, hydrophilicity, swelling behaviour and crosslinking level. Mechanical strength of hydrogels can be increased by increasing the amount of crosslinker that results in minimizing the distance of fragments, and increasing the crystallinity and brittleness.12–14
Synthetic polymers increase the different properties of biopolymers while being blended with them.15–17 Having outstanding mechanical properties, PVA is one of the synthetic polymers. Biopolymer based hydrogels with PVA are biocompatible, non-carcinogen, and have reliable physical properties.18,19 PVA has been used by many researchers for various applications in biomedicines,20 water treatment, agriculture, sorption,21 and industry.
Blending of natural polymers with synthetic polymers usually requires crosslinking agents. In addition, among different category of crosslinkers, silanes are appreciably preferred for blending because of their ionic linking, non-toxic nature, and easy condensation.20–22 PVA is a synthetic polymer that is soluble in water, and is also biodegradable.23 The polymeric blends of synthetic and biopolymers have been reported having maximum swelling at low pH.24–27 Furthermore, such compositions cannot be used in gastric drug delivery. However, we developed hydrogels that showed high swelling at pH 8.
In the present study, biopolymers (carrageenan), and synthetic polymer (PVA) based novel stimuli responsive hydrogel blends are prepared using silane crosslinker (APTES) due to its acceptance in biomaterials. The swelling behaviour of hydrogels is investigated and found them pH sensitive. Cephradine is from a group of cephalosporin drugs that are common antibiotics, chosen as a model drug. Furthermore, it is used to treat bacterial infections including upper respiratory infections, skin infections, urinary tract infections, and ear infections. The synthesized cephradine loaded hydrogel sample showed release in a controlled way in simulated intestinal fluid (SIF).
Materials and method
Materials
Carrageenan (CAS number 90000 SIGMA), PVA (CAS number 9002, Mw: 89 000), APTES (CAS number 919, Mw: 221.2) were received from Sigma-Aldrich. Sodium hydroxide, hydrochloric acid, and methanol (99.7%) were purchased from Sigma-Aldrich. Cephradine was obtained from Henzils Pharma, Lahore, Pakistan.
Fabrication of hydrogel
Carrageenan (0.4 g) was dissolved into deionized water at room temperature in a glass beaker containing magnetic stirrer. PVA (0.4 g) was dissolved in 25 mL of deionized H2O at 85 °C till a clear solution was obtained. Carrageenan solution in 25 mL H2O was mixed with dissolved PVA and blended it for 2 h. In addition, varying amounts of APTES (50, 100, 200 and 400 μL) were dissolved in 5 mL ethanol and added to the blending solution while stirring. After 2 h, the resulting gel was poured in Petri dishes for drying at room temperature. Moreover, the codes were given as AP 5, AP 10, AP 20 and AP 40.
FTIR analysis
AFTIR spectrum was recorded for the prepared samples using Nicolet 6700 spectrometer. Further, all the samples were vacuum dried before using in IR spectrometer. In addition, scanning range was 4000–400 cm−1. Consequently, the average scans and resolution were 150 and 4.0 cm−1, respectively.
Swelling analysis
To ensure the swelling actions of the hydrogels, the following method was implemented. A weighed amount (20 mg) of each hydrogel was taken in a beaker containing a measured amount (100 mL) of appropriate solvent. At a given time, the weight of the swelled hydrogel was determined by removing the excess of solvent through gently absorbing at surface. Again, it was engrossed in that solvent in order to accomplish equilibrium of the swelling. Eqn (1) was used to calculate the percentage of swelling:
 |
1 |
where, “Ws” is a weight of the swelled gel and “Wd” is the weight of the dry gel.
TGA
Thermogravimetric analysis of all the samples was carried out in a PerkinElmer instrument, in the presence of nitrogen atmosphere. All the samples were heated at the scanning rate of 20 °C min−1 for the range of 50–600 °C.
Biodegradation of hydrogels
Phosphate buffer saline (PBS) was used for in vitro biodegradation of the hydrogels. All the samples (25 mg) were placed in PBS for seven days. After one, three, and seven days, the samples were taken out and weighed, respectively. The weight loss was investigated by subtracting the final weight from the initial weight.
Antimicrobial activity
Antibacterial tests of hydrogels were performed while using agar-disc diffusion assay against E. coli, a Gram negative bacterial strain. In this method, the bacteria was inoculated in the 5 mL of LB broth (1% NaCl, 1% Tryptone, 0.5% yeast having pH: 7.4) and incubated at 37 °C for overnight. The bacterial culture (70 μL) was poured in the center of LB-agar plates (LB medium and 1.5% agar) and spreaded evenly with the help of glass spreader, which was earlier washed with 70% ethanol. The Whatman filter paper discs with the prepared hydrogel samples (AP 5, AP 10, AP 20 and AP 40) were placed in agar plates. The sealed Petri plates were then kept at room temperature for 2 h so that the diffusion of the tested sample may take place. Afterwards, the Petri plates were then incubated at 37 °C for overnight. On the other hand, the Petri plates were not inverted upside down in order to prevent the outflow of the extracts. On the next day, the inhibition zone for the both samples, and controls were observed.28
Drug loading and release
The different hydrogel samples were loaded with cephradine (50 mg). In addition, the weighed amount of cephradine was dissolved in 30 mL deionized water, and added prior to the addition of crosslinker while blending. Further, it was stirred for one hour at 60 °C. Then 50 μL of crosslinker (APTES) was added and stirred for three hours. This blending solution of Cg (0.4 g), PVA (0.4 g), APTES (50 μL) and cephradine (50 mg) was poured on a Petri dish and kept at room temperature to dry. Then, it was vacuum dried at 50 °C for 2 h in drying oven (LVO-2040, Lab Tech, Korea). Then after, the dried hydrogel containing the drug was placed in a beaker having SIF (100 mL) at 37 °C. Afterwards, with the difference of 10 min, a 5 mL solution was taken with syringe from SIF carrying hydrogel. Also, a 5 mL of SIF solution was added back to keep the volume up-to-the-mark (100 mL). The sample collection was done for three hours. The in vitro, cephradine release was evaluated while using double beam UV-Vis spectrophotometer (Labomed, Inc. UVD-3500, USA) at 254 nm. The amount of the drug was calculated from calibration curve drawn for the standards of cephradine.
Results and discussion
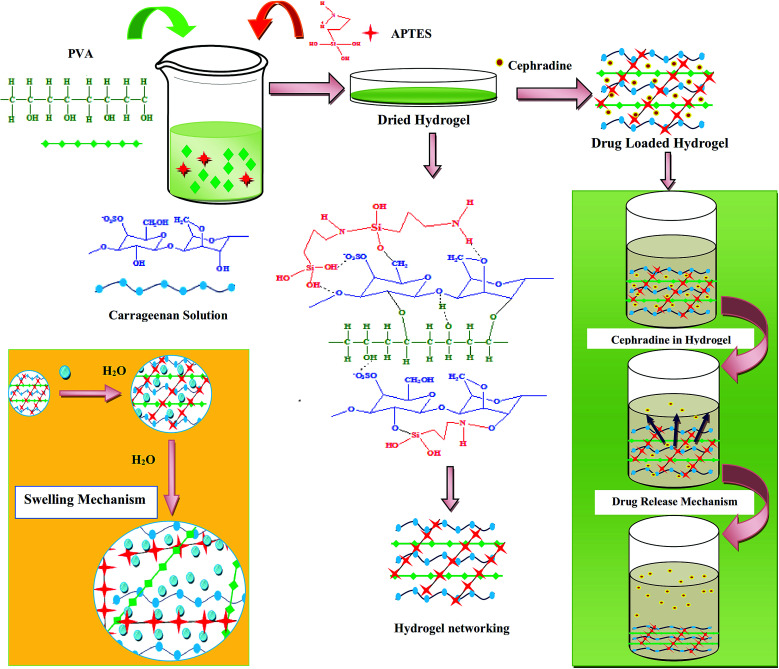
As shown in Scheme 1, carrageenan, PVA and silane crosslinkers have physical as well as chemical electrostatic attractions that provided the hydrogel with a stable structure. In addition, these interactions also made it stimuli responsive because of which they could prove to be the best carriers for drugs in the targeted drug release.
Scheme 1. The proposed mechanism of interactions presented in synthesized blend hydrogel.
Structural analysis
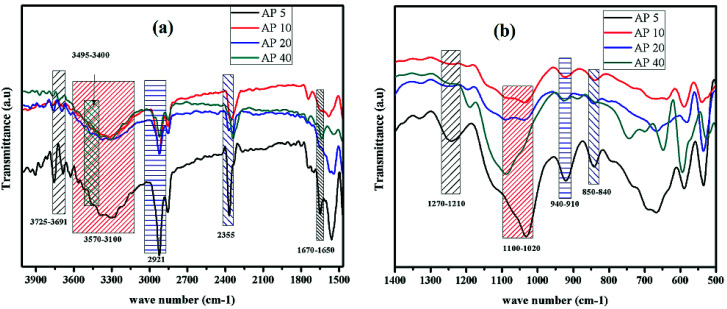
The confirmation of the functional groups has been carried out by Fourier transform spectroscopy in the range of 4000–400 cm−1. FTIR spectra of AP 5, AP 10, AP 20 and AP 40 have been shown in Fig. 1 and characteristics peaks are given in Table 1. In the FTIR spectrum of carrageenan based hydrogel, the peaks related to PVA, APTES and carrageenan have been observed. The characteristic peaks of carrageenan are 940–910 cm−1 for 3,6-anhydro-d-galactose (C–O–C), 850–840 cm−1 for d-galactose-4-sulphate, 1380–1355 cm−1 for sulfates (stretching), 1270–1210 cm−1 O S O (asymmetric stretching), 1010–1080 cm−1 for glycosidic linkage and 3400–3000 cm−1 for O–H (stretching). The new absorption peaks like 1424 cm−1 and 1655 cm−1 have also been detected in addition to the characteristic bands. Carrageenan consists of hydroxyl functional group; consequently, the intermolecular hydrogen bonding may happen between carrageenan and other blended chemical moieties (PVA) in the blended hydrogel. In addition, the pure carrageenan shows a broad band at 3495 cm−1.37 Furthermore, broadening of peaks up-to 3400 cm−1 can be observed with the increasing amount of APTES as shown in Fig. 1. Similarly, a strong peak for bending vibration of water is appeared at 1670–1650 cm−1 for the blended hydrogel samples.42 This shifting can be accredited to the hydrogen bonding between carrageenan and PVA. Moreover, stretching of –OH due to hydrogen bonding in the hydrogel samples after cross-linking shows a broad band between 3570 and 3100 cm−1.29
Fig. 1. FTIR spectra of the prepared hydrogel samples; labels point out various functional groups present in the structural design of hydrogel.
Characteristic FTIR peaks present in the synthesized hydrogel samples.
| Functional Groups | Wave number (cm−1) |
|---|---|
| Carrageenan | |
| d-Galactose-4-sulphate | 850–840 |
| 3,6-Anhydro-d-galactose | 940–910 |
| Glycosidic linkage | 1100–1020 |
| Sulphate ester | 1270–1210 |
| O–H stretching | 3400–3000 |
| Water | |
| H–O–H bending | 1670–1650 |
| PVA | |
| O–H stretching | 3750–3100 |
| APTES | |
| Si–O–Si | 1100–1020 |
| –CH stretching | 2921 |
| Si–OH | 3725 |
Carrageenan also have characteristic peak of glycosidic linkage at 1010–1080 cm−1. In the hydrogel samples containing APTES, the peaks in the range of 1100–1020 cm−1 confirm the presence of Si–O–Si and Si–O–C linkages. Fig. 3 explains the overlapping peaks of the both glycosidic and siloxane linkages. Further, the bending of –OH shows a peak at 1424 cm−1 for the pure PVA whereas its bending becomes limited after cross-linking. Besides this, the hydrogen bonding as spectrum explains that with increasing the amount of cross linker, this band disappears. The same case happens with the stretching of C–O (1090 cm−1) in the pure PVA and hydrogel samples. Moreover, it makes persuaded the cross linking pattern in the hydrogel samples by means of silanol. The peaks at 2921 and 3725 cm−1 are observed due to the stretching of (–CH) alkyl and silanol (Si–OH), respectively.30,31
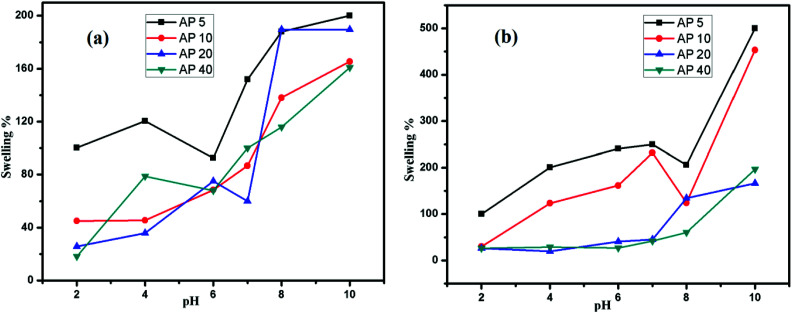
Fig. 3. (a) Swelling response of prepared hydrogel samples as a function of pH in buffer (b) non-buffer.
Swelling behavior
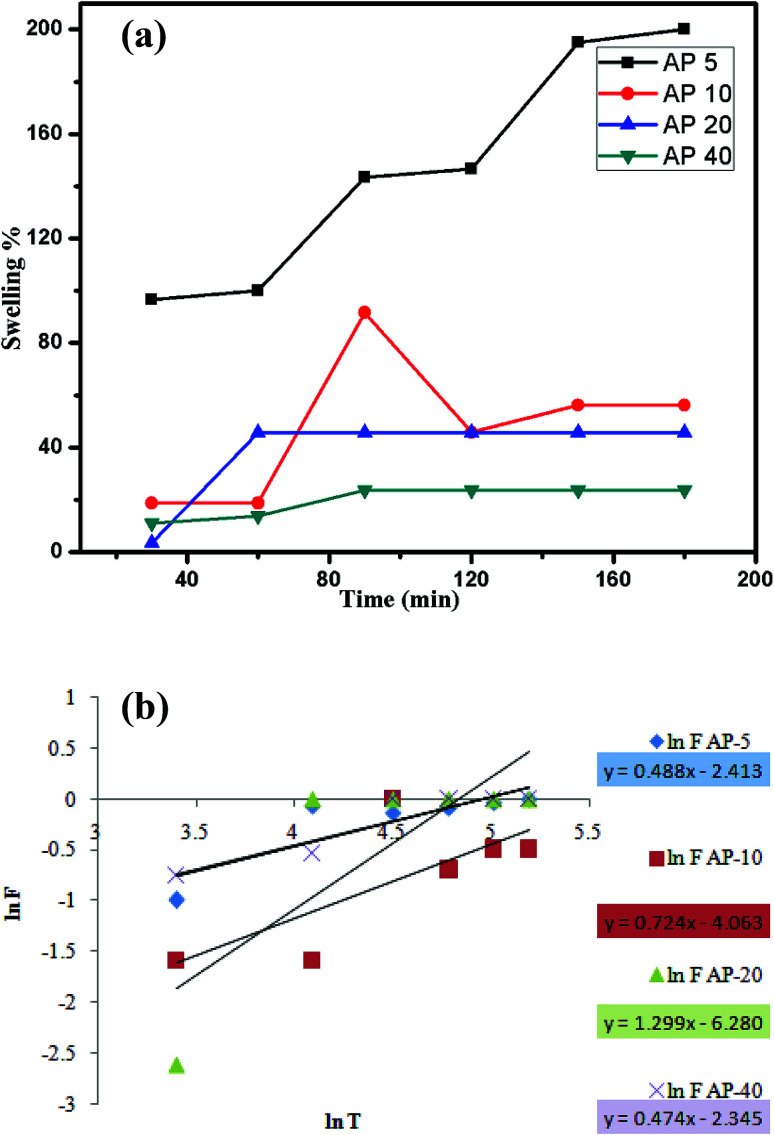
The swelling of hydrogels is mainly based on the absorption of the liquid solvent from external medium to inside the complex polymer chain structure. Fig. 2(a) shows the swelling% of the hydrogel with the reference of time. Interestingly, all the hydrogels showed the diverse behavior; as the time increased, a linear increase with the small variations was observed.32 The maximum swelling was observed at the time of 200 min for AP 5 and 100 min for AP 10, AP 20 and AP 40. In all these samples, AP 5 showed maximum (20 g g−1) and AP 40 exhibited minimum (5 g g−1) swelling.
Fig. 2. (a) Swelling of synthesized Cg based blends hydrogels with respect to time in distilled water. (b) The plot of ln F and ln T for the synthesized hydrogels for diffusion models.
A normal trend of decrease in the swelling was detected with the increase in the amount of (APTES) crosslinker.33 In addition, the swelling was decreased with the maximum crosslinker concentration (400 μL) due to the creation of additional crosslinking points between the chains of polymers. In the same way, the increased amount of the crosslinker enhanced the compactness of the hydrogels by making it difficult to swell with water. Actually, the swelling mechanism in hydrogel is basically the diffusion phenomenon from external solution into the hydrogel chains. This phenomenon was found out by eqn (2).
| F = ktn | 2 |
In this equation of straight line, ‘F’ is fractional swelling of the sample; ‘k’ is a swelling rate constant, ‘n’ is a swelling exponent, and ‘t’ is the time taken by the sample to swell. The values of ‘k’ and ‘n’ have been obtained from calibration curves drawn in Fig. 2(b) for all the corresponding samples. In addition, these parameters have been given in Table 2. Further, the solvent molecules diffuse into the hydrogels that can be explained by Fick's law. Moreover, the swelling of hydrogels in the presence of water takes place in three steps. In the first step, the water molecules enter the hydrogel moiety. In the second step, polymeric chains loosen up while in the third step; hydrogels expand in the surrounding water.
Values of ‘n’ for different hydrogel samples obtained from equation of straight line.
| AP 5 | AP 10 | AP 20 | AP 40 | |
|---|---|---|---|---|
| Intercept | 3.859 | 0.454 | −2.457 | 0.815 |
| K | 47.41791 | 1.574598 | 0.085692 | 2.259176 |
| n | 0.488 | 0.724 | 1.299 | 0.474 |
| Regression% | 71 | 55 | 65 | 85 |
As relaxation time ‘tr’ became equal to the diffusion time ‘td’, the swelling became non-Fickian. For AP 5 and AP 40, n < 0.5; indicated the Fickian diffusion whereas for AP 10 and AP 20, it was non-Fickian. It showed that the rate of the diffusion was higher than the rate of relaxation for AP 10 and AP 20. In addition, the rate of the swelling for the hydrogel samples depends upon the value of ‘n’ as it decides whether the diffusion rate is Fickian or non-Fickian. Furthermore, if the values of ‘n’ are 0.5 and 1, it is a Fickian, but when the values are 0.5 < n < 1.0, it is non-Fickian or anomalous diffusion. Hence, the values given in the Table 1 clarify that the hydrogel samples obey the non-Fickian diffusion case, because in the non-Fickian diffusion case, the rate of diffusion has maximum values.
Swelling in buffer solutions
The swelling response of these hydrogels depends upon pH of a solution; it is, therefore, they are termed as pH sensitive hydrogels. A minor alteration in pH of the outer solution unbalances the charge in the hydrogel matrix within the chains of the polymers. Carrageenan is comprised of sulphate and –OH functional groups that make these hydrogels pH sensitive. In addition, the swelling response as a function of pH for AP 5, AP 10, AP 20 and AP 40 is shown in Fig. 3(a). Moreover, the maximum swelling of the hydrogels was shown at basic pH whereas the minimum one at acidic pH.
All the hydrogel samples revealed the least swelling in an acidic solution that amplifies the swelling with a change in the nature of the medium from acidic to basic. At pH (1–3), the protonation of –OSO3 functional groups takes place. Actually, it enhances the strength of the intermolecular interactions that is mainly hydrogen bonding. As a result, a condensed complex structure is produced that confines the movement of polymeric chains in the hydrogel. At higher pH (pH 7), these groups ionized and increased swelling is observed. Additionally, the charged zones are generated on pendant polymeric chains that provide high swelling to hydrogels by repelling the other similar charges. In all the samples, the maximum swelling is observed at pH 10 where the complete ionization takes place.34 The effect of pH on release of drug is concerned with swelling behaviour, as greater the swelling larger will be the % age release. Our prepared hydrogels consists of anionic base material (carrageenan) as shown in Scheme 1 and anionic hydrogels show swelling and release at high pH.
Swelling in non-buffer solutions
The swelling of hydrogel in non-buffer solutions is shown in Fig. 3(b). The swelling behaviour has been found to be different in the both non buffer as well as in buffer solutions whereas pH remains the same. In addition to this, the variation in the ionic concentration appears. In non-buffer media, the ionic concentration is low that enhances the swelling capacity of hydrogels. As it is expressed in Fig. 3(b), in non-buffer solutions, the swelling response is higher than in buffer solutions. Furthermore, the swelling pattern is similar to the pronounced swelling for non-buffers. On the other hand, the protonation takes place at low pH (2, 3) that suppresses the ionization that results in low swelling. Contrarily, at high pH, ionization takes place that directs the swelling of the hydrogel. Moreover, all the samples show the maximum swelling at pH 10 where the complete ionization takes place.
The swelling of hydrogels can also be explained in the terms of osmotic pressure; the pressure exerted on the solvent molecules against osmosis. Basically, it is directly related to the molar concentration of the solution. Interestingly, an increase in pH of solution also increases the ionization of sulphate in carrageenan that leads to the increase in osmotic pressure within the hydrogel matrix, due to which the swelling percentage of the hydrogel also increased.21
Swelling in ionic solutions
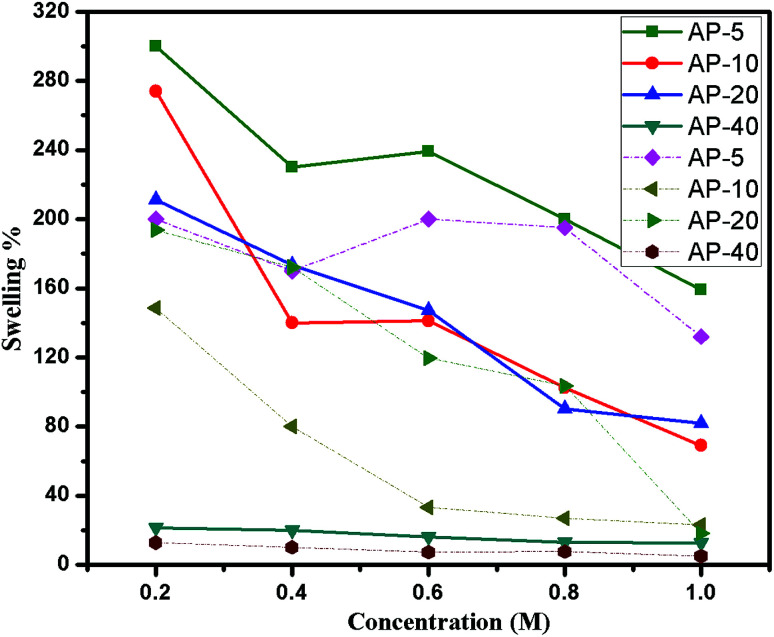
Electrolytes have well-known effects on the swelling behaviour of the hydrogels. Thus, sodium chloride and calcium chloride solutions are used for this purpose. In addition, variable concentrations (0.2, 0.4, 0.6, 0.8, and 1) of the solutions were prepared. The both NaCl and CaCl2 have the same anionic species (Cl−), but different cationic species (Na+ and Ca2+). Further, the effects of the electrolytes concentrations and the charge density have been shown in Fig. 4. With the increased concentration and the charge density of the ions, the swelling is decreased. This decrease in the swelling can be explained by three facts; firstly, the higher concentration of the ions in aqueous medium produced screening effects for the ionic sites in the hydrogels that eventually lessened the osmotic pressure inside the matrix, resulting in low swelling. Secondly, with an increase in the number of moles of ions, cations of the salt are occupied by anionic functional groups of the hydrogel. In fact, it limited the movement of the polymeric chains in the hydrogel. For this reason, the swelling fraction was significantly decreased.35 Thirdly, the charge density of the metal cations also affected the swelling response of hydrogels. Furthermore, polyvalent metal cations can produce complexes. In the case of Ca2+, co-ordination takes place between the −OSO3 of carrageenan and inter chain complexes are formed. This complexational phenomenon enhanced the compacted structure of the hydrogels. As a result, the swelling percentage lowered down.36 The maximum value of the swelling was examined at 0.2 M NaCl as compared with the CaCl2 (0.2 M). The swelling percentage for AP 5 is 200% in 0.2 M NaCl and 200% in 0.2 M CaCl2. The minimum swelling fractions have been shown by AP 40 as it contains higher amount (400 μL) of crosslinker (APTES). As it is cleared from FTIR and Scheme 1 that –OSO3, –OH and NH2 functional groups are present predominantly. These groups are pendate and affect the swelling of hydrogel samples regarding variable external medium in terms of pH and electrolytes.
Fig. 4. The effect of the electrolytes (------, dotted lines for CaCl2 & —, solid lines for NaCl) and their concentrations on the swelling of the hydrogels.
Thermo gravimetric analysis
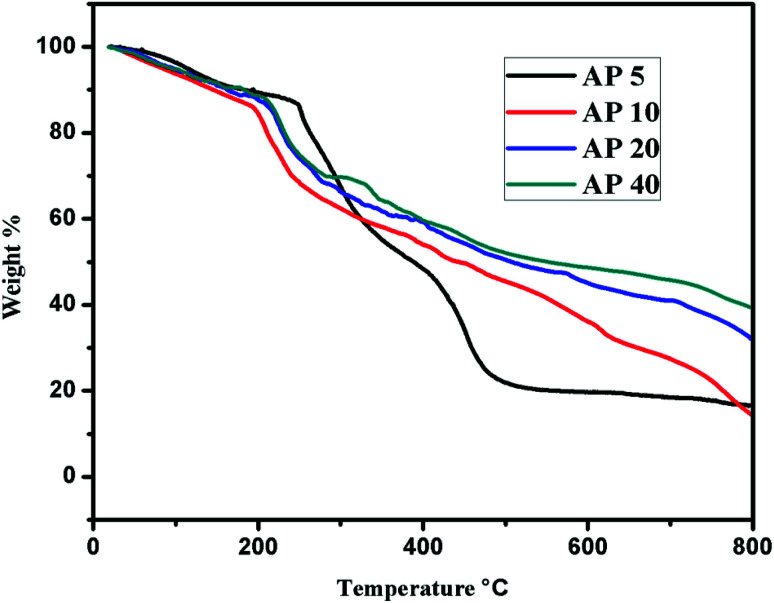
Thermo gravimetric analysis has been performed to investigate the stability of the crosslinked hydrogels and thermograms have been shown in Fig. 5. It shows that the deterioration is resulted in three phases. The first phase change is for the removal of the water contents. The second phase comprises of decomposition of the hydrogel contents whereas the third phase change belongs to disintegration of backbone of the polymer chain. As illustrated in Fig. 5, the loss of the mass starts at 50 °C that is attributed to the elimination of the water molecules; up to 200 °C, all the water molecules present in the hydrogel either physically or chemically bound are deducted. In the second phase, the temperature range is 200–350 °C where dehydration takes place due to chemical bonding of neighboring –OH functional groups that leads to the condensation. In addition, desulphoniazation of the carrageenan also takes place in this zone.36 Further, the degeneration of PVA starts at this temperature as well.37,38 The third deprivation of the mass (400–700 °C) is due to the back bone of the polymers or residues.39–41 With the increase in the concentration of cross linker, the hydrogel becomes thermally more stable. In AP 5, the weight loss is initiated at low temperature as compared with the other samples, 10% loss in the mass is shown at 182 °C. For the same fraction of loss, it is 175 °C for AP 40 as shown in Table 3 whereas for the pure carrageenan powder; it is reported as 130 °C.29 50% loss in the weight has been examined at 387 °C, 439 °C,498 °C and 543 °C for AP 5, AP 10, AP 20 and AP 40, respectively. This increment in the temperature is the confirmation of the thermal stability of the hydrogel samples that is correlated to APTES amount. When there are more cross linked sites in the chains, it will hinder the movements of the chain.
Fig. 5. Thermograms of hydrogel samples; AP 5, AP 10, AP 20 and AP 40.
Thermogravimetric data for AP 5, AP 10, AP 20 and AP 40.
| Samples | T °C, 10% | T °C, 30% | T °C, 50% | T °C, 70% |
|---|---|---|---|---|
| AP 5 | 182 | 293.7 | 387 | 456.6 |
| AP 10 | 144 | 241.8 | 439 | 654 |
| AP 20 | 169 | 274.5 | 498 | 806 |
| AP 40 | 175 | 269.5 | 543 | 876 |
Biodegradation analysis
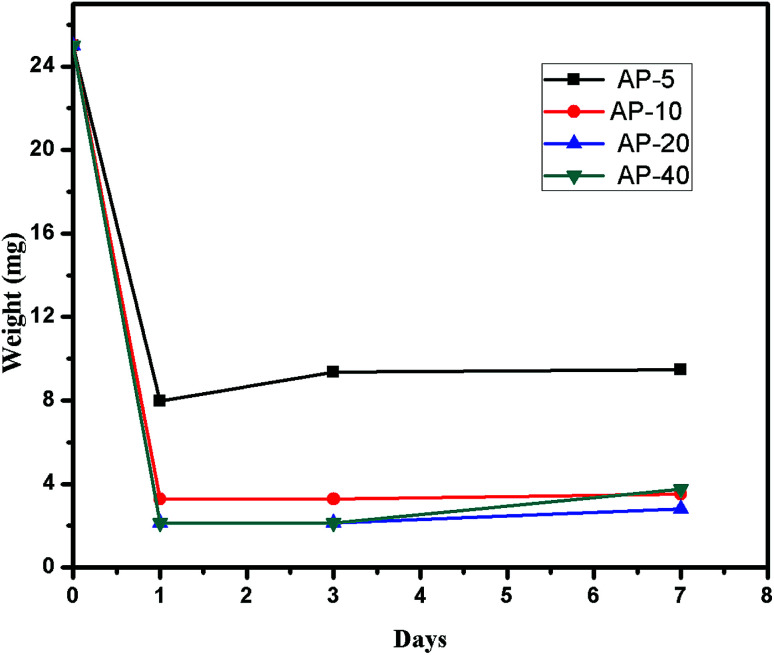
The hydrogels samples are comprised of principally carrageenan with PVA and APTES. The presence of the carrageenan explains the biodegradation of the hydrogels as it consists of glycosidic linkages between the monomeric units of carrageenan. These delicate interactions would easily be broken in vivo by various enzymes that result into the development of small chain polysaccharides. These chains for further breakdown incorporated into the metabolic pathways. All the samples of the hydrogels are placed in the PBS solution in order to investigate the biodegradation. The results have been shown in Fig. 6 that explains a gradual degradation of the hydrogels (62% AP 5, 86% AP 10, 88.8% AP 20 and 84.9% AP 40) with the passage of time.
Fig. 6. The biodegradation assay of the synthesized hydrogels in PBS.
Antimicrobial activity
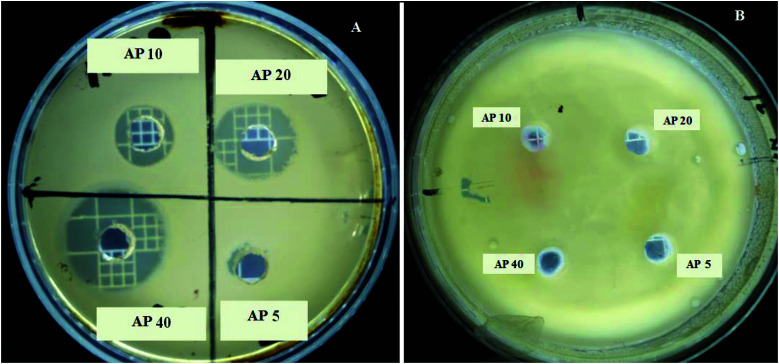
The disc diffusion method has been used to investigate the antimicrobial activity for the hydrogel samples (AP 5, AP 10, AP 20 and AP 40). It is revealed by the results shown in Fig. 7 that all the samples show strong antibacterial activity against S. aureus and a little against E. coli. It might be due the interactive phenomenon of the carrageenan molecules with the cell membrane of bacterial strains as carrageenan comprises of negatively charged SO42− suspended groups, and S. aureus (gram +ve) has an outer covering of mucopeptide and peptidoglyco lipids whereas E. coli consists of phospholipids and lipopolysaccharides that gives a strongly negative charge to its surface. Due to these interactive sites of gram +ve bacteria, the alteration in the cell membrane of bacteria takes place that controls the bacterial growth.15 The second factor that controls the bacterial growth might be the bonding of carrageenan and PVA with DNA of bacterial strain, as it results in the limitation of the transcription and translation by DNA. In fact, some molecules enter the bacterial cell and control the transformation of DNA.16
Fig. 7. Antibacterial activity of synthesized hydrogels; (A) S. aureus and (B) E. coli.
Drug release analysis
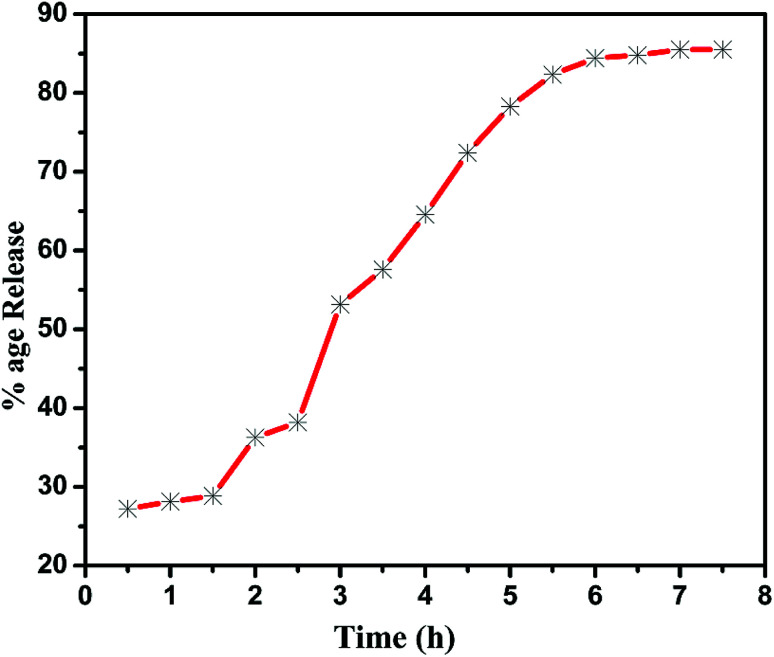
The hydrogel AP 5 was loaded by cephradine (model drug) and its release (%) mechanism as a function of time was studied in SIF. The entire drug (cephradine) was released in 7.5 h in SIF in a consistent manner as shown in the Fig. 8. It reveals that 85.5% drug was released in 7.5 h that was in accordance with the US pharmacopeia standards.26 Moreover, the remaining amount could not be determined because the hydrogel was broken down into fragments. The synthesized hydrogel covered the property of the controlled drug release. Thus, it can be used as intravenous injections. These results prove that these hydrogel samples could be an appropriate candidate for the injectable drug delivery.
Fig. 8. The in vitro percent release of cephradine (model drug) in SIF.
Conclusion
Carrageenan based stimuli responsive hydrogels were successfully prepared by solution casting method. AP 5 showed maximum swelling degree (200%) in distilled water. In addition, the degree of swelling was inversely related to the amount of APTES as it was decreased with the increase in the quantity of APTES. The maximum thermal stability was showed by AP 40 as compared with the other hydrogel samples. The swelling behavior of the hydrogels at different pH showed responsive behaviour. This stimuli responsive performance at different pH suggested these hydrogels for being used in controlled release of drug. The controlled release study of cephradine loaded AP 5 hydrogel exhibited that in SIF, 85.5% of drug was released in a controlled manner in 7.5 h. These hydrogels were confirmed to be a remarkable nominee for injectable systems. The prominent challenge for hydrogels used for drug delivery is their proper use for in vivo studies. Due to complex biological environment in body, the use of these drug loaded hydrogels should be conducted in vivo for further advancement in their clinical applications.
Conflicts of interest
There are no conflicts to declare.
Supplementary Material
Acknowledgments
The author is highly indebted to the Department of Polymer Engineering and Technology and Institute of Chemistry, University of the Punjab, Lahore for providing lab facilities.
References
- Tang Y. Du Y. Li Y. Wang X. Hu X. J. Biomed. Mater. Res., Part A. 2009;91:953–963. doi: 10.1002/jbm.a.32240. [DOI] [PubMed] [Google Scholar]
- Qi X. Wei W. Shen J. Dong W. J. Mater. Chem. B. doi: 10.1039/c8tb03312a. [DOI] [PubMed] [Google Scholar]
- Spagnoli C. Korniakov A. Ulman A. Balazs E. A. Lyubchenko Y. L. Cowman M. K. Carbohydr. Res. 2005;340:929–941. doi: 10.1016/j.carres.2005.01.024. [DOI] [PubMed] [Google Scholar]
- Qi X. Yuan Y. Zhang J. Bulte J. W. M. Dong W. J. Agric. Food Chem. 2018;66:10479–10489. doi: 10.1021/acs.jafc.8b02879. [DOI] [PMC free article] [PubMed] [Google Scholar]
- Qi X. Wei W. Li J. Zuo G. Pan X. Su T. Zhang J. Dong W. Mol. Pharm. 2017;14:431–440. doi: 10.1021/acs.molpharmaceut.6b00875. [DOI] [PubMed] [Google Scholar]
- Bhattarai N. Gunn J. Zhang M. Adv. Drug Delivery Rev. 2010;62:83–99. doi: 10.1016/j.addr.2009.07.019. [DOI] [PubMed] [Google Scholar]
- Islam A. Yasin T. ur Rehman I. Radiat. Phys. Chem. 2014;96:115–119. doi: 10.1016/j.radphyschem.2013.09.009. [DOI] [Google Scholar]
- Lejardia A. Hernándeza R. Criadoa M. Santosc O. J. Etxeberriad A. Sarasuab J. R. Mijangos C. Carbohydr. Polym. 2014;103:267–273. doi: 10.1016/j.carbpol.2013.12.040. [DOI] [PubMed] [Google Scholar]
- Aranilla T. Yoshii F. DelaRosa A. M. Makuuchi K. Radiat. Phys. Chem. 1999;55:127–131. doi: 10.1016/S0969-806X(98)00317-X. [DOI] [Google Scholar]
- Francisa S. Kumar M. Varshneya L. Radiat. Phys. Chem. 2004;69:481e6. [Google Scholar]
- Saha A. Mandal P. C. Bhattacharyya S. N. Radiat. Phys. Chem. 1995;46:123–145. doi: 10.1016/0969-806X(94)00130-C. [DOI] [Google Scholar]
- Buwalda S. J. Boere K. W. M. Dijkstra P. J. Feijen J. Vermonden T. Hennink W. E. J. Controlled Release. 2014;190:254–273. doi: 10.1016/j.jconrel.2014.03.052. [DOI] [PubMed] [Google Scholar]
- Maitra J. Singh N. Advances in Polymer Science and Technology: An International Journal. 2014;4:22–27. [Google Scholar]
- Maitra J. Shukla V. M. Am. J. Polym. Sci. 2014;4:25–31. [Google Scholar]
- Xu Y. Ding W. Liu J. Li Y. Kennedy J. F. Gu Q. Shao S. Carbohydr. Polym. 2010;80:1078–1084. doi: 10.1016/j.carbpol.2010.01.027. [DOI] [Google Scholar]
- Qi X. Wei W. Li J. Liu Y. Hu X. Zhang J. Bi L. Dong W. ACS Biomater. Sci. Eng. 2015;1:1287–1299. doi: 10.1021/acsbiomaterials.5b00346. [DOI] [PubMed] [Google Scholar]
- Qi X. Wei W. Li J. Su T. Pan X. Zuo G. Zhang J. Dong W. Mater. Sci. Eng., C. 2017;75:487–494. doi: 10.1016/j.msec.2017.02.089. [DOI] [PubMed] [Google Scholar]
- Yang X. et al. . Radiat. Phys. Chem. 2010;79:606–611. doi: 10.1016/j.radphyschem.2009.12.017. [DOI] [Google Scholar]
- Torres N. I. Noll K. S. Xu S. Li J. Huang Q. Sinko P. J. Wachsman M. B. Chikindas M. L. Probiotics Antimicrob. Proteins. 2013;5:26–35. doi: 10.1007/s12602-012-9123-x. [DOI] [PMC free article] [PubMed] [Google Scholar]
- Liang S. Liu L. Huang Q. Yam K. L. Carbohydr. Polym. 2009;77:718–724. doi: 10.1016/j.carbpol.2009.02.007. [DOI] [Google Scholar]
- Islam A. Yain T. Bano I. Riaz M. J. Appl. Polym. Sci. 2011;124:4184–4192. doi: 10.1002/app.35392. [DOI] [Google Scholar]
- Jena K. K. Raju K. V. S. N. Ind. Eng. Chem. Res. 2008;47:9214–9224. doi: 10.1021/ie800884y. [DOI] [Google Scholar]
- Shalumon K. T. Anulekha K. H. Nair S. V. Chennazhi K. P. Jayakumar R. Int. J. Biol. Macromol. 2011;49:247–254. doi: 10.1016/j.ijbiomac.2011.04.005. [DOI] [PubMed] [Google Scholar]
- Kim S. J. Park S. J. Kim S. I. React. Funct. Polym. 2003;55:53–59. doi: 10.1016/S1381-5148(02)00214-6. [DOI] [Google Scholar]
- Singh A. Narvi S. S. Dutta P. K. Pandey N. D. Bull. Mater. Sci. 2006;29:233–238. doi: 10.1007/BF02706490. [DOI] [Google Scholar]
- Kim S. J. Lee K. J. Kim I. Y. Kim S. I. J. Macromol. Sci., Part A: Pure Appl.Chem. 2003;40:501–510. doi: 10.1081/MA-120019888. [DOI] [Google Scholar]
- Butt A. Jabeen S. Nisar N. Islam A. Gull N. Iqbal S. S. Khan S. M. Yameen B. Int. J. Biol. Macromol. 2019;121:104–112. doi: 10.1016/j.ijbiomac.2018.10.018. [DOI] [PubMed] [Google Scholar]
- Driscoll A. J. Bhat N. Karron R. A. O'Brien K. L. Murdoch D. R. Clin. Infect. Dis. 2012;54:159–164. doi: 10.1093/cid/cir1061. [DOI] [PubMed] [Google Scholar]
- Ma G. Yang D. Zhou Y. Xiao M. Kennedy J. F. Nie J. Carbohydr. Polym. 2008;74:121–126. doi: 10.1016/j.carbpol.2008.01.028. [DOI] [Google Scholar]
- Kamoun E. A. Kenawy E.-R. S. Tamer T. M. El-Meligy M. A. Eldin M. S. M. Arabian J. Chem. 2015;8:38–47. doi: 10.1016/j.arabjc.2013.12.003. [DOI] [Google Scholar]
- Kamoun E. A. Chen X. Eldin M. S. M. Kenawy E.-R. S. Arabian J. Chem. 2015;8:1–14. doi: 10.1016/j.arabjc.2014.07.005. [DOI] [Google Scholar]
- Islam A. Yasin T. Carbohydr. Polym. 2012;88:1055–1060. doi: 10.1016/j.carbpol.2012.01.070. [DOI] [Google Scholar]
- Rashidzadeh A. Olad A. Salari D. Reyhanitabar A. J. Polym. Res. 2014;21:344–358. doi: 10.1007/s10965-013-0344-9. [DOI] [Google Scholar]
- Pourjavadi A. Barzegar S. Zeidabadi F. React. Funct. Polym. 2007;67:644–654. doi: 10.1016/j.reactfunctpolym.2007.04.007. [DOI] [Google Scholar]
- Francisa S. Kumar M. Varshneya L. Radiat. Phys. Chem. 2004;69:481e6. [Google Scholar]
- Rasool N. Yasin T. Heng J. Y. Y. Akhter Z. Polymer. 2010;51:1687–1693. doi: 10.1016/j.polymer.2010.02.013. [DOI] [Google Scholar]
- Şen M. Avci E. N. J. Biomed. Mater. Res., Part A. 2005;74:187–196. doi: 10.1002/jbm.a.30308. [DOI] [PubMed] [Google Scholar]
- Santos C. Silva C. J. Büttel Z. Guimarães R. Pereira S. B. Tamagnini P. Zille A. Carbohydr. Polym. 2014;99:584–592. doi: 10.1016/j.carbpol.2013.09.008. [DOI] [PubMed] [Google Scholar]
- Hench L. L. Biomaterials. 1998;19:14–19. doi: 10.1016/S0142-9612(98)00133-1. [DOI] [PubMed] [Google Scholar]
- Buranachai T. Praphairaksit N. Muangsin N. AAPS PharmSciTech. 2010;11:1128–1137. doi: 10.1208/s12249-010-9483-z. [DOI] [PMC free article] [PubMed] [Google Scholar]
- Honary S. Hoseinzadeh B. Shalchian P. Trop. J. Pharm. Res. 2010;9:525–531. [Google Scholar]
- Gisbert R. and Jörg S., Chemical/physical preprocessing of nanoclay particles, in Polymer Nanoclay Composites, 2015 [Google Scholar]


