

Abstract
Background:
Persons with multiple sclerosis (MS) have many health conditions related to overweight and obesity, but little is known about how body composition among those with MS compares to those without MS at the same weight.
Objective:
To compare differences in whole body and regional body composition between persons with and without MS matched for sex and body mass index (BMI).
Methods:
Persons with MS (n = 51) and non-MS controls (n = 51) matched for sex and BMI. Total mass, lean mass, fat mass, and percent body fat (%BF) of total body and arm, leg, and trunk segments were assessed using dual-energy X-ray absorptiometry (DXA).
Results:
Men with MS had significantly less whole body lean mass (mean difference: 9933.5 ± 3123.1 g, p < 0.01) and higher fat mass (mean difference: 6079.0 ± 2137.4 g, p = .01) and %BF (mean difference: 9.43 ± 2.04%, p < 0.01) than BMI-matched non-MS counterparts. Further, men with MS had significantly lower lean mass in the arm (p = 0.02) and leg (p < 0.01) and higher fat mass in the arm (p = 0.01), leg (p = 0.03) and trunk (p = 0.03) than men without MS. Men with MS had significantly higher %BF in all three regions (p < 0.01) than men without MS. There were no differences between women with and without MS.
Conclusions:
We observed significant differences in whole body and regional body composition between BMI-matched men with and without MS. Additional research is needed to further explore differences in body composition, adipose distribution, and the impact of these differences on the health and function of men with MS.
Keywords: Multiple sclerosis, Body composition, Obesity
Maintaining a healthy weight is essential for reduction of health risks and promotion of healthy aging, and may further help with symptom management and prevention of disability among persons with chronic diseases and conditions such as multiple sclerosis (MS).1-4 Healthy weight is often measured by body mass index (BMI), calculated from measures of height and weight collected using a scale stadiometer.5 Using BMI has several advantages (e.g. inexpensive and easy to administer), but it is not able to distinguish body composition (i.e. adipose and lean tissue mass or ratio), or identify adiposity distribution. Much of the disease risk associated with body weight stems from body composition, and specificall the presence and location of higher levels body fat and less lean tissue mass. Increased fat mass and decreased lean tissue mass are associated with higher risks of cardiometabolic disease and musculoskeletal conditions including arthritis that can lead to further physical deconditioning, resulting in increased incidence of falls and poor quality of life.6-12 In addition to risks associated with whole body fat and lean mass, the composition of individual body segments has been particularly important for predicting disease risk. For example, increased central adiposity (i.e. abdominal adiposity) is associated with cardiometabolic disease, stroke, and cancer, whereas decreased appendicular lean mass (i.e. lean mass of the arms and legs) is associated with increased falls and frailty.13-16
Persons with MS have elevated rates of many weight-related comorbidities, including cardiovascular disease, fatigue, and depression, and are at higher risk of falls and resulting fractures than healthy controls.17,18 To that end, persons with MS may have distinct patterns of body composition that increase the risk for developing such comorbidities. There is some evidence that people with MS have poorer body composition when compared to healthy controls. Several studies have noted no differences in whole body fat and lean mass between participants with and without MS; however some have reported differences in specific body segments.19 Two separate studies reported no differences in whole body fat or lean mass between women with and without MS; however, both studies reported significantly less lean mass in the lower extremities of women with MS, and one of the studies reported significantly higher fat mass in the lower extremities of women with MS.20,21 A third study reported no differences in total body composition, but noted that participants with MS had significantly more fat mass and less lean mass in the leg, and this reduction in lean mass was associated with reduced muscle fiber size and quadriceps strength.22 These findings highlight the need for more research that examines segmental body composition and fat distribution patterns in people with MS, and how body composition of those with MS compares to individuals without MS at the same weight. Therefore, the current study investigated differences in whole body and regional body composition between pairs of individuals with MS and non-MS controls matched for sex and BMI.
Methods
We conducted a secondary data analysis using a deidentified data set of 235 persons with MS and 53 non-MS controls who had participated in five previous research studies involving body composition assessment at a university research laboratory between January 17, 2006 and July 18, 2014.20,23-25 Three studies involved cross-sectional examinations of fitness, functional, and symptomatic outcomes in persons with MS, and two were prospective studies involving physical activity or exercise training interventions. Data from participants with MS were included from all five research studies (n = 77, n = 61, n = 34, n = 33, n = 30), and data from control participants were included from two (n = 33, n = 20) of these studies. The inclusion criteria for all participants in the original studies were aged 18–65 years; ambulatory with or without an assistive device; and absence of contraindications for exercise participation on the basis of the Physical Activity Readiness Questionnaire.26,27 Participants with MS had a clinically definite diagnosis of MS and were relapse-free during the past 30 days before assessments.
For the purposes of these analyses, participants with MS in the initial dataset were matched with non-MS control participants based on sex and BMI within 0.5 BMI units (kg/m2).
Measures
Height and weight. Height and weight were measured in the laboratory to the nearest 0.1 cm and 0.1 kg, respectively, using a Weigh Beam Eye-Levela scale with a stadiometer (Detecto, Webb City, MO).
Body mass index (BMI). BMI was calculated as the weight in kilograms divided by the height in meters squared.5
Dual-energy X-ray absorptiometry (DXA). Total mass, lean mass, fat mass, and percent body fat (%BF) for both whole body and regional body segments were assessed by DXA using a Hologic QDR 4500Ab bone densitometer (Hologic, Inc., Marlborough, MA). For regional analysis, analytical reference lines were placed through the crease of the axilla and glenohumeral joint as well as the inferior edge of the chin and proximal femur necks to segregate the arms, trunk and legs. All body composition values for the whole body and regional body segments (arm, leg, and trunk) were performed according to manufacturer guidelines. The accuracy of the densitometer was verified daily by scanning the manufacturer's hydroxyapatite spine phantom of a known density.
Expanded Disability Status Scale (EDSS). The EDSS was used to characterize the disability status of MS.28 The EDSS was based on a neurological examine performed by a Neurostatus certified examiner. Neurostatus is an independent platform for training and certification of researchers and physicians participating in projects that use a standardized, quantified neurological examination and assessment of Kurtzke's Functional Systems and the EDSS in MS (https://www.neurostatus.net). The EDSS score ranges from 0 to 10 in 0.5-point increments; 0 indicates normal; 1 presence of minimal signs but no disability (Fig. 1); and 10 refers to death due to MS.
Fig. 1.
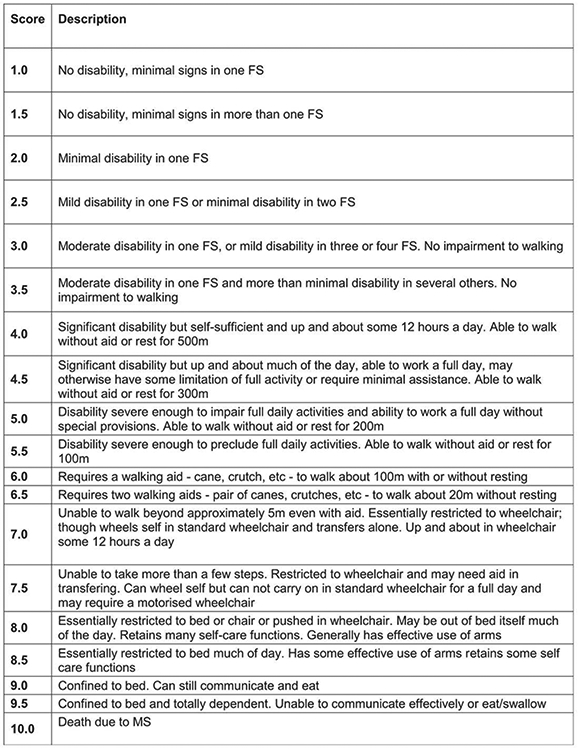
Expanded disability status scale (EDSS) scoring.
Source: Kurtzke JF. Rating neurologic impairment in multiple sclerosis: an expanded disability status scale (EDSS). Neurology 1983; 33(11):1444–1452.
Patient Determined Disease Steps (PDDS) scale. The PDDS scale was used to characterize the level of neurological disability based on the rating of MS participants.29 It is a self-reported, single-item scale that ranges from 0 to 8, where 0 indicates mild MS symptoms that do not limit normal activities (Normal) and 8 indicates inability to sit in a wheelchair for more than an hour (Bedridden). The scale has been validated in MS30 and has correlated strongly with EDSS.31
Walking impairment. Walking impairment was determined by PDDS scores. Participants with a PDDS score of 0–2 were categorized as having no walking impairment. Those with scores of 3–8 were classified as having a walking impairment.
Procedures
The procedures for this secondary data analysis were reviewed and approved by a university institutional review board. Participants in the original studies provided written informed consent before data collection. Briefly, participants visited a university research laboratory to complete demographic, clinical, and morphological assessments. During the testing session, all participants completed a self-report demographic questionnaire and participants with MS further completed the PDDS. Standing height and weight were then assessed by a member of the research team while participants were wearing light clothing and footwear; all participants were capable for standing assessment of height and weight. We then undertook a neurological examination of 8 functional systems (e.g., pyramidal, cerebellar, brainstem, sensor, etc.) and ambulation that was performed by a Neurostatus certified examiner for generating EDSS scores. The examiner was unaware of data from DXA, as the DXA data were post-processed after the data collection session was complete. Participants lastly underwent a whole body DXA scan. The scanning protocol was consistent across all studies and conducted using the same Hologic QDR 4500A bone densitometer. All participants wore lightweight clothing that was free of metal and removed all jewelry before scanning. Participants were instructed to lay supine on the DXA table, with their body position centered within the scanning field. All scanning procedures were performed according to the manufacturer's instructions with the use of positioning aids, as necessary.
Data analysis
Data were analyzed using IBM SPSS Statistics version 23.0 (IBM, Armonk, NY). Descriptive statistics were computed to ensure the matching protocol was successful in generating similar sex and BMI characteristics for the MS and non-MS groups. Descriptive statistics were computed to summarize the demographic, clinical, and anthropometric characteristics of the matched dataset. Values are presented as mean ± standard deviation (SD) unless otherwise specified. Spearman rank correlations (rs) were used to assess correlations between EDSS, PDDS, and body composition within the MS group. Mann-Whitney U tests were used to assess differences in EDSS and PDDS scores based on type of MS. Independent samples t-tests were used to assess differences in body composition (total mass, fat mass, lean mass for whole body and each of the three regional segments) within the MS group based on type of MS, and differences in body composition between the MS and control group (for the entire sample and sex-specific analyses). Cohen's d was calculated as a measure of effect size for differences in body composition between the matched pairs. An effect size of d = 0.2 was considered a small effect size, d = 0.5 was considered a moderate effect size and d = 0.8 was considered a large effect size.32
Results
51 matched pairs (n = 102 total participants; 80% female) were included in the analysis. Table 1 provides the full characteristics of the sample. The mean age of the total sample was 47.9 ± 10.2 years (MS group: 46.9 ± 9.2 years; control group: 48.9 ± 11.2 years). Per the study design, there were no significant differences in height, weight or BMI between the two groups. There were no differences in age between the groups. Within the MS group, 40% of participants had relapsing-remitting MS, and the mean time since diagnosis was 12.1 ± 7.6 years.
Table 1.
Participant characteristics separated by sex.
| Males (n = 20) |
Females (n = 82) |
|||
|---|---|---|---|---|
| MS (n = 10) |
Control (n = 10) |
MS (n = 41) |
Control (n = 41) |
|
| Age, yrs. | 48.8 ± 10.2 | 42.0 ± 14.2 | 46.5 ± 9.0 | 50.59 ± 9.8 |
| Height, cm | 176.2 ± 8.8 | 179.9 ± 3.8 | 166.9 ± 6.6 | 163.3 ± 7.4 |
| Weight, kg | 73.8 ± 11.4 | 76.5 ± 7.6 | 73.0 ± 16.5 | 69.3 ± 13.6 |
| BMI, kg/m2 | 23.6 ± 2.5 | 23.7 ± 2.6 | 26.1 ± 5.2 | 26.1 ± 5.2 |
| EDSS, median (range) | 4 (1.5–6.5) | NA | 3.5 (0–6.5) | NA |
| PDDS, median (range) | 2.5 (0–5) | NA | 2.00 (0–6) | NA |
| MS Type, % | ||||
| Relapsing | 70.0 | NA | 80.5 | NA |
| Progressive | 30.0 | NA | 19.5 | NA |
| Disease Duration, yrs. | 9.8 ± 5.9 | NA | 12.7 ± 8.0 | NA |
| Walking Impairment, % | ||||
| No | 50.0 | NA | 59.0 | NA |
| Yes | 50.0 | NA | 41.0 | NA |
Note: Data reported as mean ± SD, median (range) or %. MS, multiple sclerosis: EDSS, expanded disability status scale; PDDS, patient determined disease step; BMI, body mass index.
Within the MS group, participants with progressive MS had significantly higher scores on both the EDSS and PDDS than those with relapsing-remitting MS (median, range: EDSSprogressive: 6.5, 3.0, EDSSRelapsing: 3.5, 6.5, P < 0.001; PDDSprogressive: 4.0, 4.0, PDDSRelapsing: 1.0, 5.0, p < 0.001). There were no differences in body composition between the two types of MS. There were no significant correlations between EDSS or PDDS scores with body composition in men with MS. Among women in the MS group, EDSS and PDDS scores were significantly correlated with lean mass in the leg (EDSS rs = −0.34, p = 0.04; PDDS rs = −0.35, p = 0.03).
There were no significant between group differences in any body composition variable when the sample was analyzed across sexes; however, differences between groups emerged when separate analyses were conducted for men and women (Table 2). Male participants with MS had significantly lower whole body lean mass (mean difference: 9933.5 ± 3123.1 g, p = 0.005) and significantly higher whole body fat mass (mean difference: 6079.0 ± 2137.4 g, p = 0.011) and %BF (mean difference: 9.4 ± 2.0%, p < 0.001) than non-MS counterparts. These differences appeared to be present in all three regional segments. Men with MS had significantly lower lean mass in the arm and leg (mean differences: 1843.5 ± 719.9 g, p = 0.02, 4892.9 ± 1138.3 g, p < 0.001, respectively), and significantly higher fat mass in the arm, leg, and trunk (mean differences: 662.0 ± 228.8 g, p = 0.01; 2112.8 ± 624.9 g, p = 003; 3350.4 ± 1426.6 g, p = 0.03, respectively). Percent body fat in all three regions was significantly higher in the male participant with MS (mean differences: arm 19.2 ± 4.7%, p = 0.001; leg: 22.2 ± 4.8%, p < 0.001; trunk: 9.6 ± 2.6%, p = 0.002) when compared to the controls. Although women with MS had similar patterns of differences as men (higher fat mass in whole body and all regions, as well as lower lean mass in the whole body, leg and trunk), none of these differences reached statistical significance.
Table 2.
Whole body and regional body composition.
| Males (n = 20) |
Females (n = 82) |
|||||
|---|---|---|---|---|---|---|
| MS | Control | Cohen's d | MS | Control | Cohen's d | |
| Whole Body | ||||||
| Total Mass, g | 73369.0 ± 11444.6 | 77698.2 ± 8159.4 | 0.44 | 72362.8 ± 171114.4 | 71467.5 ± 13791.9 | 0.01 |
| Lean Mass, g | 55339.7 ± 8673.8 | 65748.0 ± 5309.4** | 1.45 | 44692.4 ± 7449.0 | 45551.7 ± 6019.8 | 0.13 |
| Fat Mass, g | 18029.2 ± 4670.5 | 11950.3 ± 4885.8* | 1.27 | 27262.5 ± 11090.0 | 25915.9 ± 9454.7 | 0.13 |
| Percent Fat, % | 24.5 ± 4.3 | 15.1 ± 4.8** | 2.07 | 36.4 ± 7.7 | 35.3 ± 7.3 | 0.15 |
| Arm | ||||||
| Total Mass, g | 9153.4 ± 1782.4 | 10334.9 ± 1762.7 | 0.67 | 7944.1 ± 2013.7 | 7568.2 ± 1661.0 | 0.20 |
| Lean Mass, g | 7084.1 ± 1617.3 | 8927.6 ± 1602.1** | 1.15 | 4727.1 ± 1062.9 | 4495.0 ± 848.1 | 0.24 |
| Fat Mass, g | 2069.3 ± 556.8 | 1407.3 ± 462.0** | 1.29 | 3370.5 ± 1511.6 | 3073.1 ± 1122.9 | 0.22 |
| Percent Fat, % | 23.2 ± 6.2 | 13.6 ± 4.1** | 1.83 | 40.2 ± 9.8 | 39.7 ± 8.4 | 0.05 |
| Leg | ||||||
| Total Mass, g | 24155.4 ± 3569.3 | 26935.5 ± 1999.6* | 0.96 | 24917.5 ± 5822.9 | 25398.9 ± 4326.1 | 0.09 |
| Lean Mass, g | 17828.7 ± 3282.3 | 22721.6 ± 1478.0** | 1.92 | 14552.8 ± 2924.8 | 15060.3 ± 2359.5 | 0.19 |
| Fat Mass, g | 6326.8 ± 1166.3 | 4213.9 ± 1595.0** | 1.51 | 10751.9 ± 4154.2 | 10338.6 ± 2988.8 | 0.11 |
| Percent Fat, % | 26.6 ± 5.6 | 15.5 ± 5.1** | 2.09 | 41.7 ± 7.9 | 40.2 ± 7.1 | 0.21 |
| Trunk | ||||||
| Total Mass, g | 35288.7 ± 6224.5 | 35320.3 ± 5829.1 | 0.01 | 34497.6 ± 9378.9 | 34130.9 ± 8195.1 | 0.04 |
| Lean Mass, g | 26624.7 ± 3839.4 | 30006.8 ± 3401.6 | 0.93 | 22253.2 ± 3750.8 | 22504.4 ± 2997.7 | 0.07 |
| Fat Mass, g | 8664.0 ± 3256.3 | 5313.5 ± 3122.1* | 1.05 | 12244.4 ± 6337.2 | 11626.6 ± 5823.0 | 0.10 |
| Percent Fat, % | 24.0 ± 5.6 | 14.3 ± 6.0** | 1.66 | 33.4 ± 9.7 | 32.2 ± 9.3 | 0.12 |
Note: Data reported as mean ± SD. MS, multiple sclerosis.
The mean difference is significant at the 0.05 level.
The mean difference is significant at the 0.01 level.
Discussion
The purpose of this study was to explore whole body and regional body composition in a sample of adults with MS compared to non-MS controls matched for sex and BMI. When analyzed as a total sample, our findings reflected those of previous authors who noted no differences in body composition. The differences seen in total and regional body composition between female participants with and without MS in this sample did not reach statistical significance, yet a novel result was that male participants demonstrated significant and large differences in all measures of body composition except lean tissue within the trunk when comparing MS and non-MS participants matched on BMI.
Male participants with MS had increased whole body fat mass, and increased fat mass in the arm, leg, and trunk regions, and all differences had a large effect size. These results should be considered preliminary given the small number of men included in the study, but may have implications for our understanding of cardiometabolic risk development in men with MS. Central adiposity, and specifically visceral adipose tissue, is associated with cardiometabolic risks including insulin resistance. Oliveira33 reported increased insulin resistance among a group of participants with MS compared to non-MS controls, despite similar BMIs. Additionally, within the MS group, those with insulin resistance had higher EDSS scores than those who were not insulin resistant. These findings highlight an interesting potential impact of obesity and cardiometabolic health on physical function and disability in MS. More research is needed to understand if our findings in men with MS hold true in larger samples, and to explore more specific adipose tissue deposition within the abdominal region.
Our finding of reduced appendicular lean mass in men confirms previous research that indicated reduced muscle mass in adults with MS. Ward20 reported less lower-extremity muscle mass in women with MS compared to control participants without MS, and this reduced mass was associated with lower physical function. Wens22 reported similar results in a sample of males and females, noting reduced muscle mass and quadriceps strength in participants with MS compared to matched controls. Reduced appendicular lean mass may be an indication of a higher rate of sarcopenia in adults with MS than in the general population. Bove34 noted that age-related BMI increases typical of the general population were not seen in a sample of adults with MS followed longitudinally, suggesting that there may be an overly pronounced muscle wasting in MS. People with MS often have neurological dysfunction as a result of demyelination and axonal loss of the central nervous system.35-37 Such dysfunction includes decreased balance and coordination that can lead to impaired mobility and higher risk of fall,38-41 which makes performance of physical activity and daily tasks challenging in this population. If sarcopenia occurs in MS at an advanced rate of that typically seen in the general population, this may compound the effects of these balance and coordination impairments, and may lead to poorer health outcomes as a result of falls. More longitudinal research is needed to determine if the lower muscle mass described in cross-sectional studies of MS reflects a differential rate of deterioration overtime, which could indicate a sarcopenic process.
There were no differences in body composition based on type of MS or duration since diagnosis in this sample. Additionally, lean mass of the leg in female participants with MS was the only measure of body composition correlated with PDDS or EDSS scores. These findings may be influenced by the inclusion criteria of the studies from which this dataset was derived. All participants had to be ambulatory with or without assistance, and have no contraindications for exercise. Expanding this study to participants with more severe impairment and symptoms may reveal relationships among MS duration, symptoms and body composition.
Identifying factors that contribute to comorbid conditions and impaired physical function is critical for designing effective interventions that can help maximize health and enhance quality of life of people with MS. Body composition is one such factor that can be targeted through large-scale non-invasive interventions. There are a number of dietary and exercise interventions that have been shown to be effective for selective depletion of high-risk adipose deposits and building muscle mass in the general population, but more work is needed to effectively translate these interventions for use in MS. Specifically, a convincing body of evidence supports the hypothesis that exercise training can increase muscle mass, improve strength, and decrease whole body fat mass in samples with MS, but evidence for the depletion of regional fat mass in this group is lacking. Similarly, dietary intervention for MS is an emerging area of research. Current recommendations for adults with MS typically follow guidelines developed for the general population, but given the alterations in body composition found in this study and others, these recommendations may not be adequate for men with MS. More research is needed to develop specific dietary interventions to target body composition in the MS population.
Study limitations
There are limitations of this study that should be noted. This study included a secondary data analysis of body composition of men and women with MS compared to control participants without MS matched on sex and BMI. The initial data set included a sizable sample, but only 102 individuals could be matched on these criteria. This made the resulting sample for this analysis small, particularly for the male participants; however, the strict matching protocol used was critical for beginning to understand small but potentially important differences between the study groups when body size was comparable. Effect sizes between female groups were small, indicating the sample size may not have been adequate for detecting statistically significant differences in this group. More research is needed to determine if similar results are seen in a larger sample.
Additionally, data were not available on physical activity, physical function, and co-morbidities for the entire sample. Whereas this study can highlight differences in the variables included, it is not known if the differences in body composition seen in this sample were associated with physical activity levels, specific physical function impairments, or co-morbid conditions. It is widely acknowledged, however, that individuals with MS have elevated risks of musculoskeletal and cardiometabolic diseases, and the current analysis may highlight potential underpinning explanations for these risks. More research is also needed to explore the role of physical activity, sedentary behavior, and cardiorespiratory fitness, which are co-variates that may contribute to the increased risk of disease among persons with MS independent of body composition.
Finally, the current study relied on DXA for assessment of body composition. While DXA is a valid and reliable method for assessment of lean vs. fat mass, it is not able to assess more detailed aspects of body composition. Research in other populations points to the impact of specific adipose depots including visceral adipose tissue, intermuscular adipose tissue, and hepatic fat stores as key to the development of multiple cardiometabolic abnormalities. Additional analysis of these fat stores using more advanced methods such as magnetic resonance imaging (MRI) may provide additional understanding of the impact of body composition on comorbidities in MS, as well as potential targets for dietary and exercise interventions.
Conclusions
Our results indicated a difference in total body fat and lean mass, as well as fat and lean mass of the arm, leg, and trunk in men with MS compared to BMI-matched controls without MS. Given the results of this study, along with previous reports of body composition differences in women with MS, additional research is warranted to further explore differences in body composition, adipose tissue distribution, and the impact of these differences on the health and function of adults with MS.
Funding
The authors have no financial or proprietary interest in any material or method mentioned.
Abbreviations
- MS
Multiple Sclerosis
- BMI
Body Mass Index
- DXA
Dual-energy X-ray Absorptiometry
- MRI
Magnetic Resonance Imaging
- PDDS
Patient Determined Disease Steps
- EDSS
Expanded Disability Status Scale
Footnotes
Conflicts of interest
The authors report no conflicts of interest.
References
- 1.Hadgkiss EJ, Jelinek GA, Weiland TJ, Pereira NG, Marck CH, van der Meer DM. The association of diet with quality of life, disability, and relapse rate in an international sample of people with multiple sclerosis. Nutr Neurosci. 2015; 18(3): 125–136. [DOI] [PMC free article] [PubMed] [Google Scholar]
- 2.Jelinek GA, De Livera AM, Marck CH, et al. Lifestyle, medication and socio-demographic determinants of mental and physical health-related quality of life in people with multiple sclerosis. BMC Neurol. 2016;16(1):235. [DOI] [PMC free article] [PubMed] [Google Scholar]
- 3.Jelinek GA, De Livera AM, Marck CH, et al. Associations of lifestyle, medication, and socio-demographic factors with disability in people with multiple sclerosis: an international cross-sectional study. PloS one. 2016;ll(8):e0161701. [DOI] [PMC free article] [PubMed] [Google Scholar]
- 4.Marck CH, Neate SL, Taylor KL, Weiland TJ, Jelinek GA. Prevalence of comorbidities, overweight and obesity in an international sample of people with multiple sclerosis and associations with modifiable lifestyle factors. PloS one. 2016;1l(2):e0148573. [DOI] [PMC free article] [PubMed] [Google Scholar]
- 5.Garrow JS, Webster J. Quetelet's index (W/H2) as a measure of fatness. Int J Obes. 1984:9(2):147–153. [PubMed] [Google Scholar]
- 6.Ryan DH, Yockey SR. Weight loss and improvement in comorbidity: differences at 5%, 10%, 15%, and over. Curr Obes Rep. 2017. [DOI] [PMC free article] [PubMed] [Google Scholar]
- 7.Messier SP, Loeser RF, Miller GD, et al. Exercise and dietary weight loss in overweight and obese older adults with knee osteoarthritis: the arthritis, diet, and activity promotion trial. Arthritis & Rheumat. 2004:50(5):1501–1510. [DOI] [PubMed] [Google Scholar]
- 8.Gutierrez-Salmeron M, Chocarro-Calvo A, Garcia-Martinez JM, de la Vieja A, Garcia-Jimenez C Epidemiological bases and molecular mechanisms linking obesity, diabetes, and cancer. Endocrinol Diabetes Nutr. 2017;64(2):109–117. [DOI] [PubMed] [Google Scholar]
- 9.Pereira-Miranda E, Costa PRF, Queiroz VAO, Pereira-Santos M, Santana MLP. Overweight and obesity associated with higher depression prevalence in adults: a systematic review and meta-analysis. J Am Coll Nutr. 2017;36(3):223–233. [DOI] [PubMed] [Google Scholar]
- 10.Wickham C, Cooper C, Margetts BM, Barker DJP. Muscle strength, activity, housing and the risk of falls in elderly people. Age Ageing. 1989;18(1):47–51. [DOI] [PubMed] [Google Scholar]
- 11.von Haehling S, Morley JE, Anker SD. An overview of sarcopenia: facts and numbers on prevalence and clinical impact. J Cachexia, Sarcopenia Muscle. 2010:1(2):129–133. [DOI] [PMC free article] [PubMed] [Google Scholar]
- 12.Sayer AA, Syddall HE, Martin HJ, Dennison EM, Anderson FH, Cooper C Falls, sarcopenia, and growth in early life: findings from the hertfordshire cohort study. Am J Epidemiol. 2006;164(7):665–671. [DOI] [PMC free article] [PubMed] [Google Scholar]
- 13.Gonzalez N, Moreno-Villegas Z, Gonzalez-Bris A, Egido J, Lorenzo O. Regulation of visceral and epicardial adipose tissue for preventing cardiovascular injuries associated to obesity and diabetes. Cardiovasc Diabetol. 2017:16(1):44. [DOI] [PMC free article] [PubMed] [Google Scholar]
- 14.Fox CS, Massaro JM, Hoffmann U, et al. Abdominal visceral and subcutaneous adipose tissue compartments: association with metabolic risk factors in the Framingham Heart Study. Circulation. 2007;116(l):39–48. [DOI] [PubMed] [Google Scholar]
- 15.Scott D, Seibel M, Cumming R, et al. Sarcopenic obesity and its temporal associations with changes in bone mineral density, incident falls, and fractures in older men: the concord health and ageing in men project. J bone Miner Res Off J Am Soc Bone Miner Res. 2017;32(3):575–583. [DOI] [PubMed] [Google Scholar]
- 16.Takahashi T, Sugie M, Nara M, et al. Femoral muscle mass relates to physical frailty components in community-dwelling older people. Geriatrics Gerontol Int. 2017. [DOI] [PubMed] [Google Scholar]
- 17.Feinstein A Multiple sclerosis and depression. Multiple Scler J. 2011:17(11):1276–1281. [DOI] [PubMed] [Google Scholar]
- 18.Bazelier MT, van Staa T, Uitdehaag BMJ, et al. The risk of fracture in patients with multiple sclerosis: the UK general practice research. J Bone Miner Res. 2011;26(9):2271–2279. [DOI] [PMC free article] [PubMed] [Google Scholar]
- 19.Pilutti LA, Motl RW. Body mass index underestimates adiposity in persons with multiple sclerosis. Archiv Phys Med Rehab. 2016;97(3):405–412. [DOI] [PubMed] [Google Scholar]
- 20.Ward CL, Suh Y, Lane AD, et al. Body composition and physical function in women with multiple sclerosis. J Rehab Res Dev. 2013;50(8):1139–1147. [DOI] [PubMed] [Google Scholar]
- 21.Sioka C, Fotopoulos A, Georgiou A, et al. Body composition in ambulatory patients with multiple sclerosis. J Clin Densitom Off J Int Soc Clin Densitom. 2011;14(4):465–470. [DOI] [PubMed] [Google Scholar]
- 22.Wens I, Dalgas U, Vandenabeele F, Krekels M, Grevendonk L, Eijnde BO. Multiple sclerosis affects skeletal muscle characteristics. PloS one. 2014;9(9):e108158. [DOI] [PMC free article] [PubMed] [Google Scholar]
- 23.Pilutti LA, Dlugonski D, Sandroff BM, Klaren RE, Motl RW. Internet-delivered lifestyle physical activity intervention improves body composition in multiple sclerosis: preliminary evidence from a randomized controlled trial. Archiv Phys Med Rehab. 2014;95(7):1283–1288. [DOI] [PubMed] [Google Scholar]
- 24.Snook EM, Mojtahedi MC, Evans EM, McAuley E, Motl RW. Physical activity and body composition among ambulatory individuals with multiple sclerosis. Int J MS Care. 2005;7(4):137–142. [Google Scholar]
- 25.Mojtahedi MC, Snook EM, Motl RW, Evans EM. Bone health in ambulatory individuals with multiple sclerosis: impact of physical activity, glucocorticoid use, and body composition. J Rehab Res Dev. 2008;45(6):851–861. [DOI] [PubMed] [Google Scholar]
- 26.Shephard R PAR-Q. Canadian home fitness test and exercise screening alternatives. Sports Med. 1988;5(3):185–195. [DOI] [PubMed] [Google Scholar]
- 27.Thomas S, Reading J, Shephard R. Revision of the physical-activity readiness questionnaire (PAR-Q). Can J Sport Sci. 1992;17:338–345. [PubMed] [Google Scholar]
- 28.Kurtzke JF. Rating neurologic impairment in multiple sclerosis an expanded disability status scale (EDSS). Neurology. 1983:33. [DOI] [PubMed] [Google Scholar]
- 29.Hohol M, Orav E, Weiner H. Disease Steps in multiple sclerosis: a simple approach to evaluate disease progression. Neurology. 1995;45(2):251–255. [DOI] [PubMed] [Google Scholar]
- 30.Learmonth YC, Motl RW, Sandroff BM, Pula JH, Cadavid D. Validation of patient determined disease steps (PDDS) scale scores in persons with multiple sclerosis. BMC Neurol. 2013;13(1):37. [DOI] [PMC free article] [PubMed] [Google Scholar]
- 31.Hohol MJ, Orav EJ, Weiner HL. Disease steps in multiple sclerosis: a longitudinal study comparing Disease Steps and EDSS to evaluate disease progression. Mult Scler. 1999:5. [DOI] [PubMed] [Google Scholar]
- 32.Cohen J Statistical Power Analysis for the Behavioral Sciences, second ed. Mahwah, NJ: Lawrence Erlbaum Associates; 1988. [Google Scholar]
- 33.Oliveira SR, Simao AN, Kallaur AP, et al. Disability in patients with multiple sclerosis: influence of insulin resistance, adiposity, and oxidative stress. Nutr (Burbank Los Angel Cty Calif. 2014;30(3):268–273. [DOI] [PubMed] [Google Scholar]
- 34.Bove R, Musallam A, Xia Z, et al. Longitudinal BMI trajectories in multiple sclerosis: sex differences in association with disease severity. Multiple Scler Relat Disord. 2016;8:136–140. [DOI] [PubMed] [Google Scholar]
- 35.Compston A, Coles A. Multiple sclerosis. Lancet.372(9648):1502–1517. [DOI] [PubMed] [Google Scholar]
- 36.Huisinga JM, Yentes JM, Filipi ML, Stergiou N. Postural control strategy during standing is altered in patients with multiple sclerosis. Neurosci Lett. 2012:524(2):124–128. [DOI] [PubMed] [Google Scholar]
- 37.Salgado R, Paula Vasconcelos LA. The use of dance in the rehabilitation of a patient with multiple sclerosis. Am J Dance Ther. 2010;32(1):53–63. [Google Scholar]
- 38.Compston A, Coles A. Multiple sclerosis. Lancet. 2008;372(9648):1502–1517. [DOI] [PubMed] [Google Scholar]
- 39.White LJ, Dressendorfer RH. Exercise and multiple sclerosis. Sports Med. 2004;34(15):1077–1100. [DOI] [PubMed] [Google Scholar]
- 40.Finlayson ML, Peterson EW, Cho CC. Risk factors for falling among people aged 45 to 90 Years with multiple sclerosis. Archiv Phys Med Rehab.87(9):1274–1279. [DOI] [PubMed] [Google Scholar]
- 41.Matsuda PN, Shumway-Cook A, Bamer AM, Johnson SL, Amtmann D, Kraft GH. Falls in multiple sclerosis. PM&R.3(7):624–632. [DOI] [PubMed] [Google Scholar]