Abstract
With the ability to convert external excitation into heat, nanomaterials play an essential role in many biomedical applications. Two modes of nanoparticle (NP) array heating, nanoscale-confined heating (NCH) and macroscale-collective heating (MCH), have been found and extensively studied. Despite this, the resulting biological response at the protein level remains elusive. In this study, we developed a computational model to systematically investigate the single-pulsed heating of the NP array and corresponding protein denaturation/activation. We found that NCH may lead to targeted protein denaturation, however, nanoparticle heating does not lead to nanoscale selective TRPV1 channel activation. The excitation duration and NP concentration are primary factors that determine a window for targeted protein denaturation, and together with heating power, we defined quantified boundaries for targeted protein denaturation. Our results boost our understandings of the NCH and MCH under realistic physical constraints and provide robust guidance to customize biomedical platforms with desired NP heating.
This study focuses on the effect of single pulse heating of nanoparticle array on biological activity. The analysis demonstrates that nanoscale-confined heating may lead to targeted protein denaturation, whereas it does not give targeted activation of the thermally-sensitive TRPV1 channel.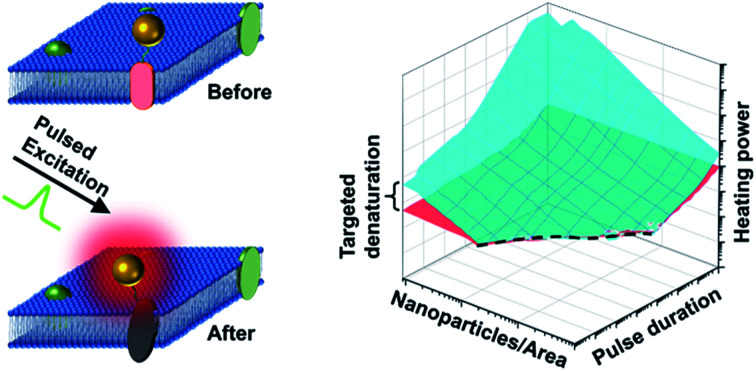
1. Introduction
Nanomaterials can be designed to efficiently absorb optical or magnetic energy and convert that energy to heat.1–3 This heat-generating property has found applications in cancer treatment,4–9 drug delivery,10,11 contrast imaging,12–15 vision restoration,16 pain,17 and neuromodulation18–23 (Fig. S1†). While these advances have pushed the boundaries of biomedicine, there has been a fair amount of debate over the past few years in understanding the effect of heating in biological systems, such as in the area of magnetogenetics on whether magnetothermal heating of ferritin nanoparticles can generate sufficient heat to activate thermally-sensitive ion channels.22–26 Scaling analysis suggests that the heat generated by ferritin is 9–10 order of magnitude less than that threshold to activate TRPV1 ion channels27 and recent reports suggest a biochemical pathway involving reactive oxygen species (ROS) that activates both TRPV1 and TRPV4 ion channels.26,28 This highlights the importance of understanding nanoscale heating and its impact on biological systems, especially proteins.
Heating generated by nanomaterials broadly falls into one of two regimes: nanoscale-confined heating (NCH) and macroscale-collective heating (MCH). NCH is characterized by local temperature increases at the nanoscale which remain confined near the surface of the nanoparticle, as in the case of controlling protein activity by molecular hyperthermia,16,17,29 or modulating membrane permeability by opto-poration.17,20,29,30 In contrast, MCH is characterized by a widespread temperature increase throughout the medium, i.e. whole cells or tissues. MCH can be used to injure cancer cells,5 excite thermally-sensitive neurons expressing transient receptor potential (TRP) channels,16 and regulate cellular function.31 Keblinski et al. highlighted the role of the duration of energy excitation in controlling the transition between NCH and MCH,32 demonstrating that short energy pulses could lead to NCH while MCH can arise from continuous excitation. Similarly, Baffou et al. systemically investigated the boundary and transition between temperature confinement regime (or NCH) and temperature delocalization regime (or MCH) under continuous excitation and repeated femtosecond-pulsed excitations, respectively.33,34 Xie et al. extended the research to transient process of NP array heating and shed light on how excitation duration and NP concentration affect heating modes with dimensionless parameters.35 Furthermore, methods for generating arbitrary microscale temperature profiles have been explored using NPs and spatial light modulation.36 While these efforts advanced our understanding of the spatiotemporal evolution of nanoparticle heating, there is an important gap in understanding how single pulsed NP heating affects biological systems through protein denaturation (by hyperthermia5 or molecular hyperthermia17) or activation (for example thermally sensitive ion channels TRPV1).16
In this report, we investigated the heating of NP arrays under single pulse excitation and the resulting protein responses, including protein thermal denaturation and activation of thermally-sensitive ion channels. Our analysis suggests that the excitation duration and NP area density determine a window for heterogeneous protein denaturation, where targeted denaturation is possible. Together with heating power, we defined boundaries for targeted protein denaturation inside this heterogeneous denaturation window. For activation of thermally sensitive ion channel TRPV1, we determined that the nanoparticle array heating leads to widespread channel activation instead of localized activation because heat dissipates and leads to MCH within milliseconds, a timescale required to activate the ion channel based on our current understanding.37 This work guides designing innovative approaches that utilize NCH and MCH for modulating molecular or tissue-specific activities under realistic physical constraints.
2. Results and discussions
2.1. NP array heating characteristics and corresponding protein denaturation
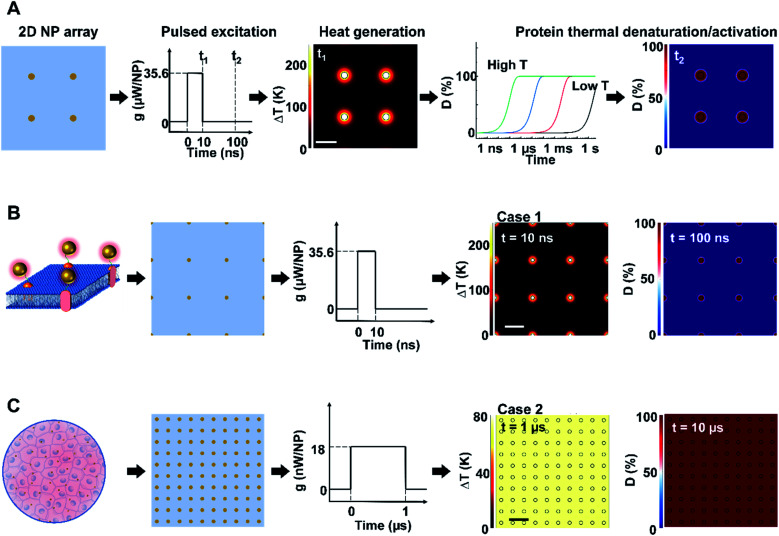
We first constructed and validated the modeling framework for NP array heating and protein thermal denaturation (Fig. 1A). For our model systems, we used 10 μm × 10 μm 2D square arrays composed of 30 nm gold nanoparticles (AuNP) immersed in water, which were designed to mimic NPs that are targeted to a cell membrane. The NP array heating was acquired by a superposition method (eqn S(1)).† Our results suggest that different NP materials with the same heat generation will have a similar heating profile in water (Fig. S2A†), which is the main target for analyzing heating in biological tissues. Therefore, we used heating power per NP (g) that is independent of NP absorption properties to represent the heat generation of NPs by different methods, such as laser or magnetic field (Fig. S1†). This heating model was used throughout the remaining of the paper.
Fig. 1. Analysis framework for nanoparticle heating-induced protein denaturation and characteristics of protein denaturation under nanoscale-confined heating (NCH) and macroscale-collective heating (MCH). (A) Schematic of the analysis framework for nanoparticle (NP) array heating and the resulting protein denaturation (D) or activation. External excitation of the NP array (each NP as a nano heater) heats up the NP and the surrounding media. The temperature increase drives a chemical reaction (protein denaturation or activation), which can be described by first-order kinetic model (the Arrhenius model). Integration of the reaction rate over time leads to an overall protein denaturation or activation. (B and C) Nanoscale confined heating (NCH) and macroscale collective heating (MCH), and the corresponding temperature increase and protein denaturation. Conditions: domain size 10 μm × 10 μm, NP diameter (dNP) = 30 nm, heating power per NP (g) is (B) 35.6 μW and (C) 18 nW, NP area density is (B) 9 μm−2 and (C) 100 μm−2, and excitation duration is (B) 10 ns and (C) 1 μs.
Heating can trigger a series of biological responses, including protein denaturation in the case of cancer thermal therapy,6,21 and activation of temperature-sensitive TRPV1 channels that modulate neuron activity.16,38 Recently, Kang et al. showed the possibility of nanoscale selective protein denaturation with AuNP targeting and nanosecond pulsed laser excitation.17 To connect NP heating to the protein denaturation, we first analyzed protein denaturation using α-chymotrypsin since its denaturation properties have been measured in both NCH and MCH.20,39 Protein thermal denaturation can be modeled as a temperature-sensitive chemical reaction (eqn S(3),†Fig. 1A), and the normalized concentration of the denatured protein (D) is determined by the reaction rate and reaction duration (eqn (S4)).† Since temperature profile and protein denaturation are all time-dependent, we consider the end of excitation duration as the representative time point (t) for temperature change (ΔT) analysis and the time after the laser pulse (10× excitation duration) as the representative time point for protein denaturation analysis. Similarly, we further consider the NP–water interface (P1) and the mid-point between NPs (P2) as two representative locations for ΔT and denaturation analysis (Fig. S2B†). We will use P1 and P2 to indicate these locations, along with ΔT1, ΔT2, and D1, D2 to indicate temperature increase (ΔT) and normalized protein denaturation (D) at P1 and P2 respectively. These representative time points and locations are used throughout the paper. With this framework, we examined the characteristics of nanoscale-confined heating (NCH) and macroscale-collective heating (MCH) and connected them to corresponding protein denaturation. The thermal activation of TRPV1 was analyzed using a similar framework and presented in later sections. Fig. 1B shows that NCH was observed under short excitation duration (10 ns) and low NP area density (9 μm−2), where heating is confined to the nanoparticle surface (Fig. S3A and B†). As a result, targeted protein denaturation is established where the protein denaturation was confined to the vicinity of the NPs (Fig. 1B and S3A, B†). By increasing the heating duration to 1 μs and the NP area density to 100 μm−2 (Fig. 1C), the heating fully dissipates and leads to MCH where the temperature increased uniformly. In this case, widespread protein denaturation was observed. Together, these two cases demonstrate the major hallmarks of NCH and MCH and the resulting targeted versus widespread protein denaturation.
2.2. Key factors that affect the NP array heating modes and protein denaturation
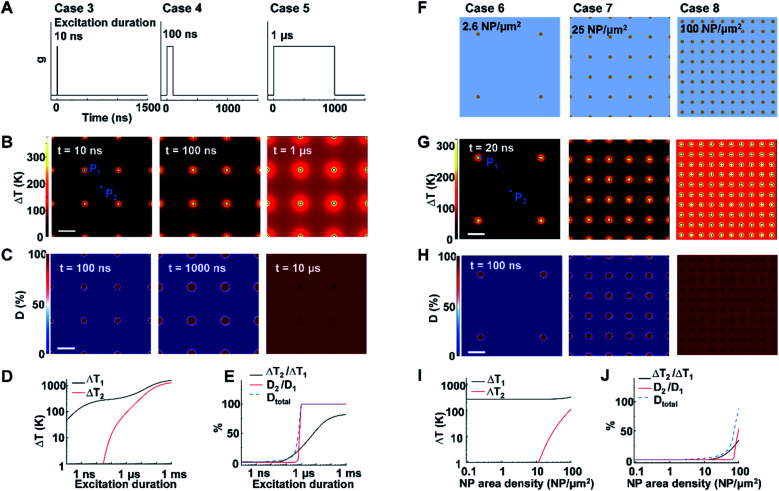
Next, we identified the key factors that impact the transition from NCH to MCH and from targeted to widespread protein denaturation. We first investigated the role of excitation duration by comparing the thermal responses and corresponding protein denaturation of an NP array (area density of 9 μm−2) at three distinctive excitation duration (Fig. 2A; case 3: 10 ns, case 4: 100 ns, and case 5: 1 μs; all under same heating power (g = 35.6 μW); summary of all cases in Table S3†). Here we adopt ΔT2/ΔT1 and D2/D1 to characterize the temperature change and denaturation profile. High ΔT2/ΔT1 and D2/D1 indicate uniform ΔT and denaturation profiles, while low ΔT2/ΔT1 and D2/D1 indicate heterogeneous profiles. Fig. 2B and D illustrates the ΔT profiles and protein denaturation for these cases. For case 3 (10 ns), heating was confined and ΔT2 remained constant (Fig. 2B and D), which resulted in low ΔT2/ΔT1 (Fig. 2E); while for cases 4 and 5 (100 ns and 1 μs), ΔT2 increases significantly, leading to an increase of ΔT2/ΔT1. Cases 3 & 4 (10 and 100 ns excitation) resulted in targeted denaturation with low Dtotal (1.6% and 4.8% respectively, eqn S(5))† and D2/D1 (∼0%). In contrast, case 5 (1 μs) exhibited widespread protein denaturation (Dtotal = 99%, D2/D1 = 100%). In this scenario, we observed a sharp increase in ΔT2/ΔT1, D2/D1, and Dtotal when the excitation duration increases (case 5, Fig. 2E). Therefore, the excitation duration is considered as a key factor in both transitions (i.e., from NCH to MCH and from targeted to widespread denaturation).
Fig. 2. Effects of excitation duration and NP area density on the heating and protein denaturation. (A) Schematic of excitation durations for case 3–5. (B) ΔT profile and (C) protein denaturation (D) profile for cases 3–5. For case 3–5, NP area density is at 9 μm−2. P1 represents the NP–water interface, P2 represents mid-point between NPs. (D) ΔT at P1 (ΔT1) and ΔT at P2 (ΔT2) as a function of excitation duration. (E) Ratio between ΔT2 and ΔT1 (ΔT2/ΔT1), ratio between protein denaturation at P2 and P1 (D2/D1), Dtotal in terms of excitation duration. (F) Schematic of NP area density for cases 6–8 at 2.6 μm−2, 25 μm−2, and 100 μm−2, respectively. (G) ΔT profile and (H) D profile for cases 6–8. For cases 6–8, excitation duration 20 ns. (I) ΔT1 and ΔT2 in terms of NP area density. (J) ΔT2/ΔT1, D2/D1 and Dtotal in terms of NP area density. For all cases, g = 35.6 μW and scalebar represents 200 nm.
When targeting and manipulating protein receptors on the cell surface, the NP area density depends on the receptor density. For example, metabotropic glutamate receptors (mGluRs) have an area density of 2–51 μm−2,2,13 requiring a similar NP area density on the cell surface for effective targeting. To evaluate the role of NP area density, we compared thermal responses and protein denaturation under three different NP arrays with distinct NP area densities (Fig. 2F; case 6, 2.6 μm−2; case 7, 25 μm−2; case 8, 100 μm−2; all under identical excitation condition: excitation duration 20 ns, g = 35.6 μW). Fig. 2G and H shows that, at low and medium area densities (2.6 μm−2 and 25 μm−2), NCH and targeted protein denaturation is observed. In contrast, at high area density (100 μm−2), heating generated by adjacent NPs are overlapped, resulting in MCH (ΔT2/ΔT1 = 34.2%) and widespread denaturation (Dtotal = 100%, D2/D1 = 100%). Based on this analysis, we consider the NP area density as another key factor in both transitions.
The spatial distribution of NPs on the cell membrane is dependent on the distribution of target receptors, which can be randomly distributed.14,40 To evaluate the role of NP distribution, we examined thermal responses and protein denaturation for three different NP arrays with identical area density (9 μm−2) distributed in a square (case 9), hexagonal (case 10), and random (case 11) lattice (Fig. S4A†). When subjected to a 20 ns excitation at 35.6 μW/NP, all of the NP arrays exhibited NCH and targeted protein denaturation (Fig. S4B and C†). However, a close examination revealed that random distribution causes local temperature hot spots at the regions with NP aggregations (Fig. S4 and S5†). This agrees with previous reports which showed that local temperature can be much higher around NP clusters.41,42 It is worth pointing out that Dtotal of all three cases are similar due to the few local hot spots, making the NP distribution less significant for protein denaturation.
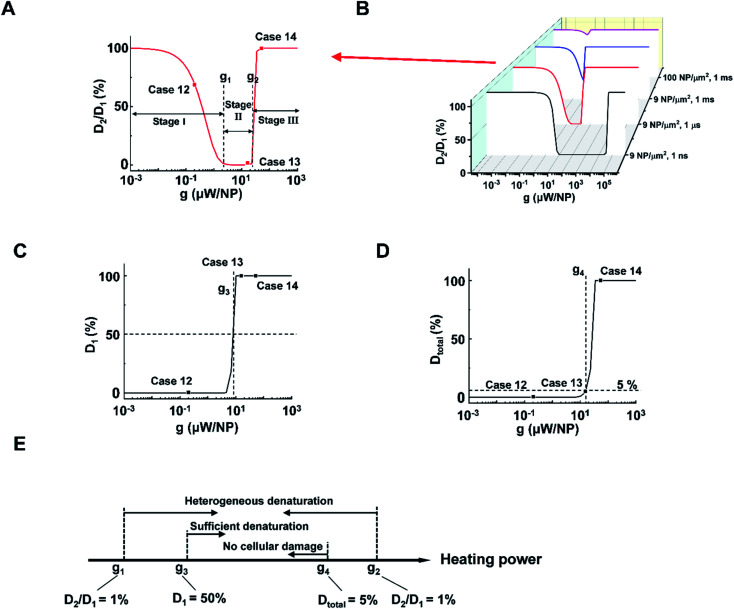
Next, we analyzed the effect of heating power (g) on the protein denaturation. ΔT increased linearly with g (Tables S1 and 2†), resulting in a similar ΔT profile with a different magnitude. On the other hand, the corresponding denaturation increased nonlinearly as per the Arrhenius equation (eqn S(3)).† Here we compared cases under different heating powers with identical excitation duration (1 μs) and NP area density (9 μm−2). We identified three stages (I–III) of protein denaturation based on how D2/D1 changes with the g. Fig. 3A and S6† show that in stage I (homogeneous intact stage, case 12 as an example), there is no significant protein denaturation throughout the system due to insufficient g (both D2 and D1 are small, leading to high D2/D1 ratio). In stage II, g is sufficient to generate a localized hot area and significant denaturation around NPs (case 13 as an example), with no significant heating or protein denaturation at P2 (D2 ∼ 0%). Therefore, a heterogeneous denaturation profile was observed with a small D2/D1 ratio (<1%). In stage III (case 14 as an example), g is sufficient to heat up the whole system and denature all proteins regardless of position, leading to homogeneous denaturation. We thus define two critical heating powers, g1 and g2 at D2/D1 = 1% as boundaries for heterogeneous denaturation (Fig. 3A). It is worth noting that g1 and g2 are dependent on excitation duration and NP area density (Fig. 3B). Stage II vanishes at high NP area density and excitation duration (Fig. 3B, 100 μm−2, 1 ms), with a direct transition from no denaturation to widespread denaturation. This agrees with previous sections, where long excitation duration and high NP area density lead to MCH (high ΔT2/ΔT1). As such, there is no window for heterogeneous or targeted denaturation. To quantify the threshold for sufficient denaturation at P1, we further define a heating power g3 corresponding to D1 = 50% (Fig. 3C). Heating power that is much lower than g3 does not produce sufficient denaturation around NPs. Furthermore, studies have suggested a large total protein denaturation can lead to cellular damage (e.g. Dtotal = 5%).43 Therefore, we define critical heating power g4 corresponding to Dtotal = 5% (Fig. 3D) as a threshold for cellular damage. Fig. 3E summarizes the definitions for g1, g2, g3, and g4. It is notable that relations between g1, g2, g3, and g4 may change when altering excitation duration and NP area density.
Fig. 3. NP heating power determines a window for targeted denaturation. (A) D2/D1 in terms heating power (g) with a 1 μs excitation duration and a 9 NP μm−2 area density. Three major stages for protein denaturation as g increases: stage I, uniformly no denaturation zone with high D2/D1 (1–100%); stage II, targeted denaturation window with low D2/D1 (<1%); stage III, widespread denaturation with high D2/D1 (1–100%). g1 and g2 are critical heating powers that separate the three stages. (B) D2/D1 in terms of g with different combinations of excitation durations and NP area densities. (C) D1 in terms g with a 1 μs excitation duration and a 9 μm−2 area density. Here we define a critical heating power g3 that corresponds D1 = 50%. (D) Dtotal in terms g with a 1 μs excitation duration and a 9 μm−2 area density. We define a critical heating power g4 that corresponds Dtotal = 5%. (E) Schematic for g1, g2, g3, and g4.
With the above analysis, the targeted denaturation should meet three criteria simultaneously:
(1) A heterogeneous denaturation (g1 < heating power < g2);
(2) Sufficient denaturation at P1 (heating power > g3);
(3) Minimal Dtotal to avoid cellular damage (heating power < g4).
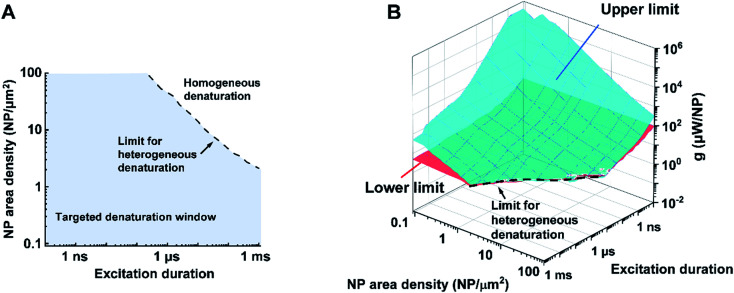
Bases on these criteria above, we analyzed a large combination of NP arrays and excitations by altering the excitation duration (0.1 ns to 1 ms), NP area densities (0.09–100 μm−2), and heating powers (10−3 to 109 μW). First, we generate a 3D map for the boundaries of heterogeneous denaturation. Fig. S7A† shows critical surfaces corresponding to g1 and g2, where the intersection (dotted line) indicates the absence of heterogeneous denaturation. Projecting this dotted line in a 2D plot (Fig. 4A) shows the limit for the heterogeneous denaturation window, where targeted denaturation is possible. Next, we investigated boundaries for the second and third criteria located in this window. Fig. S7B and C† show critical surfaces of g3 and g4 respectively, where targeted denaturation should be between surfaces of g3 and g4 to achieve sufficient denaturation while avoiding cellular damage. Lastly, we combined all the boundaries discussed above and generated a 3D map for targeted protein denaturation (Fig. 4B). A lower limit (maximum of g1 and g3) and an upper limit (minimum of g2 and g4) can be set, within which there is targeted denaturation. For example, our results suggest that NCH is established for the case of 10 ns excitation duration at 9 μm−2, and target denaturation can be achieved for a heating power within 14–81 μW. In contrast, for the case of 1 ms excitation duration at 100 μm−2, targeted denaturation does not exist regardless of the heating power since MCH is established. It should be emphasized that these results are based on α-chymotrypsin, while other proteins may have different thresholds. However, we anticipate a similar trend for other proteins when the Arrhenius model is applied. NCH can lead to novel applications in selectively manipulating protein activity by molecular hyperthermia,17,29 or membrane permeability,20,30 On the other hand, macroscale-collective heating results in uniform heating and widespread protein denaturation for applications such as cancer thermal therapy.4,5 Therefore, our analysis provides a framework and guideline to achieve targeted protein denaturation while avoiding widespread damage.
Fig. 4. Limits and window for targeted protein denaturation (A) projection of the limit for heterogeneous protein denaturation (dotted line), region below the line (blue area) demonstrated the window for heterogeneous protein denaturation and possible targeted denaturation provided with propriate heating power (shown in B). (B) Lower limit (red surface) and upper limit (blue surface) in terms of excitation duration and NP area density. Region between red surface and blue surface indicates window for targeted protein denaturation.
2.3. NP array heating leads to either no activation or widespread activation of TRPV1 channel
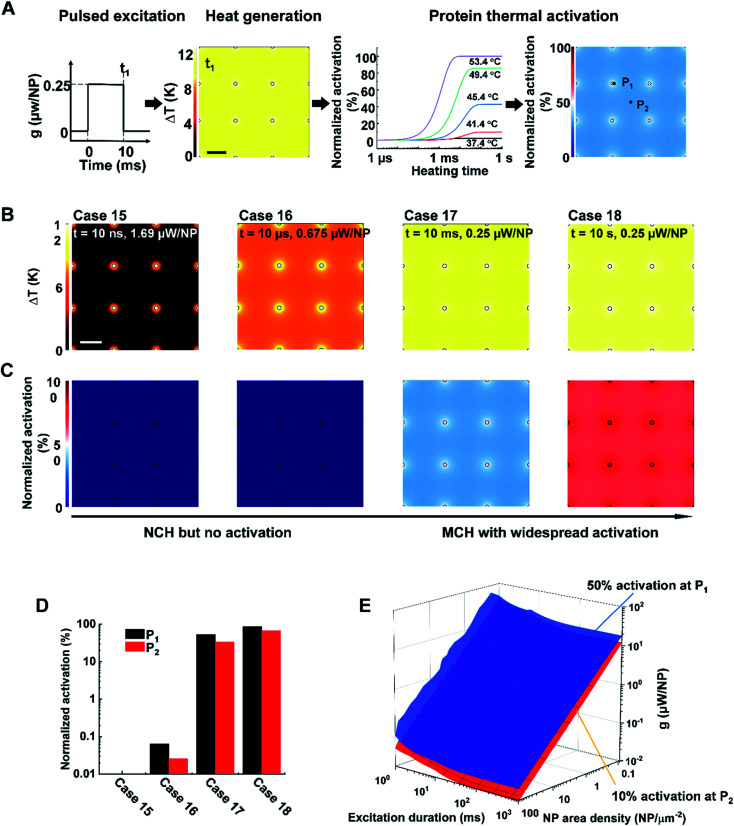
Lastly, we investigated whether NP array heating could selectively activate the TRPV1 channel. TPRV1 channel activation can be treated as a heat-activated chemical reaction described by a two-state model (eqn (S6)–(S9)).† Previous studies have demonstrated that the TRPV1 channel can be activated within milliseconds at temperatures ranging from 40–53 °C (Fig. 5A).37,44 Following the framework in Fig. 5A, we further investigated TRPV1 activation by NP array heating within 40–53 °C. It is notable that, considering the reversibility for the activation and deactivation of the TRPV1 channel,34 the representative time point for TRPV1 activation analysis is chosen at the end of the excitation duration. Fig. 5B and C illustrates the ΔT (TRPV1 normalized activation) profile for case 15–18, with the same NP area density at 9 μm−2 and different excitation durations and heating powers (g) at 10 ns and 1.69 μW, 10 μs and 0.675 μW, 10 ms and 0.25 μW, 10 s and 0.25 μW respectively. For case 15, NCH is observed due to the short excitation duration, but there is no TRPV1 activation. As excitation duration increases, MCH is established (case 16–18), resulting in widespread TRPV1 activation (case 17 and 18). Here we further quantified the TRPV1 activation by comparing the normalized activation at P1 and P2 for cases 15–18. Fig. 5D shows similar TRPV1 activation at P1 and P2 for each case, indicating either no TRPV1 activation or widespread TRPV1 activation. We further investigated a large number of conditions by altering excitation duration (1 ms to 1 s), NP area density (0.09–100 μm−2), and heating power (10−2 to 102 μW). Here we set a threshold of on-target TRPV1 activation (at P1) at 50%, and off-target TRPV1 activation (at P2) at 10% to detect any nonspecific excitation. Fig. 5E shows the threshold for on-target TRPV1 activation (blue surface) is always higher than off-target activation, indicating that on-target TRPV1 activation always comes with off-target activation. Thus, there is always widespread TRPV1 activation by NP array heating because of the mismatch between the short excitation durations (nanosecond timescale) required for NCH and the millisecond timescale needed for channel activation. It should be noted, however, that it is unclear if TRPV1 can be activated at faster rates above 53 °C. According to molecular dynamics simulations of the TRPV1 thermal-gating mechanism, channel opening was not observed within the 200 ns time frame of the simulations at temperatures of 60 and 72 °C, suggesting that TRPV1 activation may be unlikely to occur at nanosecond timescale.45
Fig. 5. Analysis of TRPV1 channel activation by NP array heating. (A) Schematic of the analysis framework for nanoparticle (NP) array heating and the resulting TRPV1 channel activation. External excitation of the NP array heats up the NP and the surrounding media. The temperature increase drives TRPV1 channel to open, which can be described by two-state model. NP area density: 9 NP μm−2, excitation duration: 10 ms, heating power: 0.675 μW/NP. (B) ΔT profile and (C) TRPV1 normalized activation profile for cases 15–18. NP area density is 9 NP μm−2. Excitation durations and power intensity are shown in the figure. Scalebar represents 200 nm. (D) TRPV1 normalized activation at P1 (NP–water interface) and P2 (mid-point between particles) for case 15–18. (E) Threshold for on-target TRPV1 activation (50%, at P1, blue surface) and off-target TRPV1 activation (10%, at P2, red surface).
3. Conclusion
In this study, we investigated how single pulse heating of nanoparticle array affects biological activity, specifically protein thermal denaturation and activation. We found that excitation duration and NP area density are primary factors that determine a window for targeted denaturation. Combined with heating power, we defined quantified boundaries for targeted protein denaturation inside the heterogeneous denaturation window. On the other hand, nanoscale selective activation of the thermally-sensitive ion channel TRPV1 is not feasible based on our current understanding of its millisecond activation kinetics, and nanoparticle array heating leads to widespread TRPV1 activation. This work clearly elucidates the physical limits of biological responses driven by NP heating.
Abbreviations
- NP
Nanoparticle
- TRPV1
Transient receptor potential cation channel subfamily V member 1
- NCH
Nanoscale-selective heating
- MCH
Macroscale-collective heating
- SLM
Spatial light modulation
- ROS
Reactive oxygen species
Conflicts of interest
All authors declare that they have no conflicts of interest.
Supplementary Material
Acknowledgments
The research reported in this work was partially supported by the National Institute of General Medical Sciences (NIGMS) of the National Institutes of Health (award number R35GM133653), the t2019 Collaborative Sciences Award from the American Heart Association (award number 19CSLOI34770004), and the High-Impact/High-Risk Research Award from the Cancer Prevention and Research Institute of Texas (award number RP180846). The content is the sole responsibility of the authors and does not necessarily represent the official views of the funding agencies.
Electronic supplementary information (ESI) available. See DOI: 10.1039/d1na00766a
References
- Park J. Huang J. Wang W. Murphy C. J. Cahill D. G. J. Phys. Chem. C. 2012;116:26335–26341. doi: 10.1021/jp308130d. [DOI] [Google Scholar]
- Qin Z. Bischof J. C. Chem. Soc. Rev. 2012;41:1191–1217. doi: 10.1039/C1CS15184C. [DOI] [PubMed] [Google Scholar]
- Deatsch A. E. Evans B. A. J. Magn. Magn. Mater. 2014;354:163–172. doi: 10.1016/j.jmmm.2013.11.006. [DOI] [Google Scholar]
- Hu C. M. Aryal S. Zhang L. Ther. Delivery. 2010;1:323–334. doi: 10.4155/tde.10.13. [DOI] [PubMed] [Google Scholar]
- Riley R. S. Day E. S. Wiley Interdiscip. Rev.: Nanomed. Nanobiotechnol. 2017;9:e1449. doi: 10.1002/wnan.1449. [DOI] [PMC free article] [PubMed] [Google Scholar]
- Dickerson E. B. Dreaden E. C. Huang X. El-Sayed I. H. Chu H. Pushpanketh S. McDonald J. F. El-Sayed M. A. Cancer Lett. 2008;269:57–66. doi: 10.1016/j.canlet.2008.04.026. [DOI] [PMC free article] [PubMed] [Google Scholar]
- Wang S. Huang P. Nie L. Xing R. Liu D. Wang Z. Lin J. Chen S. Niu G. Lu G. Adv. Mater. 2013;25:3055–3061. doi: 10.1002/adma.201204623. [DOI] [PMC free article] [PubMed] [Google Scholar]
- Huang H. S. Hainfeld J. F. Int. J. Nanomed. 2013;8:2521. doi: 10.2147/IJN.S43770. [DOI] [PMC free article] [PubMed] [Google Scholar]
- Abadeer N. S. Murphy C. J. J. Phys. Chem. C. 2016;120:4691–4716. doi: 10.1021/acs.jpcc.5b11232. [DOI] [Google Scholar]
- Singh R. Lillard Jr J. W. Exp. Mol. Pathol. 2009;86:215–223. doi: 10.1016/j.yexmp.2008.12.004. [DOI] [PMC free article] [PubMed] [Google Scholar]
- Goodman A. M. Hogan N. J. Gottheim S. Li C. Clare S. E. Halas N. J. ACS Nano. 2017;11:171–179. doi: 10.1021/acsnano.6b06510. [DOI] [PubMed] [Google Scholar]
- Boyer D. Tamarat P. Maali A. Lounis B. Orrit M. Science. 2002;297:1160–1163. doi: 10.1126/science.1073765. [DOI] [PubMed] [Google Scholar]
- Jakobsohn K. Motiei M. Sinvani M. Popovtzer R. Int. J. Nanomed. 2012;7:4707. doi: 10.2147/IJN.S34157. [DOI] [PMC free article] [PubMed] [Google Scholar]
- Fraire J. C. Masseroni M. L. Jausoro I. Perassi E. M. Diaz Anel A. M. Coronado E. A. ACS Nano. 2014;8:8942–8958. doi: 10.1021/nn501575c. [DOI] [PubMed] [Google Scholar]
- Park Y. I. Kim J. H. Lee K. T. Jeon K. S. Na H. B. Yu J. H. Kim H. M. Lee N. Choi S. H. Baik S. I. Adv. Mater. 2009;21:4467–4471. doi: 10.1002/adma.200901356. [DOI] [Google Scholar]
- Nelidova D. Morikawa R. K. Cowan C. S. Raics Z. Goldblum D. Scholl H. P. Szikra T. Szabo A. Hillier D. Roska B. Science. 2020;368:1108–1113. doi: 10.1126/science.aaz5887. [DOI] [PubMed] [Google Scholar]
- Kang P. Li X. Liu Y. Shiers S. I. Xiong H. Giannotta M. Dejana E. Price T. J. Randrianalisoa J. Nielsen S. O. ACS Nano. 2019;13:12487–12499. doi: 10.1021/acsnano.9b01993. [DOI] [PMC free article] [PubMed] [Google Scholar]
- Airan R. D. Meyer R. A. Ellens N. P. Rhodes K. R. Farahani K. Pomper M. G. Kadam S. D. Green J. J. Nano Lett. 2017;17:652–659. doi: 10.1021/acs.nanolett.6b03517. [DOI] [PMC free article] [PubMed] [Google Scholar]
- Kang H. Lee G.-H. Jung H. Lee J. W. Nam Y. ACS Nano. 2018;12:1128–1138. doi: 10.1021/acsnano.7b06617. [DOI] [PubMed] [Google Scholar]
- Wilson A. M. Mazzaferri J. Bergeron E. r. Patskovsky S. Marcoux-Valiquette P. Costantino S. Sapieha P. Meunier M. Nano Lett. 2018;18:6981–6988. doi: 10.1021/acs.nanolett.8b02896. [DOI] [PubMed] [Google Scholar]
- Huang X. Jain P. K. El-Sayed I. H. El-Sayed M. A. Lasers Med. Sci. 2008;23:217. doi: 10.1007/s10103-007-0470-x. [DOI] [PubMed] [Google Scholar]
- Stanley S. A. Sauer J. Kane R. S. Dordick J. S. Friedman J. M. Nat. Med. 2015;21:92. doi: 10.1038/nm.3730. [DOI] [PMC free article] [PubMed] [Google Scholar]
- Wheeler M. A. Smith C. J. Ottolini M. Barker B. S. Purohit A. M. Grippo R. M. Gaykema R. P. Spano A. J. Beenhakker M. P. Kucenas S. Nat. Neurosci. 2016;19:756–761. doi: 10.1038/nn.4265. [DOI] [PMC free article] [PubMed] [Google Scholar]
- Etoc F. Lisse D. Bellaiche Y. Piehler J. Coppey M. Dahan M. Nat. Nanotechnol. 2013;8:193. doi: 10.1038/nnano.2013.23. [DOI] [PubMed] [Google Scholar]
- Huang H. Delikanli S. Zeng H. Ferkey D. M. Pralle A. Nat. Nanotechnol. 2010;5:602–606. doi: 10.1038/nnano.2010.125. [DOI] [PubMed] [Google Scholar]
- Hernández-Morales M. Shang T. Chen J. Han V. Liu C. Cell Rep. 2020;30:3250–3260. doi: 10.1016/j.celrep.2020.02.070. [DOI] [PMC free article] [PubMed] [Google Scholar]
- Meister M. eLife. 2016;5:e17210. doi: 10.7554/eLife.17210. [DOI] [PMC free article] [PubMed] [Google Scholar]
- Brier M. I. Mundell J. W. Yu X. Su L. Holmann A. Squeri J. Zhang B. Stanley S. A. Friedman J. M. Dordick J. S. Sci. Rep. 2020;10:1–13. doi: 10.1038/s41598-019-56847-4. [DOI] [PMC free article] [PubMed] [Google Scholar]
- Kang P. Chen Z. Nielsen S. O. Hoyt K. D’Arcy S. Gassensmith J. J. Qin Z. Small. 2017;13:1700841. doi: 10.1002/smll.201700841. [DOI] [PMC free article] [PubMed] [Google Scholar]
- Bergeron E. Boutopoulos C. Martel R. Torres A. Rodriguez C. Niskanen J. Lebrun J.-J. Winnik F. M. Sapieha P. Meunier M. Nanoscale. 2015;7:17836–17847. doi: 10.1039/C5NR05650K. [DOI] [PubMed] [Google Scholar]
- Carrow J. K. Singh K. A. Jaiswal M. K. Ramirez A. Lokhande G. Yeh A. T. Sarkar T. R. Singh I. Gaharwar A. K. Proc. Natl. Acad. Sci. U. S. A. 2020;117:13329–13338. doi: 10.1073/pnas.1914345117. [DOI] [PMC free article] [PubMed] [Google Scholar]
- Keblinski P. Cahill D. G. Bodapati A. Sullivan C. R. Taton T. A. J. Appl. Phys. 2006;100:054305. doi: 10.1063/1.2335783. [DOI] [Google Scholar]
- Baffou G. Berto P. Bermudez Urena E. Quidant R. Monneret S. Polleux J. Rigneault H. ACS Nano. 2013;7:6478–6488. doi: 10.1021/nn401924n. [DOI] [PubMed] [Google Scholar]
- Baffou G. Rigneault H. Phys. Rev. B: Condens. Matter Mater. Phys. 2011;84:035415. doi: 10.1103/PhysRevB.84.035415. [DOI] [Google Scholar]
- Xie C. Qin Z. J. Heat Transfer. 2021;144:031204. doi: 10.1115/1.4053196. [DOI] [PMC free article] [PubMed] [Google Scholar]
- Durdevic L. Robert H. M. Wattellier B. Monneret S. Baffou G. Sci. Rep. 2019;9:1–7. doi: 10.1038/s41598-019-40382-3. [DOI] [PMC free article] [PubMed] [Google Scholar]
- Yao J. Liu B. Qin F. Biophys. J. 2010;99:1743–1753. doi: 10.1016/j.bpj.2010.07.022. [DOI] [PMC free article] [PubMed] [Google Scholar]
- Stanley S. A. Gagner J. E. Damanpour S. Yoshida M. Dordick J. S. Friedman J. M. Science. 2012;336:604–608. doi: 10.1126/science.1216753. [DOI] [PMC free article] [PubMed] [Google Scholar]
- He X. Bischof J. C. CRC Crit. Rev. Bioeng. 2003;31:355–421. [Google Scholar]
- Kim H. Arakawa H. Osada T. Ikai A. Ultramicroscopy. 2003;97:359–363. doi: 10.1016/S0304-3991(03)00061-5. [DOI] [PubMed] [Google Scholar]
- Zeng N. Murphy A. B. Nanotechnology. 2009;20:375702. doi: 10.1088/0957-4484/20/37/375702. [DOI] [PubMed] [Google Scholar]
- Baffou G. Rigneault H. Marguet D. Jullien L. Nat. Methods. 2014;11:899–901. doi: 10.1038/nmeth.3073. [DOI] [PubMed] [Google Scholar]
- Lepock J. R. Int. J. Hyperthermia. 2003;19:252–266. doi: 10.1080/0265673031000065042. [DOI] [PubMed] [Google Scholar]
- Castillo K. Diaz-Franulic I. Canan J. Gonzalez-Nilo F. Latorre R. Phys. Biol. 2018;15:021001. doi: 10.1088/1478-3975/aa9a6f. [DOI] [PubMed] [Google Scholar]
- Wen H. Zheng W. Biophys. J. 2018;114:40–52. doi: 10.1016/j.bpj.2017.10.034. [DOI] [PMC free article] [PubMed] [Google Scholar]
Associated Data
This section collects any data citations, data availability statements, or supplementary materials included in this article.


