Abstract
Iron oxide based magnetic nanoparticles (MNPs) as typical theranostic nanoagents have been popularly used in various biomedical applications. Conventional core–shell MNPs are usually synthesized from inside to outside. This method has strict requirements on the interface properties of magnetic cores and the precursors of the coating shell. The shape and size of MNPs are significantly influenced by that of the pre-synthesized magnetic cores. Most core–shell MNPs have only single T2W MRI imaging ability. Herein, we propose a new synthetic strategy for core-mesoporous shell structural MNPs, where hollow mesoporous nanospheres which exhibit an intrinsic property for both CT imaging and drug loading were used as the shell and the magnetic cores were produced in the cavity of the shell. A new type of MNPs, Fe3O4@ZrO2 nanoparticles (M-MZNs), were developed using this facile outside-to-inside way, where multiple Fe3O4 nanoparticles grew inside the cavity of the mesoporous hollow ZrO2 nanospheres through chemical coprecipitation. The obtained MNPs not only exhibited superior magnetic properties and CT/MR imaging ability but also high drug loading capacity. In vitro experiment results revealed that M-MZNs-PEG loaded with doxorubicin (DOX) presented selective growth inhibition against cancer cells due to pH-sensitive DOX release and enhanced endocytosis by cancer cells under a magnetic field. Furthermore, the proposed MNPs exhibited CT/MRI dual modal imaging ability and effective physical targeting to tumor sites in vivo. More importantly, experiments of magnetic targeting chemotherapy on tumor bearing mice demonstrated that the nanocomposites significantly suppressed tumor growth without obvious pathological damage to major organs. Henceforth, this study provides a new strategy for CT/MRI dual-modal imaging guided and magnetic targeting cancer therapy.
Magnetic mesoporous zirconia nanoparticle was synthesized by producing multiple iron oxide cores inside the cavity of mesoporous ZrO2 hollow nanospheres and was used for CT/MRI dual-modal imaging and magnetic targeting chemotherapy.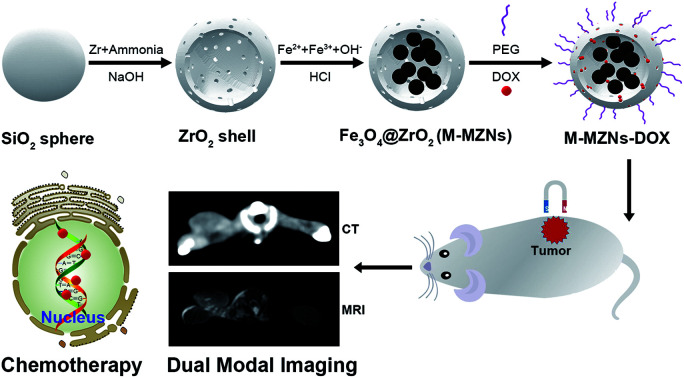
Introduction
Recently, there has been a trend toward theranostic nanotechnology, delivering therapeutic drugs and imaging agents simultaneously within a multifunctional nanoplatform.1–3 These theranostic nanoagents can not only localize the tumor site providing diagnosis information, but also visualize drug pharmacokinetics and biodistribution providing abundant biological information among different patients.4,5 Thus, theranostic nanomedicine makes personalized medicine easier and is in great demand.6,7 Among the broad spectrum of theranostic nanoparticles (NPs), iron oxide based magnetic nanoparticles (MNPs) have attracted a wide range of interest to be researched due to their excellent properties, such as biocompatibility, low toxicity, high relaxation profiles and magnetic susceptibility, superparamagnetism, and tunable surface modifications and multifunctionalization.8,9 In particular, this type of theranostic NPs not only has the intrinsic property of T2-weighted magnetic resonance imaging (T2W MRI) and high capacity of drug loading, but also can be directed to cancer under the influence of a magnet, where tumor targeting can be easily achieved. In recent years, they have been popularly researched in various biomedical applications,10–12 such as MRI guided and/or magnetic targeting chemotherapy,13–15 photodynamic therapy,16–18 photothermal therapy,19–22 magnetic hyperthermia23–25 and combined therapy.26–29
Among different MNPs, those with porous shell have attracted great interest for targeted drug delivery to cancer since the high surface area and pore volume attribute to easy adsorption as well as high loading of chemotherapy drugs.30,31 The most common synthetic strategy for core-porous shell MNPs is that the magnetic core was achieved firstly, followed by the formation of shell on the surface. However, this strategy have two major disadvantages. The first one is that this method has strict requirements to the interface properties of magnetic cores and the precursors of coating shell.32 Besides, the shape and size of MNPs were significantly influenced by that of the magnetic cores. Thus, only silica as well as few metal oxides were successfully used as porous shell for MNPs.32
On the other hand, iron oxide based core–shell MNPs with single T2W MRI function have some limitations, such as long acquisition time, negative contrast imaging, low sensitive for tissues containing low proton density, like lung.33,34 Theses limitations may constrain the range of their application area. X-ray computed tomography (CT) is the other major imaging technique besides MRI for cancer therapy response evaluation in clinical practice,35,36 and it has distinctive advantages complementary to MRI, such as short examination time, high imaging contrast for hard-tissue and lung, high spatial resolution and low cost.33,34 Thus, MNPs with CT/MRI dual modal imaging ability have significant perspective for clinical use. Unfortunately, reports about combining core–shell MNPs with biocompatible materials for CT imaging are very few. Several studies combined Gold37–42 to core–shell MNPs through coating or chemically linking. For example, Sanchez reported the synthesis of janus MNPs by combining Au NPs to the surface of magnetic mesoporous silica NPs.43 However, adding imaging components to MNPs may decrease the drug loading capacity and increase the cost and complexity of synthesis.44 For example, the specific surface decreased from 848 m2 g−1 to 380 m2 g−1 after addition of Au NPs in Sanchez' study.43
ZrO2 NPs were demonstrated to have good biocompatibility and safety used as versatile biomaterials in recent years.45 It was indicated that mesoporous hollow ZrO2-based nanocomposites not only have high drug loading capacity but also have property of CT imaging due to the high atomic number (Z = 40) and atomic mass of Zr element.46 Thus, mesoporous ZrO2 NPs seem ideal candidate for used as shell for MNPs.
On the basis of the above considerations, we propose a new synthetic strategy for core-mesoporous shell structural MNPs, where hollow mesoporous ZrO2 nanospheres were used as the shell and the magnetic cores were produced in the cavity of the shell through a facile outside-to-inside way. Using this strategy, the magnetic cores were easily achieved through confined coprecipitation using cheap chemicals and mild reaction conditions. Unlike conventional synthesis of core–shell MNPs from inside to outside, the cores were produced inside the shell and thus there is no need to consider the surface chemical properties and no need to use surfactant. Furthermore, CT/MRI dual modal imaging can be easily achieved without adding another component to the shell.
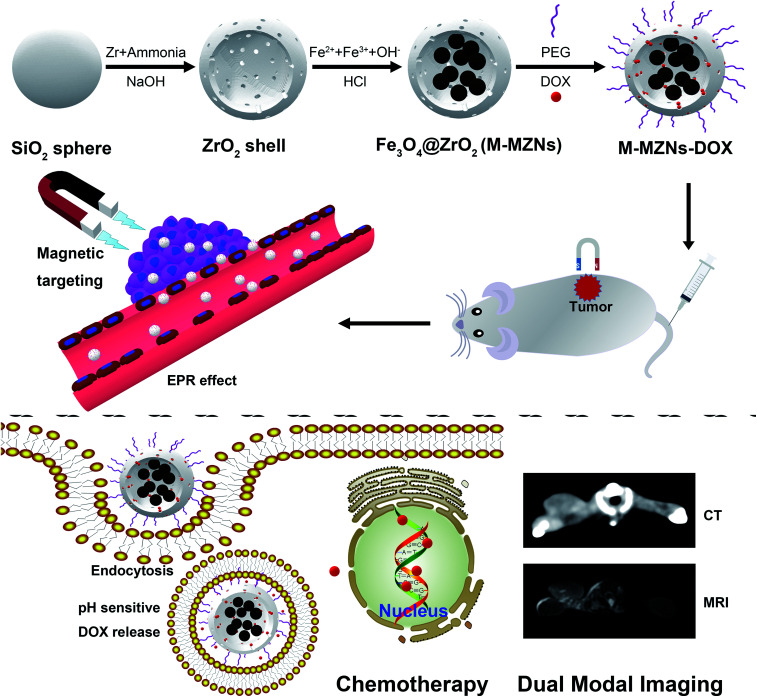
In this study, we present the synthesis of magnetic mesoporous zirconia nanoparticle (Fe3O4@ZrO2, abbreviated as M-MZNs) for CT/MRI dual modal imaging and magnetic targeting drug delivery, as presented in Scheme 1. Ferrous and ferric aqueous solution were sealed into the inner space of the hollow ZrO2 nanospheres with a simple physical forced penetration method. Afterwards, ultrasmall superparamagnetic iron (USPIO) NPs were produced through coprecipitation in ethanol inside the cavity of mesoporous ZrO2 hollow nanospheres, obtaining a new type of MNPs with multiple cores and mesoporous shell. Then the as-made M-MZNs were PEGylated to improve its biocompatibility and prolong circulatory time in the blood. The as-made M-MZNs-PEG presented high density on CT imaging with a CT value of as high as 430.5 HU at the concentration of 50 mg mL−1 and their transverse relaxivity (r2) was 79.88 mM s−1. Due to the presence of multiple USPIO cores, the M-MZNs-PEG also possess excellent magnetic property with a saturation magnetization (Ms) of 26.5 emu g−1. Once injected intravenously, the nanocomposite could be directed to tumor site by an external magnetic field and make the tumor site positively enhanced in CT imaging with an CT value increase of 37.68% as well as negatively enhanced in MRI imaging with a signal intensity (SI) decrease rate of 39.95%. In the meantime, mesoporous and modified core–shell structure contributes to large capacity for drug loading of DOX. Thus, the M-MZNs could also be used for magnetic and pH dual responsive drug delivery. The results of in vivo anti-tumor experiments indicated that DOX loaded M-MZNs (M-MZNs-DOX) could significantly enhance the efficacy of chemotherapy. Hence, our work demonstrates the proposed multifunctional nanoplatform as novel theranostic platforms bring about potential clinical applications for CT/MRI dual-modal imaging guided and magnetic targeting cancer therapy.
Scheme 1. Schematic illustration of the synthesis for M-MZNs-DOX and its application for CT/MRI duo-modal imaging and chemotherapy in a magnetic field.
Experimental
Reagents and materials
Sodium hydroxide (NaOH), anhydrous ethanol, ammonia (NH3·H2O, 28%), acetonitrile, hydrochloric acid (HCl), ammonium iron(ii) sulfate hexahydrate, and ammonium iron(iii) sulfate dodecahydrate were bought from Sinopharm Chemical Reagent Co., Ltd. Zirconium propoxide was obtained from Tokyo Chemical Industry Co., Ltd. DOX was provided by Dalian Meilun Biotechnology Co., Ltd. Polyethylene glycol (PEG) was obtained from Beijing Chemgen Pharma Co., Ltd. Fetal bovine serum (FBS) were obtained from GIBCO. Dulbecco's Modified Eagle Medium-High Glucose (DMEM-HG), phosphate buffer saline (PBS), penicillin and streptomycin were provided by Thermo Fisher Scientific Inc. All reagents were used without further purification.
Synthesis of mesoporous hollow ZrO2 NPs
Uniform sized mesoporous hollow ZrO2 NPs were synthesized using the previously reported method with a slight modification.45 283 mg SiO2 NPs with a size of about 127 nm were dispersed in the mixture of 120 mL ethanol, 40 mL acetonitrile and 1.2 mL of ammonia. 0.5 mL of zirconium propoxide was rapidly put into another mixture of 30 mL ethanol and 10 mL acetonitrile. Then the above two mixture were mixed together. The reaction was sustained for 16 h under magnetic stirring at room temperature. Then the products of SiO2@ZrO2 were collected by centrifugation at 9000 rpm for 10 min and washed with ethanol and water for 3 times. The SiO2@ZrO2 NPs were dispersed into 100 mL deionized water. The dispersion was heated to 80 °C under stirring; then, 6 mL of 1 M NaOH solution was added and reacted for 4 h. The products of mesoporous hollow ZrO2 NPs were obtained after washing with deionized water for 3 times and centrifugation at 9000 rpm for 10 min.
Synthesis and surface modification of M-MZNs
20 mg of ZrO2 NPs were scattered in 4 mL of deionized water containing 100 mg of ammonium iron(ii) sulfate hexahydrate and 123 mg of ammonium iron(iii) sulfate dodecahydrate. The mixture solution was pumped under the condition of vacuum until the water was drained. After washed with anhydrous ethanol three times, the sample was redispersed in 40 mL anhydrous ethanol by sonication for 20 min and transfered into a three neck flask. Then it was stirred and refluxed at 70 °C for 2 h under nitrogen protection after 2 mL of ammonia was added. The black precipitation was collected by centrifugation at 8500 rpm for 10 min. After washed with ethanol and deionized water, the product was stirred for 30 min in 30 mL of 0.2 M HCl followed by washing with water to remove Fe3O4 on the surface of ZrO2 spheres. The product of M-MZNs was magnetically separated and washed with water for 3 times. 20 mg of M-MZNs were dispersed in 20 mL H2O containing 5 mg PEG, and then properly stirred for 16 h to achieve the M-MZNs-PEG.
Characterization
The morphology of as-fabricated NPs were characterized by transmission electron microscope (TEM, JEM-2100, JEOL) and scanning electron microscope (SEM, Model S-4800, Hitachi). Energy dispersive spectroscopy (EDS) of SEM was employed to determine the elements in the samples. Hydrodynamic diameter in water and zeta potential were measured using a Zetasizer Nano-ZS (3000HSA, Malvern Instruments) at room temperature. X-ray powder diffraction (XRD) was used to determine the crystal lattice properties of NPs on a D8 Focus X-ray diffractometer (Bruker, Germany) with a scanning range from 20° to 80°. Magnetic characterization were evaluated using superconducting quantum interference device magnetometer (PPMS-9, Quantum Design, US) at 300 K. The measurements were recorded between −20 000 and 20 000 Oe. N2 adsorption–desorption isotherm was measured with a QuadraSorb Station 3 (Quantachrome Instruments, USA) at −196 °C. The Brunauer–Emmett–Teller (BET) and Barrett–Joyner–Halenda (BJH) method were used to calculate the specific surface area and pore size distribution.
Drug loading and release in vitro
Chemotherapeutic drug, DOX, was used to test the drug-loading capacity and release behavior of M-MZNs. 20 mg of M-MZNs-PEG was dispersed into DOX solution (10 mg of DOX in 10 mL PBS). The mixture solution was stirred for 16 h under dark conditions and then drained by vacuum pumping. After that, the sample was washed 3 times with PBS. M-MZNs-DOX were obtained by centrifugation and re-dispersed in of PBS. The supernatant was collected and concentration of DOX in solution was measured using a microplate reader (Thermo Fisher Scientific, Inc., USA) at the wavelength of 481 nm. The amount of DOX loaded was determined by the difference of the initial and residual DOX amount. Drug loading (DL, %) was calculated using the equations of mass of DOX loaded in NPs/mass of DOX loaded NPs. Drug encapsulation efficiency (EE, %) was determined using the equations of mass of DOX in NPs/initial mass of DOX.
To determine the drug release behaviors, 10 mg of M-MZNs-DOX were dispersed in 10 mL of PBS solutions at pH of 5.5 and 7.4. Drug releasing was carried out in a shaking table at 37 °C. At the predetermined time intervals, the amount of released DOX was measured with a microplate reader.
In vitro CT imaging and relaxivity measurement of M-MZNs
For evaluation of CT imaging capability, M-MZNs dispersed in a PBS solution with a concentration range of 50, 25, 12.5, 6.25 and 3.125 mg mL−1 were placed in an Eppendorf tube. The tubes were positioned in a tube rack. The rack was scanned by a 256 multislices CT (Brilliance iCT256, Philips Healthcare) with slice thickness of 1 mm under different voltages of 80–140 kV.
The T2 values of M-MZNs in PBS at different concentrations were measured at 3.0 T MRI scanner (Signa HDxt imager; GE Healthcare Bio-Sciences Corp, USA). 1 mL of M-MZNs dispersed in PBS solution were mixed with the same volume of 1% agarose gel at different Fe concentrations of 0, 0.017, 0.034, 0.068, 0.137, and 0.275 mM in 2.5 mL Eppendorf tubes. The tubes were fixed in a box filled with agarose gel to minimize magnetic susceptibility to air interface artifacts. The tank was placed in a 8 HD head coil. T2WI and T2 Mapping Images were achieved using the quantitative T2 multi-spin multi echo scan sequence. The scanning parameters were as follows: echo time (TE) = 9, 18, 36, 45, 55, 64 and 73 ms; repetition time (TR) = 1220 ms; slice thickness = 2 mm. At last, the r2 value was calculated as the slop of correlation line between transverse relaxation R2(1/T2) and Fe concentration.
Cell culture and animal model
Briefly, human hepatocarcinoma cells (cell line HepG2) were cultured at 37 °C under 5% CO2 in DMEM-HG medium containing 10% FBS, penicillin (100 U mL−1), and streptomycin (100 μg mL−1). The HepG2 cell line was provided by the Cell Bank of Type Culture Collection of Chinese Academy of Sciences (Shanghai, China). All animal experiments in this work were performed in compliance with the Guide for the Care and Use of Laboratory Animals, eighth edition (international publication no: 978-0-309-15400-0) and approved by the Institutional Animal Care and Use Committee (IUCUC) of the First Hospital of China Medical University (CMU). Kunming female mice with weight of about 24.4 g (obtained from Department of Laboratory Animal Science of CMU) were subcutaneously implanted with 2 × 10⁶ H22 tumor cells in the axillary.
In vitro cytotoxicity assay and anti-cancer activity
CCK-8 method was used to test the cytotoxicity of M-MZNs and therapeutic effect of M-MZNs-DOX to cell line HepG2. 3000 cells were seed onto well of 96-well plates. After incubation overnight, HepG2 cells were treated with M-MZNs at different concentrations ranging from 0.78 to 100 μg mL−1 for 24 h. For the test of in vitro therapeutic effect, free DOX and M-MZNs-DOX at the DOX concentration of 0.625–10 μg mL−1 were separately added and cells were treated for 24 h. The small NdFeB permanent magnet with thickness of 1 mm was placed under of plates for first 0.5 h of incubation in the magnetic targeting group. Then, the cellular viability was measured with CCK-8 method by a microplate reader at the wavelength of 450 nm.
Cellular uptake of M-MZNs
Prussian blue stain: 2 × 10⁵ cells per well were cultured in 6-well plates overnight and treated with 12.5 μg and 25 μg of M-MZNs dispersed in 2 mL serum-free DMEM medium for 4 h. A small NdFeB permanent magnet with thickness of 2 mm was placed under each well in the magnetic targeting groups during the first 0.5 h of incubation. After treatment, cells were fixed with 4% paraformaldehyde for 30 min. Then the fixed cells were stained by freshly prepared Prussian blue staining solution (Solarbio Life Sciences Co, Beijing, China) for 30 min and counterstained by eosin for 1 min.
Bio-TEM of labelled cells: HepG2 cells were incubated in a culture flask and treated with 12.5 μg mL−1 of M-MZNs. After 24 h of treatment, the cells were digested and fixed with 2.5% glutaraldehyde for 24 h and postfixed in 1% osmium tetroxide for 1.5 h. After dehydrated, transparentized, embedded and polymerized, the samples were cut into ultrathin sections of about 70 nm thickness. The sections were then transferred to the copper grid and observed on TEM (H-7650, Hitachi) at 80 kV.
Intracellular DOX release
HepG2 cells were seeded onto 24-well plates with 1 × 10⁴ cells in each well. After incubated overnight, cells were treated with 1 mL of M-MZNs-DOX (12.5 μg mL−1 in DMEM) and free DOX (2.5 μg mL−1) for 4 h. For the magnetic targeting group, a small NdFeB permanent magnet with thickness of 2 mm was placed under of the well during the first 0.5 h of incubation. After the medium was discarded, the cells were washed with PBS for 3 times and then fixed with 4% paraformaldehyde in PBS for 15 min. Then the cell nuclei were stained with 4′,6-diamidino-2-phenylindole (DAPI). The blue emitting fluorescence of DAPI and red emitting fluorescence of DOX in cells were observed by laser scanning confocal microscopy (LSCM) (Olympus FV1000-IX81). For quantitative study, HepG2 cells were seeded in 6-well plates with 2 × 10⁵ cells in each well. The treatments were same to the experiment of LSCM. And an another control group of cells were treated with medium. After washed with PBS for 3 times, the treated cells were digested and collected. The fluorescence intensity of intracellular DOX was quantified by flow cytometry at 488 nm.
In vivo CT/MR imaging and magnetic targeting ability
H22-tumor bearing mice placed on a self-made plank were subjected to CT and MR imaging before and immediately after intratumorally injection or 3 h after intravenously injection with 0.2 mL of M-MZNs-DOX (80 mg kg−1 dispersed in saline). A cylinder NdFeB permanent magnet with diameter of 15 mm and thickness of 5 mm was fixed on the surface at the tumor site for the magnet targeting group after injection. 1 h later, the magnets was removed. A 256 Multislice CT (Brilliance iCT256, Philips Healthcare) was used for CT imaging with slice thickness of 2 mm under voltages of 80 kV and 200 mA. Fat suppression T2WI was achieved by 3T MRI scanner with a wrist coil. The scanning parameters were as follows, TR = 3460 ms; TE = 110 ms; slice thickness = 2 mm. Furthermore, all the mice and a control group mice 3 h post treated with saline were sacrificed. Major organs (brain, heart, spleen, liver, lung, muscle and kidney) and tumor were harvested. The samples were fixed in 4% paraformaldehyde for 48 h, embedded into paraffin and then cut into sections with thickness of 4 μm. The tissue sections were stained with Prussian blue–eosin and hematoxylin–eosin (H&E) to qualitatively analyze tumor targeting and biodistribution of the NPs.
Antitumor efficacy evaluation of M-MZNs-DOX in H22 tumor bearing mice
To evaluate the antitumor efficacy of M-MZNs-DOX, H22-tumor bearing female mice with each group of 3 mice were injected with 0.2 mL of saline, M-MZNs (10 mg kg−1), free DOX (2 mg kg−1), M-MZNs-DOX (10 mg kg−1) and M-MZNs-DOX (10 mg kg−1) with a small magnets fixed at the tumor site for 1 h, via caudal vein every 4 days. The injections were repeated 4 times. Length and width of tumors and body weight of the mice were carefully recorded every two or three days. The tumor volume was calculated by the formula of length × width2/2. Three days after the last injection, the mice were sacrificed and the main organs and tumors were harvested and measured. Sections of major organs were stained with H&E to evaluate the safety. Terminal deoxynucleotidyl transferase dUTP nick-end labeling (TUNEL) was used to analyse apoptosis in tumors with an in situ cell death detection kit, according to the manufacturer's protocol. Ratio of apoptosis were presented as the average results of three images per tissue.
Statistical analysis
Quantitative data collected were expressed as mean ± SD. The statistical significance was determined with Student's t-test using SPSS 17.0. The statistical significance was inferred at a value of P < 0.05.
Results and discussion
Preparation and characterization of the as-synthesized materials
The M-MZNs were synthesized by the following procedure as illustrated in Scheme 1. Firstly, mesoporous hollow ZrO2 NPs were prepared via a template method using SiO2 templates as described previously.45 Then, ferrous and ferric salts mixture with a Fe2+ : Fe3+ ratio of 1 : 1 were sealed into the inner space of the ZrO2 hollow nanospheres with a simple physical forced penetration method. Next, Fe3O4 cores were produced in ethanol through a modified chemical coprecipitation method using ammonia as coprecipitator.47 The Fe3O4 NPs on the outer surface of ZrO2 spheres were removed by HCl. Ultimately, the as-synthesized M-MZNs were PEGylation through physical adsorption method to improve their biocompatibility and half time in the blood circulation.
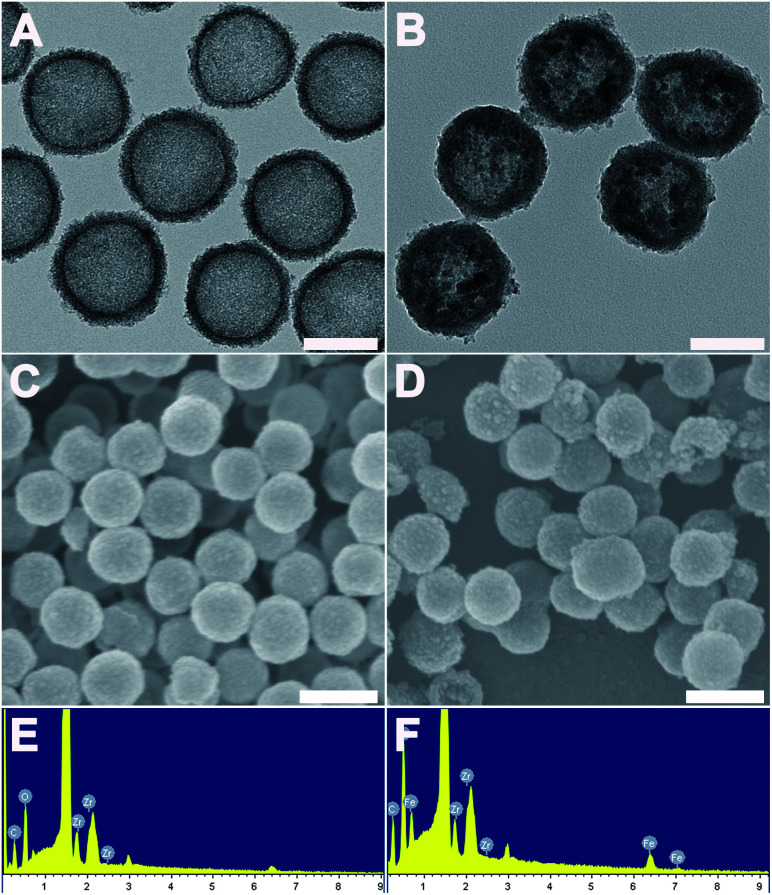
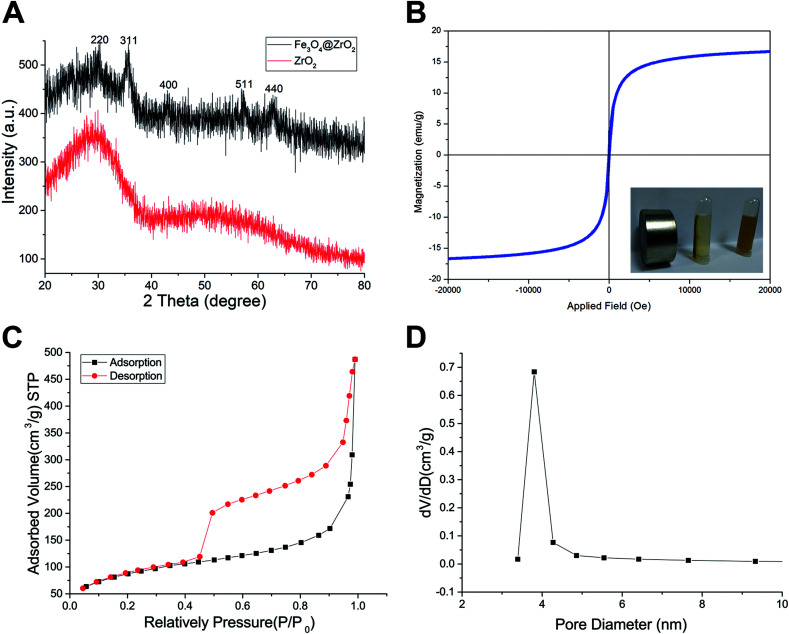
The morphology of the as-made materials was characterized by TEM and SEM. As shown in Fig. S1A and S1B,† SiO2 NPs show solid nanospheres structure with a mean diameter of 126.83 ± 8.23 nm. As shown in Fig. 1A of TEM image, spherical and hollow ZrO2 NPs were successfully synthesized from templates of SiO2. The ZrO2 NPs have a mean diameter of 154.06 ± 10.50 nm measured from TEM image and narrow size distribution (Fig. S1C†). Fig. 1B shows the TEM images of M-MZNs. As we can see, well-dispersed uniform nanoscale structures characterized with a round-shaped ZrO2 spheres enwraping multiple USPIO NPs were formed. The mean size of M-MZNs is 155.23 ± 7.10 nm (Fig. S1D†). As indicated in TEM and SEM images, our as-fabricated MNPs with magnetic cores grown in the cavity (Fig. 1B and D) show no significant differences in both shape and size, compared with ZrO2 NPs (Fig. 1A and C). Elements contained in the as-made nanoplatforms EDS was measure with EDS. As revealed from EDS, Zr and O are the main elements in the sample of ZrO2 NPs (Fig. 1E), and a significant peak of Fe was detected in the sample of M-MZNs (Fig. 1F), confirming the presence of iron oxide. Fig. S1E† shows zeta potentials of −44.9 mV, 16.9 mV, and −17.9 mV, for ZrO2, M-MZNs and M-MZNs-PEG, respectively. The difference of zeta potentials between M-MZNs confirms the successful PEGylation. The hydrodynamic diameter of the Fe3O4@ZrO2-PEG particles was 231.4 nm and the polydispersity index (PDI) was 0.144 as measured with dynamic light scattering (Fig. S2†). This low PDI indicated that Fe3O4@ZrO2-PEG was monodisperse. The dispersion in water and saline can be stable for at least 2 h. XRD was further used to analyse the crystalline nature. As indicated in Fig. 2A, besides the broad peak at 2 theta of 20–40° corresponded to the amorphous peak of ZrO2, M-MZNs possess several diffraction peak at 2 theta of 30.2°, 35.7°, 43.3°, 57.2°, and 62.6°, which were characteristic diffraction peak of spinel inverse magnetite phase Fe3O4 assigned to [220], [311], [4004], [5115], and [440] lattice planes.48 Then, the magnetic property of M-MZNs-PEG were studied by magnetometer. As presented in Fig. 2B, the magnetization curve of M-MZNs-PEG shows its superparamagnetic behavior owing to absence of hysteresis loops, with a Ms of about 26.5 emu g−1. Thanks to such a high Ms value, the M-MZNs-PEG can be quickly attracted by an external magnet (Fig. 2B, inset). When the magnet was removed, they became emulsion again soon after slight shaking. It is worthwhile to note that this Ms value is higher than that of the core–shell MNPs with a single magnetic core of similar size in the sphere previously.26 This may be contributed to the multi-cores structure of this new MNPs. The excellent magnetic properties of the as-made MNPs make them suitable for magnetic targeting drug delivery applications.
Fig. 1. The structural characterization of ZrO2 and M-MZNs. (A) TEM images of ZrO2 NPs and (B) TEM images of M-MZNs NPs, scale bars represent 100 nm. (C) SEM images of ZrO2 NPs and (D) SEM images of M-MZNs, scale bars represent 200 nm. (E) EDS of ZrO2 NPs and (F) EDS of M-MZNs.
Fig. 2. Characterization of the sample. (A) XRD spectra of ZrO2 and M-MZNs. (B) Magnetization curves of M-MZNs measured at 300 K. (Inset in B) Photograph of M-MZNs in aqueous solution and the directed movement under an external magnetic field. (C) N2 sorption isotherms and (D) pore diameter distribution of ZrO2 and M-MZNs.
The mesoporous property of M-MZNs-PEG was verified by N2 isotherms, as presented in Fig. 2C and D. Fig. 2C revealed that the isotherm curve was type IV with an obvious hysteresis loop, demonstrating mesoporous structure of M-MZNs-PEG. The BET estimated specific surface area of M-MZNs-PEG were 307.066 m2 g−1. The pore size in M-MZNs-PEG is 3.803 nm and the pore volumes (VP) is 0.783 cm3 g−1 from the pore size distribution presented in Fig. 2D. The high surface area and mesoporous channels could endow M-MZNs-PEG with large drug loading capacity and excellent prospect in biological applications.
DOX loading and pH-responsive release results
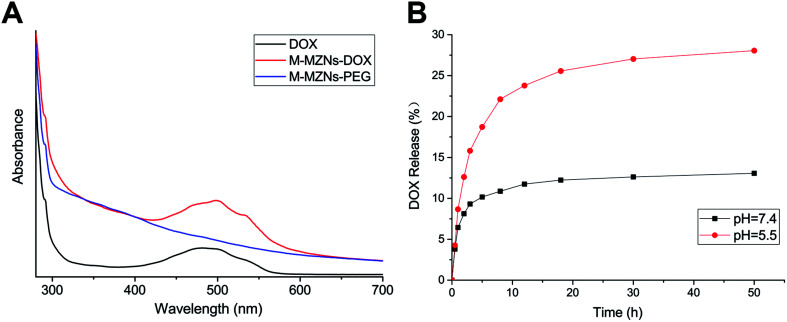
DOX, as a model drug, was chosen to analyse the drug loading capability of M-MZNs-PEG. The spectrum of UV-vis absorption was used to confirm the successful loading of DOX in the M-MZNs-PEG. As shown in Fig. 3A, M-MZNs-DOX and free DOX exhibit the same absorption peak centered at 481 nm, whereas M-MZNs-PEG express no significant absorption at wavelength around 481 nm. This suggests that DOX was successfully loaded in the M-MZNs-PEG. EE and DL were around 49.5% and 20.2%, respectively. The DL of M-MZNs-PEG was similar to the 21% of drug-loading content in mesoporous MNPs with core–shell structure as previously published.49 The pH-sensitive release of DOX was explored in PBS solution with different pH (5.5 and 7.4). The cumulative released content of DOX was less than 12.5% in the condition of pH 7.4 in 24 h, while more than 25% of DOX was released in acidic condition (pH = 5.5) in 24 h (Fig. 3B). This suggests that DOX releasing from M-MZNs-PEG can be triggered by acidic environments. This discrepant release profiles may result from weakened electrostatic interaction between DOX and particles by lower pH. Since the pH value of extracellular microenvironments is lower and the acidic cell organelles such as lysosomes and endosomes are more in cancer tissue than that in normal tissues, this pH- sensitive drug-release property makes the fabricated M-MZNs-DOX suitable for anti-cancer therapy.50
Fig. 3. DOX loading and pH-responsive release of nanoparticles. (A) Fluorescence spectra of free DOX, M-MZNs-PEG and M-MZNs-DOX dispersed in PBS. (B) In vitro release profiles of M-MZNs-DOX under different pH value conditions (pH = 7.4 and 5.5).
Magnetically enhanced endocytosis and intracellular DOX accumulation in vitro
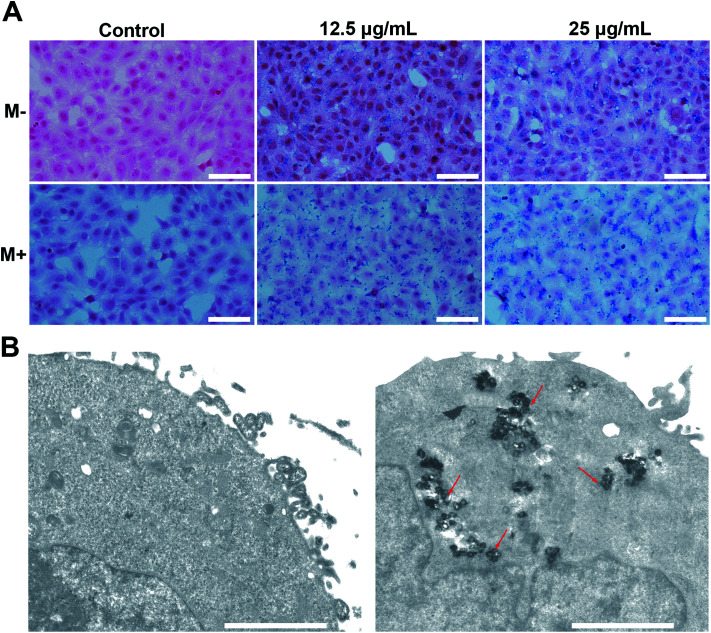
Cellular internalization is essential for NPs used as an effective drug delivery carriers in vivo. Prussian blue staining, which selectively stain Fe3+, were used to evaluate endocytosis behavior of M-MZNs-PEG by cancer cells and the effect of magnetic fields on promoting internalization. In this work, HepG2 cells were treated with M-MZNs-PEG in a low (12.5 μg mL−1) and high (25 μg mL−1) concentration for 4 h, and were then stained with Prussian blue. As shown in Fig. 4A, blue dots accumulation in cells treated with a high concentration is obviously higher than that in cells treated with a low concentration, indicating that M-MZNs-PEG could be concentration dependently uptaken by tumor cells. Importantly, the intracellular amount of M-MZNs-PEG was markedly increased by external magnetic field. This result demonstrated that endocytosis of M-MZNs-PEG could be enhanced by the attraction of magnetic field. The mechanism may be that M-MZNs-PEG can be attracted and directed to the site of tumor cells by the external magnetic field. Then the accelerated sedimentation and accumulations of M-MZNs-PEG on the cellular surface caused the endocytosis increased.51 Cellular internalization of M-MZNs-PEG after 24 h co-incubation in HepG2 cells was further confirmed by Bio-TEM. As shown in Fig. 4B, a large number of NPs can be observed inside cells without any observable modification in size and morphologism, with some of them were enclosed in vesicular structures in the cytoplasm. According to literatures, the NPs can be endocytosis from the cell membrane, encapsulated in early endosomes, and then late endosomes after maturation process, and finally ending as lysosomes.52,53
Fig. 4. Magnetic field enhanced cellular uptake of M-MZNs-PEG. (A) Images of HepG2 stained with Prussian blue after 4 h of treatment with different concentration of M-MZNs-PEG, (M−) in absence or (M+) presence of an external magnetic field for the first 0.5 h of treatment. Scale bars represent 50 μm. (B) Biological TEM images of HepG2 cells treated with culture medium only (left) or M-MZNs-PEG dispersed culture medium at the concentration of 12.5 μg mL−1 (right) for 24 h. Scale bars represent 2 μm.
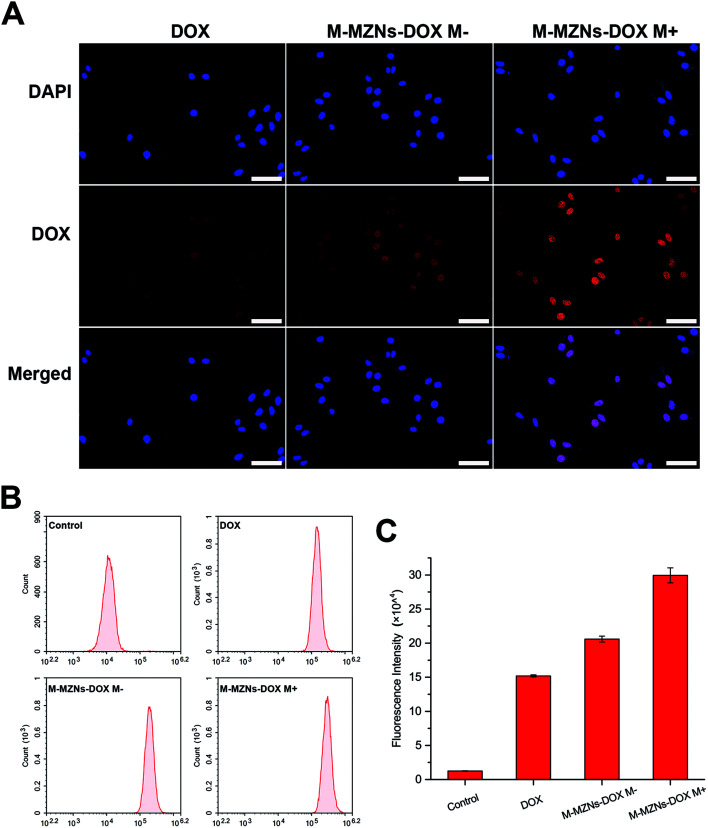
LSCM and flow cytometry were employed to observe and quantify the fluorescence of intracellular DOX released from the nanocarrier. HepG2 cells were treated with M-MZNs-DOX (12.5 μg mL−1 in DMEM) and free DOX (2.5 μg mL−1 in DMEM) for 4 h. As demonstrated in Fig. 5A, the red fluorescence emitted from DOX mainly appears in the same position of the blue fluorescence of DAPI, indicating that DOX was released from NPs and accumulated in nuclei after 4 h of incubation. After cellular endocytosis by cancer cell, the NPs were trapped and exposed to the acidic compartments, such as endosomes and lysosomes. Then DOX was pH responsively released from NPs into nuclei. This result provides evidence that pH-responsive drug release of the as-made MNPs is effective in tumor cell and confidence for further application in tumor therapy study.
Fig. 5. Magnetic field enhanced drug accumulation in HepG2 cells. (A) Laser scanning confocal microscopy images, (B) fluorescence emission and (C) fluorescence intensity measured with flow cytometry of HepG2 cells after 4 h of exposure to free DOX, M-MZNs-DOX without magnetic field (M−) and M-MZNs-DOX with magnetic field for first 0.5 h of exposure (M+). Red fluorescence represent location of DOX, and the cell nuclei were stained with DAPI (blue). Scale bars represent 50 μm.
Furthermore, fluorescence intensity of cells was measured by flow cytometry at 488 nm. As shown in Fig. 5B and C, cells in the control group showed nearly no fluorescence and the fluorescence intensity was only 1.26 ± 0.14 (×104). However, obvious fluorescence was detected at 488 nm in the other three groups. The values of fluorescence intensity (×104) were 15.20 ± 0.15, 20.59 ± 0.43 and 29.95 ± 1.10 for the group of free DOX, DOX-NPs M− and DOX NPs M+, respectively. It can be seen from this results that fluorescence intensity in the DOX-MNPs group is stronger than that in the free DOX group. This may be attributed to NPs mediated enhanced endocytosis than small molecular as well as cellular retention and continual drug releasing compared with free DOX which could be pump-out by some protein, like p-gp.13 More importantly, intracellular fluorescence intensity was remarkably enhanced by the magnetic field with about 1.45 fold increase. It may be due to magnetic field enhanced endocytosis of NPs. Therefore, these results demonstrate that the fabricated MNPs has the ability of cancer cell targeting drug delivery through pH responsive drug release and magnetic-accelerated endocytosis.
Cytotoxicity of M-MZNs-PEG and magnetically-enhanced anti-cancer effect of M-MZNs-DOX in vitro
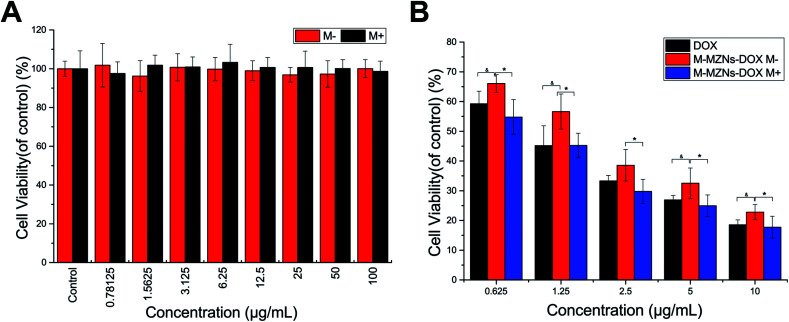
Biocompatibility is a crucial premise for NPs used as drug carriers. HepG2 cells were treated with a varying concentration M-MZNs-PEG with (0.78 to 100 μg mL−1) for 24 h and the cytotoxicity was detected with the CCK-8 analysis. We also investigated the cytotoxicity of M-MZNs-PEG on HepG2 cells under an external magnetic field. As indicated in Fig. 6A, M-MZNs-PEG has no obvious cytotoxicity, and the presence of magnetic stimuli did not increase its cytotoxicity even under a high concentration of 100 μg mL−1. This result revealed that the M-MZNs-PEG as a nanocarrier have a good biocompatibility and safety for magnetic targeting drug delivery.
Fig. 6. Cytotoxicity and magnetic field enhanced therapeutic effect in vitro. (A) Relative cell viability of HepG2 cells after 24 h of exposure to M-MZNs-PEG at different concentration under magnetic field for the first 0.5 h of exposure (M+) or not (M−), detected by CCK8 assay. (B) Relative viabilities of HepG2 cells after 24 h of treatment with free DOX, M-MZNs-DOX (M−) and M-MZNs-DOX under magnetic field (M+) at various DOX concentrations.
The in vitro therapeutic effect of M-MZNs-DOX on cancer cells was evaluated with CCK-8 kit. HepG2 cells were treated with free DOX and M-MZNs-DOX at various DOX concentrations for 24 h with or without an external magnetic field for the first 0.5 h of treatment. As shown in Fig. 6B, both M-MZNs-DOX (in absence or presence of magnetic field) and free DOX inhibited HepG2 cells dose dependently. The relative viability of HepG2 cells ranged from 59.26% ± 4.20% to 18.58% ± 1.64% in the DOX group and 66.04 ± 3.00% to 22.82% ± 2.53% in the NP M− group at variant DOX concentration of 0.625 to 10 μg mL−1. And the external magnetic field significantly increased the killing effect of M-MZNs-DOX against HepG2 cells with viability ranging from 54.76% ± 5.88% to 17.72% ± 3.66% (P < 0.05 for M-MZNs-DOX M+ versus M-MZNs-DOX M−). The relative viability in the M-MZNs-DOX M+ group was similar to in DOX group (P > 0.05) at each DOX concentration.
The above results indicate that M-MZNs-DOX have effective and magnetic-responsively targeting antitumor activity. This activity may owing to the NPs have properties of magnetic elevated endocytosis and pH-sensitive DOX release in cancer cell. Then, DOX released in cells intercalated into the DNA and finally prevented cell replication.
CT/MRI dual-modal imaging and magnetic targeting of M-MZNs-DOX
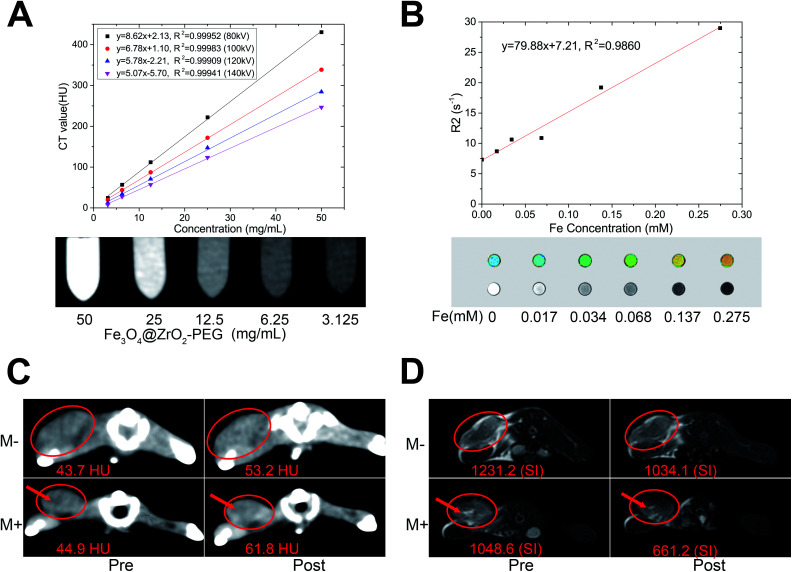
We have then evaluated the CT and MRI imaging properties of the as-synthesized MNPs in vitro and in vivo (Fig. 7A). Attenuations of M-MZNs-PEG on CT images were significantly correlated with their concentration under all tube voltages used in this study. This CT imaging potential properties may be attributed to the high atomic number and atomic weight of the elements of Zr and Fe. Fig. 7B shows in vitro T2 mapping and T2W MRI of M-MZNs-PEG at various Fe concentrations. The darker signals on T2-weighted images with enhanced Fe concentration are examined. This result is consistent with the pseudo-color images of transverse relaxation time (T2 value). The corresponding r2 value is calculated to be 79.88 mM−1 S−1. This result indicates that the as-made MNPs exhibiting a good property for used as a T2 contrast agent owing to the presence of multiple Fe3O4 NPs cores inside the nanocomposite.
Fig. 7. CT/MRI dual-modal imaging performance in vitro and in vivo. (A) CT value versus different concentrations of M-MZNs-DOX under tube voltages of 80, 100, 120 and 140 kV, and corresponding CT images under 100 kV. (B) Relaxation rate R2(1/T2) versus different Fe concentrations of M-MZNs-DOX, and corresponding T2 mapping and T2-weighted magnetic resonance (MR) images. (C) CT and (D) MR images of tumor acquired pre and 3 h post intravenous injection of M-MZNs-DOX in (M−) absence or (M+) presence of external magnet placed on the surface of tumor for the first 1 h. Arrows represent the necrotic region.
The CT/MRI dual modal imaging in vivo of M-MZNs-DOX was further verified in H22 tumor bearing mice. As displayed in Fig. S3,† the tumor site exhibits obvious enhancement on CT images and much lower SI on T2W MRI after intratumorally injection of the nanocomposites, which implies that the as-made nanocomposites could be used as a effective contrast agent for CT/MRI dual modal imaging. Magnetic targeting CT/MRI in vivo study were further conducted via intravenous injection route. As indicated in Fig. 7C and D (M− groups), the tumor site was positively and negatively enhanced on CT and T2WI images, respectively, 3 h after injection, which is consistent with the results of intratumoral injection. CT value of tumor increased from 43.71 ± 0.77 HU before injection to 53.23 ± 0.43 HU after injection, with an enhancement rate of 21.78%. And SI decreased from 1231.24 ± 24.28 before injection to 1034.10 ± 16.83 after injection, with a SI decrease rate of 16.01%. Importantly, the contrast enhancement effect on both CT and MR imaging can be improved by the magnet placed on body surface near the tumor. As shown in Fig. 7C and D (M+ groups), CT value of tumor increased from 44.88 ± 0.67 HU pre injection to 61.79 ± 1.43 HU post injection, with an enhancement rate of 37.68%, and SI decreased from 1048.61 ± 6.28 pre injection to 661.2 ± 12.97 post injection, with a SI decrease rate of 36.95% (the necrotic region, labeled by arrows in the images, was excluded from measurements). This result indicates that the as-made MNPs may be directed to the tumor site with a high efficiency of magnetic targeting and cause the tumor enhanced on both CT and MRI imaging. Based on the above results, we can conclude that the as-made MNPs could be used as an effective contrast agent for magnet targeting MRI/CT duo-modality imaging to supervise the treatment process.
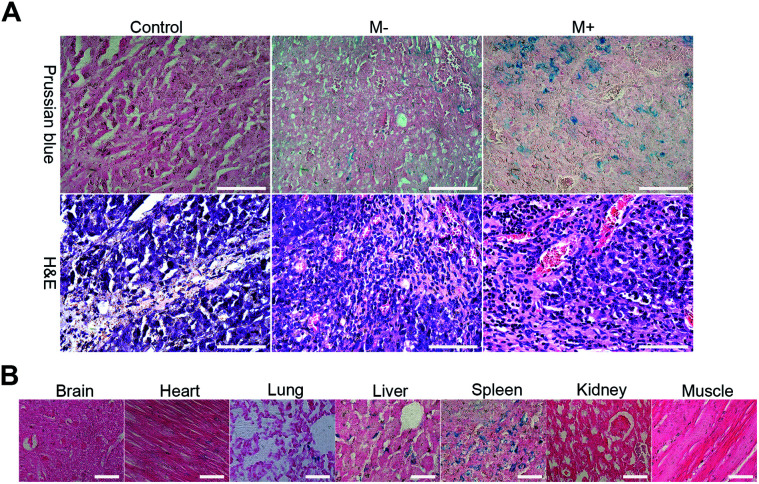
Thereafter, mice were sacrificed to evaluate the targeting biodistribution of M-MZNs-DOX. Tumor and major organs were stained with Prussian blue to qualitatively analyze biodistribution and targeting and also stained with H&E to serve as reference. As shown in Fig. 8A, blue dots staining Fe in the MNPs were clearly observed in tumor tissue, suggesting targeting delivery of the NPs into tumor tissues after intravenously injection. Importantly, blue dots are significantly more in the tumor under magnetic field (group of M+) than that without the magnetic field (group of M−) (5.48 ± 0.90 vs. 2.84 ± 0.40 in average positive staining area percentage measured by Image J software, P value < 0.05), indicating magnetic field can enhance tumor targeting of the as-made MNPs. Besides, blue stains mainly existed in the liver, spleen, while they were absent in brain, heart, kidney and muscle tissues, as observed in Fig. 8B. This indicates that the as-fabricated MNPs were partially nonspecifically uptaken by liver and spleen, which are abundant in phagocytes, namely Kupffer cells and macrophages.
Fig. 8. Biodistribution and targeting ability. (A) Images of tumor slices with standard Prussian blue and H&E staining from mice 3 h after intravenous injection with saline (control) and M-MZNs-DOX without magnetic field (M−) or with an external magnet on the site of tumor for the first 1 h (M+). Scale bars represent 100 μm. (B) Prussian blue stained images of the major organs from mice 3 h after intravenous injection with M-MZNs-DOX. Scale bars represent 50 μm.
As is well known, NPs can passively accumulate into the tumor site due to the enhanced permeability and retention (EPR) effect, whereby the leakiness of malformed vasculature in cancer as well as poor lymphatic drainage, enable NPs leak into the tumor matrix from circulation.54,55 Recent studies suggested that the external stimulus of magnetic field on the tumor site could enhance this passive tumor targeting of MNPs and thus direct delivery to the tumor through this magnetic targeting.13,17 In this study, NPs were mainly located in the perivascular region as displayed on the H&E histological images in both the magnetic and non-magnetic group (Fig. 8A). This result confirmed passive tumor targeting of the as-made MNPs mediated by EPR and magnetic targeting through enhancing EPR by external magnet.
Magnetic targeting anticancer experiments of M-MZNs-DOX in vivo
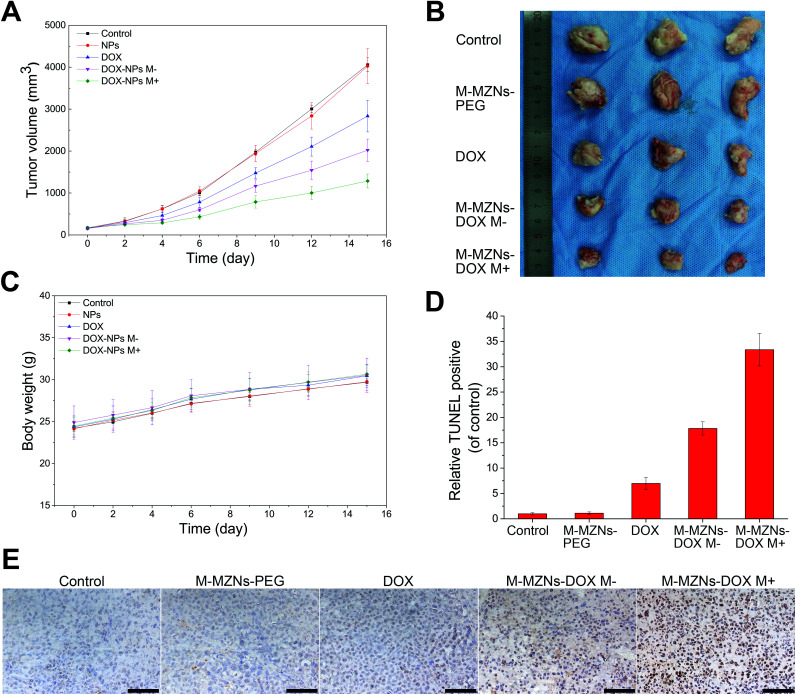
Encouraged by the excellent properties of the as-made MNPs demonstrated from the above results, including biocompatibility, pH sensitive drug release, magnetic enhanced endocytosis in vitro and magnetic tumor targeting in vivo, we further carried out magnetic targeting chemotherapy in vivo on H22 tumor bearing mice. Fifteen mice with mean tumor volume of 162 ± 20 mm3 were randomly separated into five groups: (1) a control group injected with saline (control); (2) M-MZNs-PEG treated group; (3) free DOX treated group; (4) M-MZNs-DOX treated group without external magnetic field (M−); (5) M-MZNs-DOX treated group with an external magnetic field (M+). Free DOX (2 mg kg−1) or M-MZNs-DOX (equally containing 2 mg kg−1 of DOX) were injected via caudal vein every 4 days for 4 times. As shown in Fig. 9A and B, M-MZNs-PEG showed no anti-cancer effect compared with the control group, while free DOX and M-MZNs-DOX exhibited similar tumor inhibition effect. This result indicates that M-MZNs-PEG can effectively delivery DOX to tumor site. Moreover, the therapeutic effect in the group of M-MZNs-DOX M+ was better than that in the previous groups. This result show that the drug delivery effect can be enhanced by the magnetic field. During the experiment span, body weights of the mice increase steadily with similar variation in mean among all the groups (Fig. 9C). The above results suggested that M-MZNs-DOX can effectively inhibits the tumor growth without obvious side effect and its efficacy can be enhanced by magnetic field.
Fig. 9. Magnetic field enhanced anti-cancer effects of M-MZNs-DOX in H22 tumor bearing mice. (A) Tumor volume curve of mice treated with (control) saline, M-MZNs-PEG, DOX, M-MZNs-DOX (M−) in the absence and (M+) presence of magnetic field after 4 times of intravenous injection. (B) Photographs of tumors excised from mice after treatments. (C) Changes in body weights of mice in the five groups during treatment. (D) Tumor apoptosis analysis and (E) histological images of tumor slices from mice in the five groups with standard TUNEL staining. Scale bars represent 50 μm.
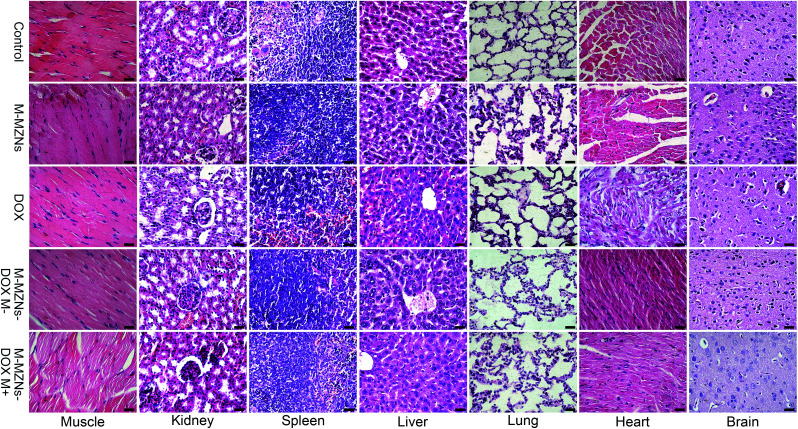
Magnetic targeting antitumor effect of M-MZNs-DOX treatment was further analyzed by staining apoptotic cells with TUNEL method. As revealed in Fig. 9D and E, more apoptosis occurred in magnetic targeting group than in the group without magnetic field. H&E staining was used to assess the influences of the treatment on the histopathology of the major organs, including muscle, kidney, spleen, liver, lung, heart, and brain. As shown in Fig. 10, no pathological damages is observed in all of the tissues from all the groups, demonstrating good biosafety of M-MZNs-DOX.
Fig. 10. Effect of M-MZNs-DOX on histopathology of the major organs. Histological images of major organs, including muscle, kidney, spleen, liver, lung, heart, and brain, from H22 tumor-bearing mice treated with (control) saline, M-MZNs-PEG, DOX, M-MZNs-DOX in the absence (M−) and (M+) presence of magnetic field after 4 times of intravenous injection. Tissues were stained with H&E. Scale bars represent 50 μm.
Taken all the above results together and literatures, M-MZNs-DOX was targeted delivered into the tumor site through enhanced EPR by external magnetic field and internalized in cancer cells. DOX was pH-sensitively released in the tumor site, went into nuclei and intercalated into the DNA molecules. The interaction of DOX with DNA inhibited transcription as well as replication, caused cancer cell apoptosis and then finally inhibited tumor growth.56
Conclusions
In summary, we developed a novel modified core-porous shell MNP with a facile “outside-to-inside”method where multiple magnetic cores grew inside the mesoporous hollow ZrO2 nanospheres. This synthesis method is cheap and easy. The as-made M-MZN possesses well pore structures, payload capacity, magnetic property, and biocompatibility. Such M-MZNs-PEG exhibits CT/MRI dual modal imaging and could be used as a pH sensitive drug delivery for DOX. This novel nanodrug showed magnetic targeting anticancer effect in tumor bearing mice without obvious side effects. Our work provides a new strategy for cancer theranostics using MNPs of dual modal imaging and magnetic targeting abilities.
Conflicts of interest
There are no conflicts to declare.
Supplementary Material
Acknowledgments
This work was financially supported by a grant from the National Natural Science Foundation of China (81630053) and National Key R&D Program of China (2018YFC0115500, 2018YFC0115504).
Electronic supplementary information (ESI) available. See DOI: 10.1039/c9ra01063g
References
- Li C. Nat. Mater. 2014;13:110–115. doi: 10.1038/nmat3877. [DOI] [PMC free article] [PubMed] [Google Scholar]
- Sharma R. Mody N. Agrawal U. Vyas S. P. Mini-Rev. Med. Chem. 2017;17:1746–1757. doi: 10.2174/1389557516666160219122524. [DOI] [PubMed] [Google Scholar]
- Nabil G. Bhise K. Sau S. Atef M. El-Banna H. A. Iyer A. K. Drug Discovery Today. 2018;24:462–491. doi: 10.1016/j.drudis.2018.08.009. [DOI] [PMC free article] [PubMed] [Google Scholar]
- Li X. Kim J. Yoon J. Chen X. Adv. Mater. 2017;29:1606857. doi: 10.1002/adma.201606857. [DOI] [PMC free article] [PubMed] [Google Scholar]
- Sikkandhar M. Nedumaran A. Ravichandar R. Singh S. Santhakumar I. Goh Z. Mishra S. Archunan G. Gulyas B. Padmanabhan P. Int. J. Mol. Sci. 2017;18:1036. doi: 10.3390/ijms18051036. [DOI] [PMC free article] [PubMed] [Google Scholar]
- Ryu J. H. Lee S. Son S. Kim S. H. Leary J. F. Choi K. Kwon I. C. J. Controlled Release. 2014;190:477–484. doi: 10.1016/j.jconrel.2014.04.027. [DOI] [PubMed] [Google Scholar]
- Choudhury P. Gupta M. Curr. Radiopharm. 2017;10:166–170. doi: 10.2174/1874471010666170728094008. [DOI] [PubMed] [Google Scholar]
- Ling D. Hyeon T. Small. 2013;9:1450–1466. doi: 10.1002/smll.201202111. [DOI] [PubMed] [Google Scholar]
- Liu G. Gao J. H. Ai H. Chen X. Y. Small. 2013;9:1533–1545. doi: 10.1002/smll.201201531. [DOI] [PubMed] [Google Scholar]
- Cardoso V. F. Francesko A. Ribeiro C. Banobre-Lopez M. Martins P. Lanceros-Mendez S. Adv. Healthcare Mater. 2018;7:1700845. doi: 10.1002/adhm.201700845. [DOI] [PubMed] [Google Scholar]
- Mosayebi J. Kiyasatfar M. Laurent S. Adv. Healthcare Mater. 2017;6:1700306. doi: 10.1002/adhm.201700306. [DOI] [PubMed] [Google Scholar]
- Hu Y. Mignani S. Majoral J.-P. Shen M. Shi X. Chem. Soc. Rev. 2018;47:1874–1900. doi: 10.1039/C7CS00657H. [DOI] [PubMed] [Google Scholar]
- Shao D. Li J. Zheng X. Pan Y. Wang Z. Zhang M. Chen Q. X. Dong W. F. Chen L. Biomaterials. 2016;100:118–133. doi: 10.1016/j.biomaterials.2016.05.030. [DOI] [PubMed] [Google Scholar]
- Venugopal I. Pernal S. Duproz A. Bentley J. Engelhard H. Linninger A. Mater. Res. Express. 2016;3:095010. doi: 10.1088/2053-1591/3/9/095010. [DOI] [Google Scholar]
- Arachchige M. P. Laha S. S. Naik A. R. Lewis K. T. Naik R. Jena B. P. Micron. 2017;92:25–31. doi: 10.1016/j.micron.2016.10.005. [DOI] [PubMed] [Google Scholar]
- Feng L. L. Yang D. He F. Gai S. L. Li C. X. Dai Y. L. Yang P. P. Adv. Healthcare Mater. 2017;6:13. doi: 10.1002/adhm.201700502. [DOI] [PubMed] [Google Scholar]
- Zhan J. Ma Z. Wang D. Li X. Li X. Le L. Kang A. Hu P. She L. Yang F. Int. J. Nanomed. 2017;12:2733–2748. doi: 10.2147/IJN.S127528. [DOI] [PMC free article] [PubMed] [Google Scholar]
- Tan G. Li W. Cheng J. Wang Z. Wei S. Jin Y. Guo C. Qu F. Photochem. Photobiol. Sci. 2016;15:1567–1578. doi: 10.1039/C6PP00340K. [DOI] [PubMed] [Google Scholar]
- Rao L. Cai B. Bu L. L. Liao Q. Q. Guo S. S. Zhao X. Z. Dong W. F. Liu W. ACS Nano. 2017;11:3496–3505. doi: 10.1021/acsnano.7b00133. [DOI] [PubMed] [Google Scholar]
- Yan D. W. Liu X. J. Deng G. Y. Yuan H. K. Wang Q. G. Zhang L. J. Lu J. J. Colloid Interface Sci. 2018;530:547–555. doi: 10.1016/j.jcis.2018.07.001. [DOI] [PubMed] [Google Scholar]
- Pan P. F. Lin Y. W. Gan Z. X. Luo X. B. Zhou W. P. Zhang N. J. Appl. Phys. 2018;123:6. doi: 10.1063/1.5019598. [DOI] [Google Scholar]
- Guo H. Y. Sun H. M. Zhu H. D. Guo H. L. Sun H. H. New J. Chem. 2018;42:7119–7124. doi: 10.1039/C8NJ00454D. [DOI] [Google Scholar]
- Shetake N. G. Kumar A. Gaikwad S. Ray P. Desai S. Ningthoujam R. S. Vatsa R. K. Pandey B. N. Int. J. Hyperthermia. 2015;31:909–919. doi: 10.3109/02656736.2015.1075072. [DOI] [PubMed] [Google Scholar]
- Hedayatnasab Z. Abnisa F. Daud W. Mater. Des. 2017;123:174–196. doi: 10.1016/j.matdes.2017.03.036. [DOI] [Google Scholar]
- Das P. Colombo M. Prosperi D. Colloids Surf., B. 2018;174:42–55. doi: 10.1016/j.colsurfb.2018.10.051. [DOI] [PubMed] [Google Scholar]
- Wang H. Wang K. Tian B. Revia R. Mu Q. Jeon M. Chang F.-C. Zhang M. Small. 2016;12:6388–6397. doi: 10.1002/smll.201602263. [DOI] [PMC free article] [PubMed] [Google Scholar]
- Di Corato R. Bealle G. Kolosnjaj-Tabi J. Espinosa A. Clement O. Silva A. K. A. Menager C. Wilhelm C. ACS Nano. 2015;9:2904–2916. doi: 10.1021/nn506949t. [DOI] [PubMed] [Google Scholar]
- Gupta J. Mohapatra J. Bhargava P. Bahadur D. Dalton Trans. 2016;45:2454–2461. doi: 10.1039/C5DT04135J. [DOI] [PubMed] [Google Scholar]
- Gupta J. Bhargava P. Bahadur D. J. Appl. Phys. 2014;115:17b516. doi: 10.1063/1.4866080. [DOI] [Google Scholar]
- Li E. Yang Y. Hao G. Yi X. Zhang S. Pan Y. Xing B. Gao M. Nanotheranostics. 2018;2:233–242. doi: 10.7150/ntno.25565. [DOI] [PMC free article] [PubMed] [Google Scholar]
- Tang X.-l. Jing F. Lin B.-l. Cui S. Yu R.-t. Shen X.-d. Wang T.-w. ACS Appl. Mater. Interfaces. 2018;10:15001–15011. doi: 10.1021/acsami.7b19797. [DOI] [PubMed] [Google Scholar]
- Sun Z. Zhou X. Luo W. Yue Q. Zhang Y. Cheng X. Li W. Kong B. Deng Y. Zhao D. Nano Today. 2016;11:464–482. doi: 10.1016/j.nantod.2016.07.003. [DOI] [Google Scholar]
- Karpuz M. Silindir-Gunay M. Ozer A. Y. Cancer Biother. Radiopharm. 2018;33:39–51. doi: 10.1089/cbr.2017.2378. [DOI] [PubMed] [Google Scholar]
- O'Farrell A. C. Shnyder S. D. Marston G. Coletta P. L. Gill J. H. Br. J. Pharmacol. 2013;169:719–735. doi: 10.1111/bph.12155. [DOI] [PMC free article] [PubMed] [Google Scholar]
- Eisenhauer E. A. Therasse P. Bogaerts J. Schwartz L. H. Sargent D. Ford R. Dancey J. Arbuck S. Gwyther S. Mooney M. Rubinstein L. Shankar L. Dodd L. Kaplan R. Lacombe D. Verweij J. Eur. J. Cancer. 2009;45:228–247. doi: 10.1016/j.ejca.2008.10.026. [DOI] [PubMed] [Google Scholar]
- Seymour L. Bogaerts J. Perrone A. Ford R. Schwartz L. H. Mandrekar S. Lin N. U. Litiere S. Dancey J. Chen A. Hodi F. S. Therasse P. Hoekstra O. S. Shankar L. K. Wolchok J. D. Ballinger M. Caramella C. de Vries E. G. E. Grp R. W. Lancet Oncol. 2017;18:E143–E152. doi: 10.1016/S1470-2045(17)30074-8. [DOI] [PMC free article] [PubMed] [Google Scholar]
- Cai H. Li K. Shen M. Wen S. Luo Y. Peng C. Zhang G. Shi X. J. Mater. Chem. 2012;22:15110–15120. doi: 10.1039/C2JM16851K. [DOI] [Google Scholar]
- Narayanan S. Sathy B. N. Mony U. Koyakutty M. Nair S. V. Menon D. ACS Appl. Mater. Interfaces. 2012;4:251–260. doi: 10.1021/am201311c. [DOI] [PubMed] [Google Scholar]
- Li J. Zheng L. Cai H. Sun W. Shen M. Zhang G. Shi X. ACS Appl. Mater. Interfaces. 2013;5:10357–10366. doi: 10.1021/am4034526. [DOI] [PubMed] [Google Scholar]
- Zhu J. Wang J. Wang X. Zhu J. Yang Y. Tian J. Cui W. Ge C. Li Y. Pan Y. Gu H. J. Mater. Chem. B. 2015;3:6905–6910. doi: 10.1039/C5TB00775E. [DOI] [PubMed] [Google Scholar]
- Cao Y. He Y. Liu H. Luo Y. Shen M. Xia J. Shi X. J. Mater. Chem. B. 2015;3:286–295. doi: 10.1039/C4TB01542H. [DOI] [PubMed] [Google Scholar]
- Tseng Y.-J. Chou S.-W. Shyue J.-J. Lin S.-Y. Hsiao J.-K. Chou P.-T. ACS Nano. 2016;10:5809–5822. doi: 10.1021/acsnano.5b08130. [DOI] [PubMed] [Google Scholar]
- Sanchez A. Paredes K. O. Ruiz-Cabello J. Martinez-Ruiz P. Pingarron J. M. Villalonga R. Filice M. ACS Appl. Mater. Interfaces. 2018;10:31032–31043. doi: 10.1021/acsami.8b10452. [DOI] [PubMed] [Google Scholar]
- Cheng Z. Al Zaki A. Hui J. Z. Muzykantov V. R. Tsourkas A. Science. 2012;338:903–910. doi: 10.1126/science.1226338. [DOI] [PMC free article] [PubMed] [Google Scholar]
- Long D. Liu T. Tan L. Shi H. Liang P. Tang S. Wu Q. Yu J. Dou J. Meng X. ACS Nano. 2016;10:9516–9528. doi: 10.1021/acsnano.6b04749. [DOI] [PubMed] [Google Scholar]
- Mao J. Tang S. Hong D. Zhao F. Niu M. Han X. Qi J. Bao H. Jiang Y. Fu C. Long D. Meng X. Su H. Nanoscale. 2017;9:3429–3439. doi: 10.1039/C6NR09862B. [DOI] [PubMed] [Google Scholar]
- Massart R. IEEE Trans. Magn. 1981;17:1247–1248. doi: 10.1109/TMAG.1981.1061188. [DOI] [Google Scholar]
- Chang Y. C. Chen D. H. J. Colloid Interface Sci. 2005;283:446–451. doi: 10.1016/j.jcis.2004.09.010. [DOI] [PubMed] [Google Scholar]
- Shao D. Wang Z. Dong W.-f. Zhang X. Zheng X. Xiao X.-a. Wang Y.-s. Zhao X. Zhang M. Li J. Huo Q.-s. Chen L. Chem. Biol. Drug Des. 2015;86:1548–1553. doi: 10.1111/cbdd.12622. [DOI] [PubMed] [Google Scholar]
- Gillies R. J. Robey I. Gatenby R. A. J. Nucl. Med. 2008;49:24S–42S. doi: 10.2967/jnumed.107.047258. [DOI] [PubMed] [Google Scholar]
- Huth S. Lausier J. Gersting S. W. Rudolph C. Plank C. Welsch U. Rosenecker J. J. Gene Med. 2004;6:923–936. doi: 10.1002/jgm.577. [DOI] [PubMed] [Google Scholar]
- Vivero-Escoto J. L. Slowing I. I. Trewyn B. G. Lin V. S. Y. Small. 2010;6:1952–1967. doi: 10.1002/smll.200901789. [DOI] [PubMed] [Google Scholar]
- Chen Z. Li Z. Lin Y. Yin M. Ren J. Qu X. Biomaterials. 2013;34:1364–1371. doi: 10.1016/j.biomaterials.2012.10.060. [DOI] [PubMed] [Google Scholar]
- Matsumura Y. Maeda H. Cancer Res. 1986;46:6387–6392. [PubMed] [Google Scholar]
- Maeda H. Nakamura H. Fang J. Adv. Drug Delivery Rev. 2013;65:71–79. doi: 10.1016/j.addr.2012.10.002. [DOI] [PubMed] [Google Scholar]
- Cagel M. Grotz E. Bernabeu E. Moretton M. A. Chiappetta D. A. Drug Discovery Today. 2017;22:270–281. doi: 10.1016/j.drudis.2016.11.005. [DOI] [PubMed] [Google Scholar]
Associated Data
This section collects any data citations, data availability statements, or supplementary materials included in this article.


