Abstract
Pollution by antibiotics has become a serious threat to public health. In this study, agricultural waste, corn husk, in the form of biochar, was utilized for antibiotic removal from wastewater. Two kinds of iron-loaded biochars, impregnation–pyrolysis biochar (IP) and pyrolysis–impregnation biochar (PI), were synthesized to adsorb the typical antibiotics tetracycline (TC) and levofloxacin (LEV). PI contained amorphous hydrated iron oxide, whereas the major component of IP was γ-Fe2O3. Compared with IP, PI had a much higher adsorption capacity for both TC and LEV. This was because PI could provide more –OH, especially –OHads, to serve as the adsorption sites. In comparison with TC, –OH was prone to combine with LEV. FT-IR and XPS results indicated that the mechanisms of LEV adsorption included hydrogen bonding, F-replacement, electrostatic attraction and bridging bidentate complexation. TC adsorption may involve complexation, hydrogen bonding and electrostatic attraction.
The possible adsorption mechanisms.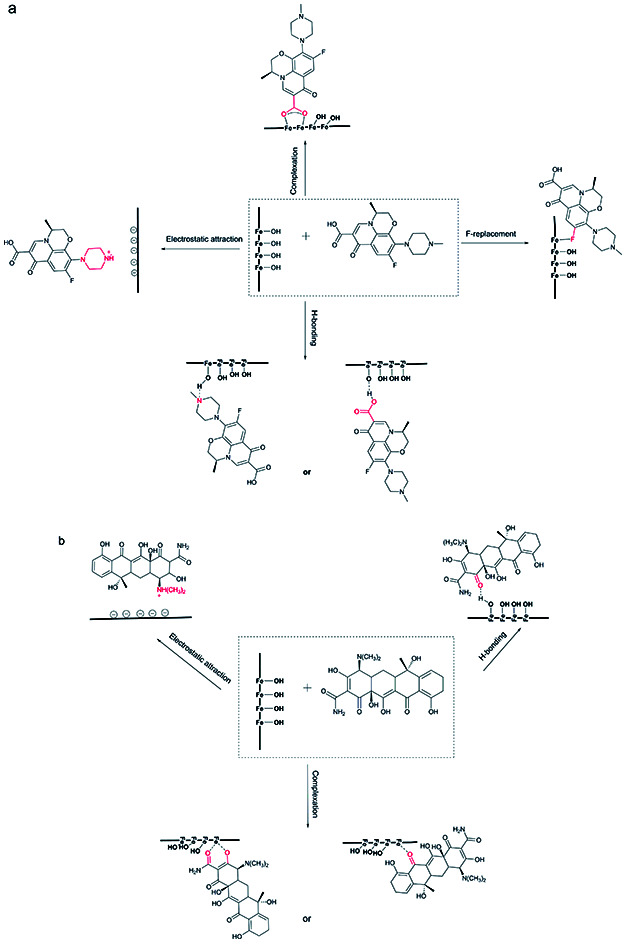
1. Introduction
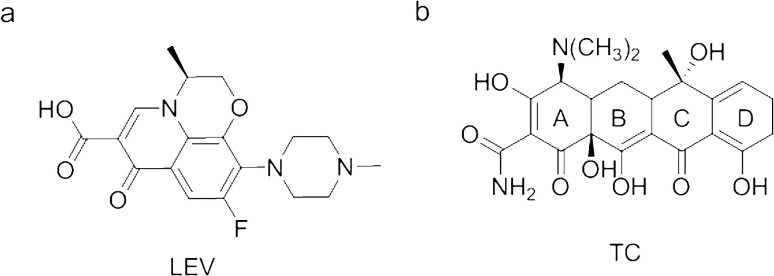
Antibiotics are extensively used in treating infective diseases for both humans and animals. Levofloxacin (LEV) and tetracycline (TC) (Fig. 1) are two typical and commonly used antibiotics. LEV is a fluoroquinolone antibiotic, which is generally utilized to treat gastrointestinal tract, genitourinary and respiratory infections.1 TC is used for the treatment of inflammatory bowel disease and acne.2 However, owing to the improper treatment of pharmaceutical wastewater, its abuse in food additives used for livestock breeding or animal husbandry, and incomplete metabolism in human and animal bodies, excessive antibiotics are discharged into the environment.3 As a result, they have been frequently detected in different environments and even in drinking water. Animals and humans could absorb excess environmental antibiotics through the water and food chains, resulting in antibiotic resistance.4,5 On the other hand, the conventional biological wastewater treatment was not appropriate for antibiotic removal, due to their toxic effects on microorganisms.4 Consequently, cost-effective approaches for LEV and TC removal from wastewater are urgently needed.
Fig. 1. The structures of LEV (a) and TC (b).
Adsorption is considered as one of the most applicable technologies because it is safety, economical and simple. Several adsorbents have been tested to adsorb LEV or TC, such as chitosan, montmorillonite, graphene-based materials.5,6 To achieve the aims of low-cost, corn husks, the agricultural waste, were selected as the major part of the adsorbent. It could not only reduce the antibiotics pollution but also supply an additional method for corn husks reuse. In addition, corn is a worldwide and plentiful crop, which makes it cheap and easy to obtain. For adsorption capacity enhancement and recovery improvement, the corn husks were transformed into biochar and Fe, which was magnetic and non-toxic, was employed for the biochar modification. In summary, iron modified-biochars advocate the concept of disposal waste with waste. The corn husks are easy to obtain and cheap and they are harmless to the environment. In addition, they can remove antibiotics high-efficiently from aqueous solution. Furthermore, they can be recycled and reuse, which still maintains high adsorption capacities.
In this study, two kinds of Fe-loaded biochars with different forms of Fe oxide were prepared for LEV and TC removal. The adsorption performances were investigated and compared. The possible adsorption mechanisms were analyzed based on X-ray Diffraction (XRD), X-ray Photoelectron Spectroscopy (XPS) and Fourier Transform Infrared Spectroscopy (FTIR) results.
2. Material and methods
2.1. Materials
LEV (>98.5%) and TC (>98.5%) were purchased from TCI company. Corn husks were acquired from Shandong Province, China. The type of corn was Liangyu 99. Ferric chloride hexahydrate (FeCl3·6H2O) and other chemicals were analytical grades and purchased from Aladdin company.
2.2. The preparation of adsorbents
The raw corn husks were washed with deionized water, and then dried in oven at 100 ± 5 °C for 24 h. After cooling down to room temperature, the corn husks were ground to 60–100 mesh with a disintegrator.
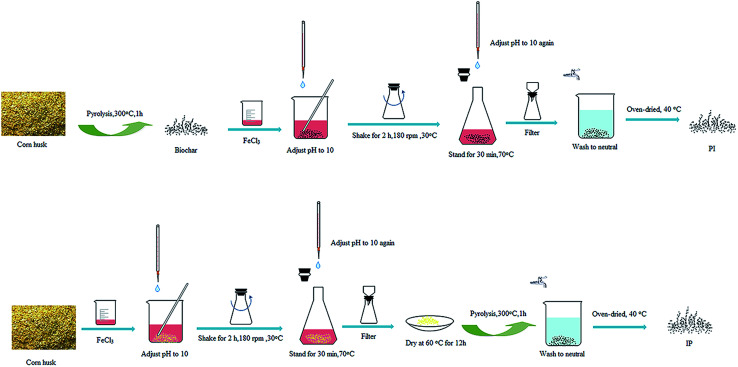
The modification for the two types of Fe-biochars both included the following three operations, but in a different order. (1) Impregnation: 40.545 g FeCl3·6H2O was dissolved into 500 mL deionized water, and put 8.377 g biomass into the solution (the mass ratio of total iron to biomass was 1 : 1). Then, the pH value was adjusted to 10. The mixture was placed in a shaker for 2 h with 180 rpm at 30 °C, and next, pH was adjusted to 10 again. The obtained mixture was deposited at 70 °C for 0.5 h. After cooling to room temperature, the solid–liquid mixture was filtered and the obtained solid was dried at 60 °C for 12 h. (2) Pyrolysis: the pyrolysis temperature was raised to 300 °C at a rate of 5 °C min−1 and maintained for 1 h. During this process, nitrogen gas was passed over to isolate oxygen with the rate of 200 mL min−1 in the muffle furnace. After that, it was cooled to room temperature. (3) Drying: the solid residues were washed with distilled water and dried at 40 °C.
If the corn husks were modified as the order above, it was defined as the impregnation–pyrolysis biochar (IP). If it was in the sequence of (2) (1) (3), the product was the pyrolysis–impregnation biochar (PI). The operation process was shown in Fig. 2.
Fig. 2. Procedure for the preparation of PI and IP.
2.3. Adsorption experiments
0.04 g PI or IP was added to 50 mL 0.55 mol L−1 LEV (200 mg L−1) or TC (266 mg L−1) solutions in a shaking water bath for 24 h at 120 rpm and 30 °C, respectively. pH values were adjusted by HCl and NaOH solution. The adsorption kinetic and isotherm experiments were carried out under optimal initial pH values. In the kinetic experiments, samples were taken at different time intervals. Next, the supernatant was filtered through 0.22 μm filter. Then the absorbance of the supernatant was measured using ultraviolet-visible spectrophotometer at 357 nm and 287 nm for TC and LEV, respectively.7–10
To facilitate description, the adsorbed samples would be represented by abbreviations. For example, IP–LEV is the IP sample after LEV adsorption. The others were abbreviated similarly.
2.4. Regeneration and reuse
Five reuse cycles were performed to evaluate the regenerability of two modified biochars. 50 mL 0.55 mol L−1 LEV (200 mg L−1) or TC (266 mg L−1) solution was adsorbed first by 0.04 g PI or IP in a shaking water bath for 24 h at 120 rpm and 30 °C, respectively. Afterward, they were regenerated by 25 mL 0.01 mol L−1 NaOH solution and shaken at 120 rpm under 30 °C for 24 h. Next, the regenerated adsorbents was washed with deionized water and dried at 105 °C. The adsorbents were reused to remove TC or LEV for the next four cycle as described above.
2.5. Materials characterization
BET (Quantachrome, Autosorb-IQ-AG-MP) was used to explore the specific surface area and the micropore properties. The specific surface area of the modified biochars was determined by nitrogen adsorption method.11 The structure of the compounds was detected by XPS (Thermo Fisher Scientific, Escalab 250Xi) using mono-chromatized Al Kα X-ray source with a power of 100 W and pass energy of 30 eV.12,13 XRD (Bruker-Axs, D8 Advance) was utilized to character the components of Fe-loaded biochar. The samples were scanned in the range of 5–90 °C using Cu-Kα radiation at 40 kV.12,14 The modified-biochar was dissolved by nitric and hydrochloric acid, and the iron content was determined by Inductively Coupled Plasma-Atomic Emission Spectrometry (ICP-AES). The surface functional groups of sample were investigated by FTIR spectroscopy (Thermo Fisher Scientific, Nicolet-46). The powder sample was mixed with KBr, then pressed into pellets with a radius of 0.65 cm. The spectra were recorded in the mid-infrared from 4000 to 400 cm−1 with 4 cm−1 resolution.15–17
2.6. Data analysis
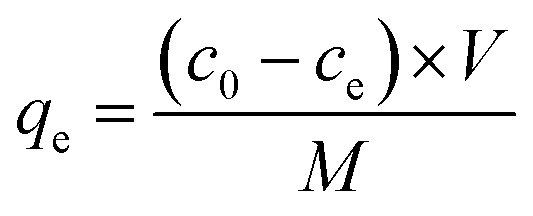
The amount of TC and LEV absorbed on Fe-loaded biochar could be calculated by the following formula.
 |
1 |
where qe (mmol g−1) is the equilibrium adsorption capacity; c0 and ce (mmol L−1) are initial and equilibrium concentrations of antibiotic; V (L) is the volume of the solution; M (g) is the mass of adsorbent.
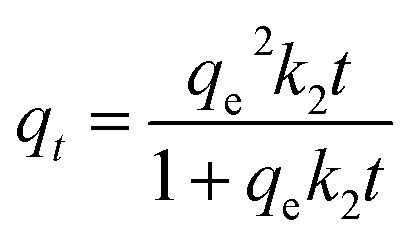
The pseudo-first-order kinetic model, the pseudo-second-order kinetic model and intra-particle diffusion model were used to fit the kinetics data. The equations were written as follows.
| qt = qe(1 − exp(−k1t)) | 2 |
 |
3 |
| qt = kit0.5 + C | 4 |
where, qt and qe (mmol g−1) are the amount of antibiotics adsorbed at time t (h) and equilibrium; k1 (h−1) and k2 (g mmol−1 h−1) are the observed rate constants of the pseudo-first-order and pseudo-second-order, respectively; ki (mmol h0.5 g−1) is intra-particle diffusion rate constant; C is the intercept reflecting the extent of the boundary layer thickness.18
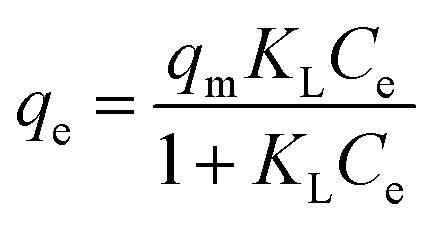
Freundlich, Langmuir and Temkin isotherm models were utilized to depict the adsorption performance.
| qe = KFCe1/n | 5 |
 |
6 |
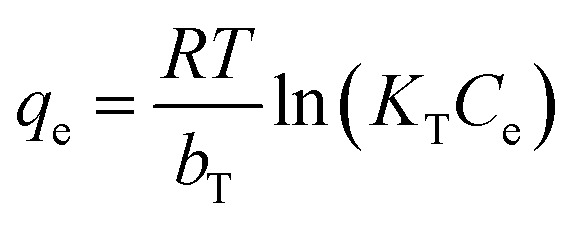 |
7 |
where KF (mmol(1−1/n) L1/n g−1) is the Freundlich constant related to the adsorption capacity; n is concerned with the adsorption intensity; KL (L mmol−1) represents the Langmuir coefficient correspond to the bonding force of adsorption; qm (mmol g−1) is the maximum adsorption capacity; KT (L mmol−1) is equilibrium bond constant related to the maximum energy of bond; bT is the Temkin isotherm constant; R and T are the universal gas constant and absolute temperature.
The difference between original adsorption amount and regenerated adsorption amount in different cycles can be calculated by the following formula.
 |
8 |
where, n is the number of cycles, Q0 (mmol g−1) is original amount, Qn (mmol g−1) is adsorption amount in cycle n.
3. Results and discussion
3.1. Characterization of biochar
3.1.1. XRD
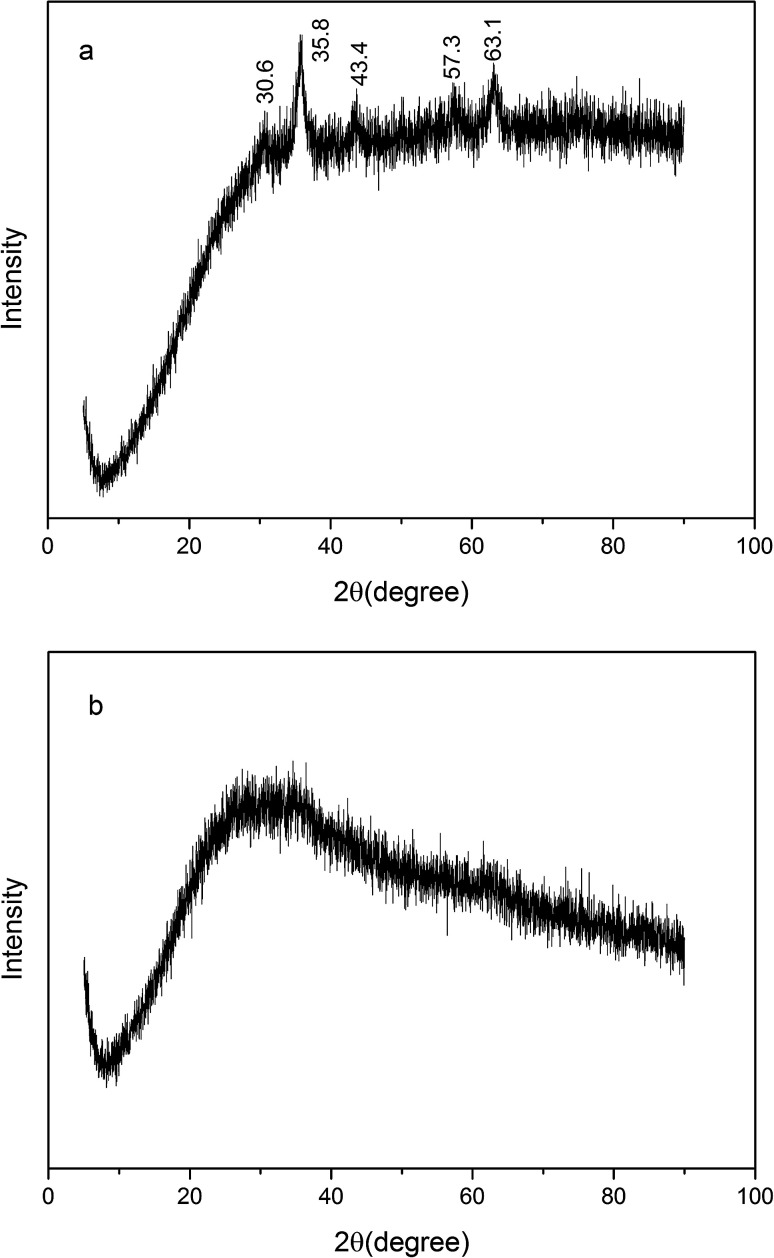
The XRD pattern (Fig. 3) of IP displayed the diffraction peaks at 30.6°, 35.8°, 43.4°, 57.3°, 63.1°, which was aligned with the standard XRD data of γ-Fe2O3,19,20 coincided with (220), (311), (400), (511) and (440) planes, respectively. In contrast, as PI, there was only a broad band, attributed to amorphous hydrous iron oxide.21,22
Fig. 3. XRD of IP (a) and PI (b).
3.2. Effects of pH
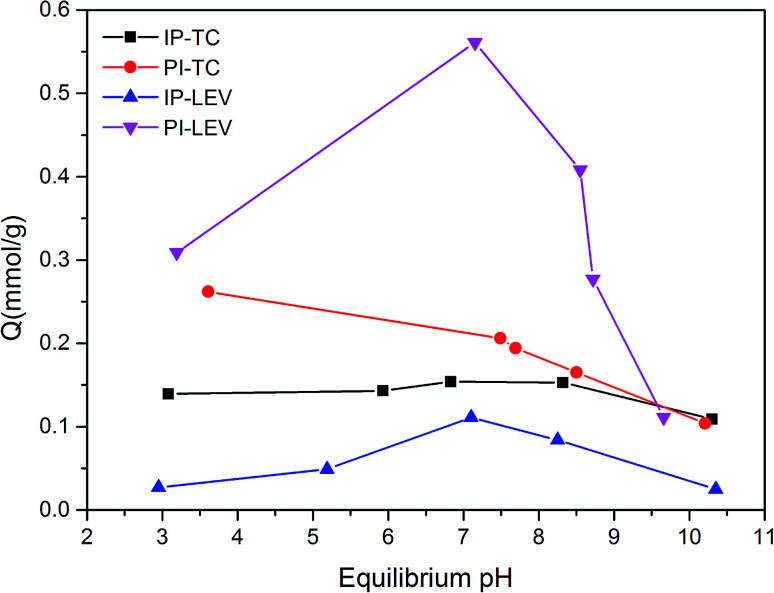
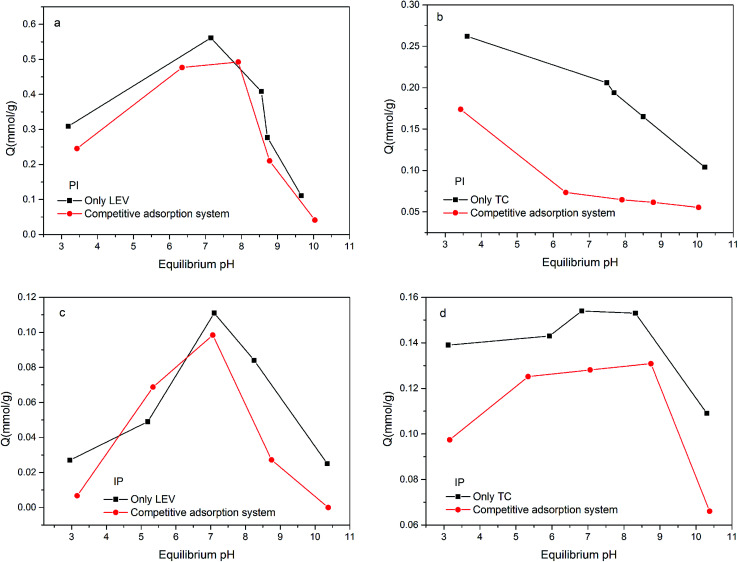
Fig. 4 illustrated the antibiotics adsorption at different equilibrium pH values. In the PI system, the amount of TC adsorption decreased as pH increased. Because the pHpzc was lower than 2.5, PI surface was negatively charged during the whole experiment. While TC existed as a cationic under lower pH, which was easy to combine with the negative sites on the PI surface.23 When pH increased, TC transformed into an anion, at which time the electrostatic repulsion enhanced, and the adsorption capacity reduced. Compared with PI, the IP adsorption capacity was much lower, especially under acid condition. This may due to the limitation of the active adsorption sites on IP.
Fig. 4. Adsorption amounts at different pH values.
For LEV, the optimal adsorption capacity appeared at around the neutral condition in both the PI and IP adsorption systems. This was probably related to synthetical effect of the deprotonated carboxyl group, which was favorable for the complexation with ferric oxide,24 and the electrostatic repulsion also. Under acidic conditions, the percentage of deprotonated carboxyl group declined, resulting in the reduced adsorption amount. During alkaline conditions, electrostatic repulsion inhibited the contact of LEV molecule with biochar, leading to the adsorption decrement.
Although PI (24.9%, 94.9 m2 g−1) contained lower Fe content and surface area than IP (54.10%, 112.45 m2 g−1), it showed a larger adsorption capacity for both TC and LEV. This implied that the Fe and surface area were not the main adsorption active sites. So other functional group may play a key role during the adsorption.
3.3. Adsorption kinetics
Adsorption kinetic was a widely used method to explore the adsorption rate. The results of the relevant parameters were listed in the Table 1. It could be seen that the pseudo-second-order model were more accurate than the pseudo-first-order model for all adsorptions, which suggested that the antibiotics adsorption on PI or IP was mainly controlled by chemical process.25 Intra-particle diffusion model described the IP removal results well, which indicated that intra-particle was the main control steps during adsorption of two antibiotics on IP.26,27
The parameters for the kinetic models of TC and LEV adsorbed to modified biochars.
| Model | Parameters | IP–LEV | IP–TC | PI–LEV | PI–TC |
|---|---|---|---|---|---|
| Pseudo-first-order | q e (mmol g−1) | 0.0964 | 0.1572 | 0.5451 | 0.2494 |
| k 1 (h−1) | 0.2081 | 0.1613 | 5.576 | 2.822 | |
| R 2 | 0.8991 | 0.9865 | 0.9492 | 0.9050 | |
| Pseudo-second-order | q e (mmol g−1) | 0.1119 | 0.1948 | 0.5686 | 0.2620 |
| k 2 (g (mmol h)−1) | 2.439 | 0.870 | 15.878 | 15.50 | |
| R 2 | 0.90417 | 0.9909 | 0.9577 | 0.9175 | |
| Intra-particle diffusion | k i (mmol h0.5 g−1) | 0.01957 | 0.03382 | 0.04312 | 0.02992 |
| C | 0.01230 | 7.102 × 10⁻⁴ | 0.4010 | 0.1405 | |
| R 2 | 0.9871 | 0.9926 | 0.5687 | 0.8254 |
3.4. Adsorption isotherms
The adsorption isotherm could explain the functional relationship between adsorption capacity and concentration. Table 2 listed the fitting results of two isotherm models. The qmax values of PI were 0.310 mmol g−1 (149.1 mg g−1) for TC and 0.757 mmol g−1 (273.7 mg g−1) for LEV respectively. Both were much higher than those of IP. In addition, compared with some other adsorbents (Table 3), PI and IP also showed the outstanding adsorption capacity.
The fitting parameters for the isotherm models of TC and LEV adsorbed to modified biochars.
| Model | Parameters | IP–LEV | IP–TC | PI–LEV | PI–TC |
|---|---|---|---|---|---|
| Langmuir | K L (L mmol−1) | 5.361 | 7.893 | 10.26 | 27.319 |
| q m (mmol g−1) | 0.1567 | 0.2120 | 0.7573 | 0.3097 | |
| R 2 | 0.7993 | 0.8797 | 0.8211 | 0.8385 | |
| Freundlich | K F (mmol(1−1/n) L1/n g−1) | 0.1532 | 0.2122 | 0.7086 | 0.3234 |
| 1/n | 0.4181 | 0.3471 | 0.1738 | 0.1409 | |
| R 2 | 0.9330 | 0.9253 | 0.8688 | 0.9436 | |
| Temkin | K T (L mmol−1) | 0.1448 | 0.2096 | 0.4105 | 0.1855 |
| b T (×103) | 52.69 | 29.22 | 4.990 | 11.15 | |
| R 2 | 0.9902 | 0.9395 | 0.8963 | 0.9823 |
Adsorption capacities of TC and LEV by different adsorbents.
| Adsorbents | Adsorbate | q m (mg g−1) | References |
|---|---|---|---|
| Chitosan | TC | 13.3 | 28 |
| Montmorillonite | TC | 54.0 | 28 |
| Bamboo charcoal | TC | 22.7 | 29 |
| Magnetic porous carbon with γ-Fe2O3 particles | TC | 25.4 | 30 |
| Carbon disulfide-modified magnetic ion-imprinted chitosan-Fe(iii) | TC | 516.3 | 5 |
| Graphene-based materials | TC | 70.0 | 31 |
| PI | TC | 149.1 (0.310 mmol g−1) | This work |
| IP | TC | 102.0 (0.212 mmol g−1) | This work |
| Iron-pillared montmorillonite | LEV | 48.6 | 4 |
| Zr-modified corn biochar | LEV | 73.1 | 32 |
| Wood chip biochars | LEV | 7.7 | 33 |
| Porous nano-cerium oxide wood chip biochar composites | LEV | 73.0 | 4 |
| PI | LEV | 273.7 (0.757 mmol g−1) | This work |
| IP | LEV | 56.6 (0.157 mmol g−1) | This work |
Freundlich model was more appropriate for the TC and LEV adsorption behaviors on the two adsorbents, indicating that the adsorption took place on heterogeneous surface, which was probably due to the different kinds of active sites.6 The n values were all greater than 2, indicating the strong interaction between the antibiotics and the modified biochars.34 In addition, the difference of LEV adsorption capacity between PI and IP was much more significant than that of TC. The Temkin isotherm model fitted the adsorption data better. This result indicated that electrostatic interaction had an effect on the interaction between modified-biochar and the two antibiotics.35,36
3.5. Adsorption mechanism
3.5.1. XPS
The XPS spectra of O1s were summarized in Table 4. For IP, deconvolution of O1s spectra produced two peaks located at 530.1 eV and 531.4 eV, corresponding to lattice-O2− and –OHlat/C–O.37,38 After TC and LEV adsorption, the ratio of –OHlat decreased from 34.38% to 27.52% and 26.62%, respectively. It indicated that the –OHlat was one of the functional groups in the adsorption process. For IP–TC, a new peak appeared at 532.8 eV, which were probably concerned with C–O from TC.39 Also, a new peak at 533.0 eV appeared for PI–LEV that was likely ascribed to the O C–O or C–O from LEV. Moreover, as can be seen from Table 5, deconvolved N1s of TC into two peaks at 399.4 eV and 401.7 eV were assigned to –NH– or –NH2 and C–N–C.6,40 After adsorption, the binding energy shifted upward to 399.8 eV and 403.2 eV, respectively, due to the protonated amines or the formation of hydrogen bonds.41,42 The F1s signal of LEV presented at 686.7 eV and was transferred to 687.3 eV after adsorption. The increase in binding energy may be attributed to the replacement of –OH and the interaction between metal and F.43
Peak positions and areas of O1s before and after adsorption by IP and PI.
| Peak position (eV) | Group | Peak area percentage (%) | |
|---|---|---|---|
| IP | 530.1 | Lattice-O2− | 65.62 |
| 531.4 | –OHlat | 34.38 | |
| IP–TC | 530.1 | Lattice-O2− | 62.22 |
| 531.4 | –OHlat/–OH from TC | 27.52 | |
| 532.8 | C–O from TC | 10.26 | |
| IP–LEV | 530.0 | Lattice-O2− | 67.55 |
| 531.3 | –OHlat/–OH from LEV | 26.62 | |
| 533.0 | O C–O/C–O from LEV | 5.830 | |
| PI | 530.1 | Lattice-O2− | 6.442 |
| 531.1 | –OHlat | 7.372 | |
| 532.3 | –OHads | 58.65 | |
| 533.6 | H2O | 27.54 | |
| PI–TC | 530.2 | Lattice-O2− | 8.755 |
| 531.6 | –OHlat/–OH from TC | 18.00 | |
| 532.3 | –OHads | 43.41 | |
| 533.5 | H2O | 29.84 | |
| PI–LEV | 530.0 | Lattice-O2− | 9.012 |
| 531.2 | –OHlat/–OH from LEV | 18.94 | |
| 532.2 | –OHads | 44.69 | |
| 533.5 | H2O | 27.36 |
XPS peak positions of samples.
| Element | Sample | Binding energy (eV) |
|---|---|---|
| F | LEV | 686.7 |
| IP–LEV | 687.3 | |
| PI–LEV | 687.2 | |
| N | TC | 399.4, 401.7 |
| IP–TC | 399.8, 403.2 | |
| PI–TC | 399.9, 402.8 |
As for the PI, the O1s were divided into three peaks, –OHlat, –OHads, and adsorbed H2O. Compared with the IP, the lattice-O2- and the –OHlat portions on PI were much lower. PI contained a large amount of –OHads. Previous studies had also stated that amorphous materials could offer more (or higher density) hydroxyl groups.44 The –OHads content reduced from 58.65% to 43.41% and 44.69% after TC and LEV adsorption, which indicated the key role of –OHads in the adsorption. The –OHlat was also thought to be one of the adsorption functional groups despite its percentage increase after adsorption, on account of overlap of the –OH from LEV or TC. Similarly as IP, the F and N binding energy values of PI both increased after adsorption.
3.5.2. FTIR
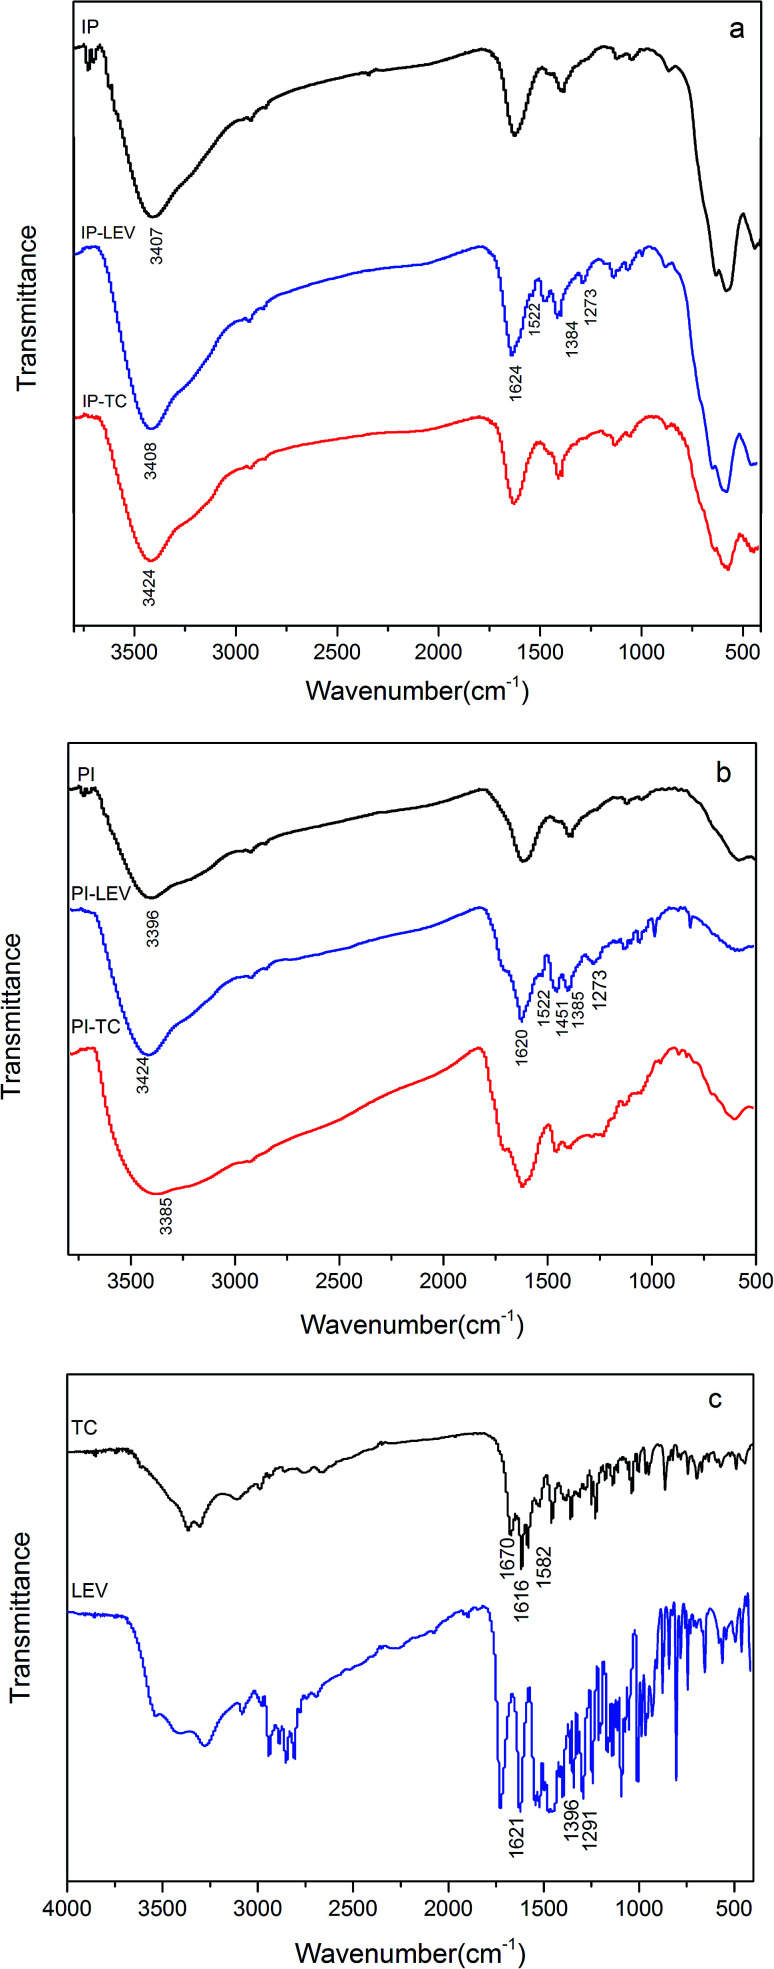
In the FTIR spectra of IP (Fig. 5), for both IP and PI, the bands between 3600–3700 cm−1 were concerned with terminal-bonded hydroxyl group.45 The wavenumber at 3407 cm−1 referred to the stretching vibration of hydroxyl, including the lattice –OH (–OHlat) and adsorbed –OH (–OHads).46,47 By contrast, the –OH peak of PI at 3400 cm−1 was broader. It could be found that the peaks between 3600–3700 cm−1 in PI and IP all disappeared after adsorption due to the reactions between terminal –OH and LEV or TC molecular. Furthermore, the –OH stretching vibrations at around 3400 cm−1 all changed after adsorption, shifting upward or downward. It might be attributable to the synthetical results of inductive effects, complexation, hydrogen bonding, protonation and the overlap of amino group peak.48–51
Fig. 5. FT-IR spectra of IP (a), PI (b) before and after adsorption, FT-IR spectra of LEV and TC (c).
Additionally, the frequency at 1291 cm−1 (Fig. 5c), assigned to the coupling of carboxylic acid C–O stretching and O–H deformation, changed to 1273 cm−1 (Fig. 5b), because Fe combined with the O atom of carboxyl. This could be confirmed by the shift of Fe–O stretching peak after LEV adsorption. The peak at 1621 cm−1 (Fig. 5c), representing the C O in LEV molecular, transferred to 1522 cm−1 (Fig. 5b) after adsorption, illustrating that C O was involved in the reaction. In addition, the bands in PI–LEV at 1624 cm−1 and 1384 cm−1 corresponded to the antisymmetric and symmetric stretching vibrations of the carboxylate group.52,53 And the Δν value was 240 cm−1. It was comparable to the free LEV (Δνfree), which was 245 cm−1, implying that the complex was the bridging-type.54,55 As for the PI–LEV FTIR spectra, the changes were very similar as the above.
For the TC spectra (Fig. 5c), the 1670 cm−1 bands were ascribed to the carbonyl of the amide in ring A of TC. The frequencies at 1616 cm−1 and 1582 cm−1 corresponded to the carbonyl groups in A and C rings, respectively. After adsorption on IP, the two peaks vanished (Fig. 5b). The FTIR spectrum of PI–TC was similar as the above. This phenomenon revealed that interaction between carbonyl (C-1 : C-3 in ring A, C-11 in ring C, amide group in ring A) and Fe.6
3.5.3. Adsorption performance comparison and competitive adsorption
As can be seen from Fig. 4, obviously, PI could adsorb more antibiotics, which indicated that PI had more active adsorption sites, including the –OH group as mentioned before. PI owned a higher portion of –OH, and correspondingly, LEV adsorption capacity was more than 4 times higher than that of IP. So, it was quite possible that –OH played the main role in the LEV adsorption.
To understand the adsorption behavior and mechanism further, competitive adsorption was investigated (Fig. 6). In the PI binary adsorption systems, LEV maintained the high adsorption capacity or only decreased slightly. It could be deduced that –OH would give priority to LEV molecular for combination rather than TC. On the other hand, TC decreased significantly in the presence of LEV, but it still remained some adsorption, demonstrating that –OH was not the only or not the most important reason for TC adsorption. Moreover, in the IP binary adsorption systems, LEV's priority was not so obvious due to less –OH in IP.
Fig. 6. The adsorption amount in the single and competitive systems: (a) LEV adsorption amount by PI; (b) TC adsorption amount by PI; (c) LEV adsorption amount by IP; (d) TC adsorption amount by IP.
3.5.4. Possible adsorption mechanisms
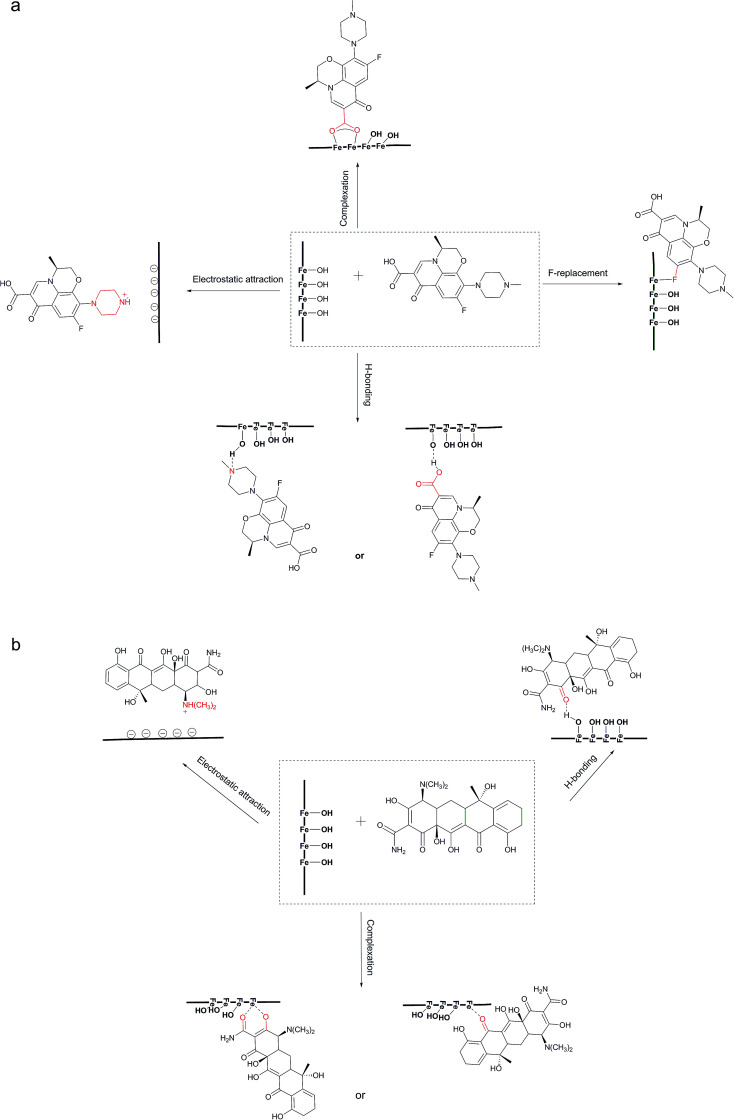
In summary, from the analysis above, the mechanisms of LEV adsorption may include bridging bidentate complexation, hydrogen bonding, F-replacement and electrostatic attraction. The first three mechanisms were all closely related to the –OH groups. The adsorption of TC was due to interaction between carbonyl and Fe, hydrogen bonding and electrostatic attraction. The adsorption mechanisms were schematically depicted in Fig. 7.
Fig. 7. Possible adsorption mechanisms for LEV (a) and TC (b).
PI with amorphous ferric oxide could provide more –OH groups, mainly in the form of –OHads, enhancing both the LEV and TC adsorption capacities. –OH groups preferred to combine with LEV molecular rather than TC. And it played the leading role in LEV adsorption, however it was not the only or not the most important reason for TC adsorption, especially at the near-neutral condition.
3.6. Regeneration and reuse analysis
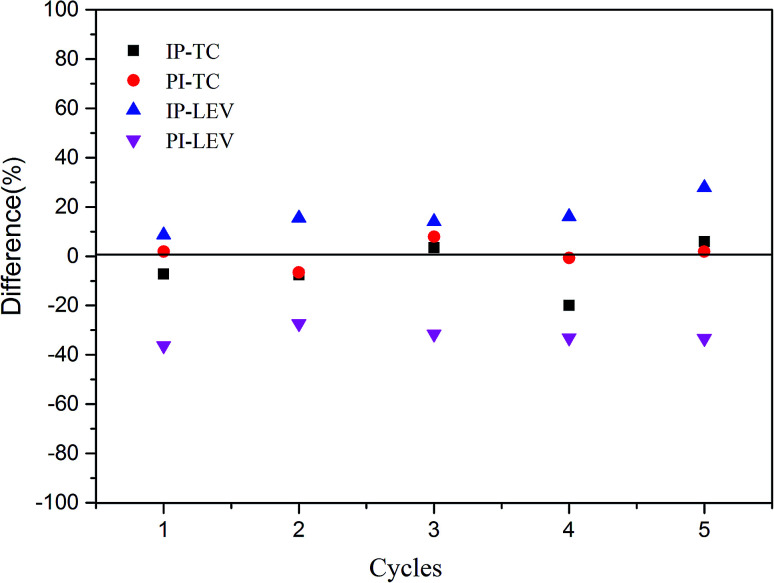
Fig. 8 showed the results in five adsorption cycles. Compared with the adsorption capacity in the first cycle, except for PI–LEV, other adsorption amounts were maintained high and stable. Compared with the original adsorption amount, the differences were less than ±20% in the reuse cycle experiments. The adsorption amount of PI–LEV decreased, but it can also be kept more than 64% of the original adsorption amount. This phenomenon manifested that the IP and PI could be reused and recycled efficiently.
Fig. 8. Reuse experiment results.
4. Conclusions
In this study, an agricultural waste, corn husk, was used as carrier to prepare adsorbents with two different forms of iron oxides. IP biochar showed lower adsorption capacity. PI, mainly covered with amorphous hydrated iron oxide, could provide more –OH, especially –OHads, as the reactive sites. Moreover, –OH was inclined to integrate with LEV in comparison with TC. FT-IR and XPS results indicated that the mechanisms of LEV adsorption were the hydrogen bonding, F-replacement, electrostatic attraction and bridging bidentate complexation. TC adsorption may involve complexation, hydrogen bonding, electrostatic attraction.
Conflicts of interest
There are no conflicts to declare.
Supplementary Material
Acknowledgments
This research was supported by the Fundamental Research Funds for the Central Universities (2632019FY02), the Jiangsu Overseas Visiting Scholar Program for University Prominent Young & Middle-aged Teachers and Presidents, the Qing Lan Project, Natural Science Foundation of Jiangsu Province (BK20160744), National Natural Science Foundation of China (21707166) and the College Students Innovation Project for the R&D of Novel Drugs (J1310032).
References
- Sousa I. Claro V. Pereira J. L. Amaral A. L. Cunha S. L. Castro B. Feio M. J. Pereira E. Gameiro P. Synthesis, characterization and antibacterial studies of a copper (II) levofloxacin ternary complex. J. Inorg. Nucl. Chem. 2012;110:64. doi: 10.1016/j.jinorgbio.2012.02.003. [DOI] [PubMed] [Google Scholar]
- Margolis D. J. Fanelli M. Hoffstad O. Lewis J. D. Potential association between the oral tetracycline class of antimicrobials used to treat acne and inflammatory bowel disease. Am. J. Gastroenterol. 2010;105:2610. doi: 10.1038/ajg.2010.303. [DOI] [PubMed] [Google Scholar]
- Zhou Y. Y. Liu X. C. Xiang Y. J. Tang L. Modification of biochar derived from sawdust and its application in removal of tetracycline and copper from aqueous solution: Adsorption mechanism and modelling. Bioresour. Technol. 2017;245:266. doi: 10.1016/j.biortech.2017.08.178. [DOI] [PubMed] [Google Scholar]
- Liu Y. N. Dong C. X. Wei H. Yuan W. H. Li K. B. Adsorption of levofloxacin onto an iron-pillared montmorillonite (clay mineral): kinetics, equilibrium and mechanism. Appl. Clay Sci. 2015;118:301. doi: 10.1016/j.clay.2015.10.010. [DOI] [Google Scholar]
- Chen A. W. Shang C. Shao J. H. Lin Y. Q. Luo S. Zhang J. C. Huang H. L. Lei M. Zeng Q. R. Carbon disulfide-modified magnetic ion-imprinted chitosan-Fe(III): A novel adsorbent for simultaneous removal of tetracycline and cadmium. Carbohydr. Polym. 2017;155:19. doi: 10.1016/j.carbpol.2016.08.038. [DOI] [PubMed] [Google Scholar]
- Zhang Z. Y. Liu H. J. Wu L. Y. Lan H. C. Qu J. H. Preparation of amino-Fe(III) functionalized mesoporous silica for synergistic adsorption of tetracycline and copper. Chemosphere. 2015;138:625. doi: 10.1016/j.chemosphere.2015.07.014. [DOI] [PubMed] [Google Scholar]
- Vazquez A. Uresti D. B. H. Obregon S. Electrophoretic deposition of CdS coatings and their photocatalytic activities in the degradation of tetracycline antibiotic. Appl. Surf. Sci. 2016;386:412. doi: 10.1016/j.apsusc.2016.06.034. [DOI] [Google Scholar]
- Li J. H. Han M. S. Guo Y. Wang F. Meng L. J. Mao D. J. Ding S. S. Sun C. Hydrothermal synthesis of novel flower-like BiVO4/Bi2Ti2O7 with superior photocatalytic activity toward tetracycline removal. Appl. Catal., A. 2016;524:105. doi: 10.1016/j.apcata.2016.06.025. [DOI] [Google Scholar]
- Nazar M. F. Azeem W. Rana U. A. Ashfaq M. Lashin A. Arifi N. Rahman H. M. A. U. Lazim A. M. Mahmood A. pH-dependent probing of levofloxacin assimilated in surfactant mediated assemblies: Insights from photoluminescent and chromatographic measurements. J. Mol. Liq. 2016;220:26. doi: 10.1016/j.molliq.2016.04.044. [DOI] [Google Scholar]
- Song Z. L. Ma Y. J. Xia G. G. Wang Y. Kapadia W. Sun Z. Y. Wu W. Gu H. C. Cui W. G. Huang X. Y. In vitro and in vivo combined antibacterial effect of levofloxacin/silver co-loaded electrospun fibrous membranes. J. Mater. Chem. B. 2017;5:7632. doi: 10.1039/C7TB01243H. [DOI] [PubMed] [Google Scholar]
- Walton K. S. Snurr R. Q. Applicability of the BET Method for Determining Surface Areas of Microporous Metal-Organic Frameworks. J. Am. Chem. Soc. 2007;27:8552. doi: 10.1021/ja071174k. [DOI] [PubMed] [Google Scholar]
- Wei H. W. Feng Q. Y. Yang H. Alam E. Gao B. Gu D. Modified biochar supported Ag/Fe nanoparticles used for removal of cephalexin in solution: Characterization, kinetics and mechanisms. Colloids Surf., A. 2017;517:63. doi: 10.1016/j.colsurfa.2017.01.005. [DOI] [Google Scholar]
- Yuan Y. Yuan T. Wang D. M. Tang J. H. Zhou S. G. Sewage sludge biochar as an efficient catalyst for oxygen reduction reaction in an microbial fuel cell. Bioresour. Technol. 2013;144:115. doi: 10.1016/j.biortech.2013.06.075. [DOI] [PubMed] [Google Scholar]
- Ruan Z. H. Wu J. H. Huang J. F. Lin Z. T. Li Y. F. Liu Y. L. Cao P. Y. Fang Y. P. Xie J. Jiang G. B. Facile preparation of rosin-based biochar coated bentonite for supporting α-Fe2O3 nanoparticles and its application for Cr(VI) adsorption. J. Mater. Chem. A. 2015;3:4595. doi: 10.1039/C4TA06491G. [DOI] [Google Scholar]
- Kloss S. Zehetner F. Dellantonio A. Hamid R. Ottner F. Liedtke V. Schwanninger M. Gerzabek M. H. Soja G. Characterization of Slow Pyrolysis Biochars: Effects of Feedstocks and Pyrolysis Temperature on Biochar Properties. J. Environ. Qual. 2012;41:990. doi: 10.2134/jeq2011.0070. [DOI] [PubMed] [Google Scholar]
- Richveisova B. M. Fristak V. Pipiska M. Duriska L. Jimenez E. M. Soja G. Iron-impregnated biochars as effective phosphate sorption materials. Environ. Sci. Pollut. Res. 2017;24:463. doi: 10.1007/s11356-016-7820-9. [DOI] [PubMed] [Google Scholar]
- Hu X. Ding Z. H. Zimmerman A. R. Wang S. S. Gao B. Batch and column sorption of arsenic onto iron-impregnated biochar synthesized through hydrolysis. Water Res. 2015;68:206. doi: 10.1016/j.watres.2014.10.009. [DOI] [PubMed] [Google Scholar]
- Wang H. Fang C. R. Wang Q. Chu Y. X. Song Y. L. Chen Y. M. Xue X. D. Sorption of tetracycline on biochar derived from rice straw and swine manure. RSC Adv. 2018;8:16260. doi: 10.1039/C8RA01454J. [DOI] [PMC free article] [PubMed] [Google Scholar]
- Wang S. S. Gao B. Zimmerman A. R. Li Y. C. Ma L. N. Harris W. G. Migliaccioac K. W. Removal of arsenic by magnetic biochar prepared from pinewood and natural hematit. Bioresour. Technol. 2015;175:391. doi: 10.1016/j.biortech.2014.10.104. [DOI] [PubMed] [Google Scholar]
- Zhang M. Gao B. Varnoosfaderani S. Hebard A. Yao Y. Inyang M. Preparation and characterization of a novel magnetic biochar for arsenic removal. Bioresour. Technol. 2013;130:457. doi: 10.1016/j.biortech.2012.11.132. [DOI] [PubMed] [Google Scholar]
- Han L. Xue S. Zhao S. C. Yan J. C. Qian L. B. Chen M. F. Yao M. S. Biochar supported nanoscale iron particles for the efficient removal of methyl orange dye in queous solutions. PLoS One. 2015;10:e0132067. doi: 10.1371/journal.pone.0132067. [DOI] [PMC free article] [PubMed] [Google Scholar]
- Zhou H. G. Jiang Z. M. Wei S. Q. A novel absorbent of nano-Fe loaded biomass char and its enhanced adsorption capacity for phosphate in water. J. Chem. 2013;2013:1. [Google Scholar]
- Caminati G. and Puggelli M., Europium in phospholipid nanoscaffolds for the photophysical detection of antibiotic traces in solution, ResearchGate, 2011, vol. 6, p. 203
- Wei H. Hu D. Su J. Li K. B. Intensification of levofloxacin sono-degradation in a US/H2O2 system with Fe3O4 magnetic nanoparticles. Chin. J. Chem. Eng. 2015;23:296. doi: 10.1016/j.cjche.2014.11.011. [DOI] [Google Scholar]
- Huang B. H. Liu Y. G. Li B. Liu S. B. Zeng G. M. Zeng Z. W. Wang X. H. Ning Q. M. Zheng B. H. Yang C. P. Effect of Cu(II) ions on the enhancement of tetracycline adsorption by Fe3O4@SiO2-Chitosan/graphene oxide nanocomposite. Carbohydr. Polym. 2017;157:576. doi: 10.1016/j.carbpol.2016.10.025. [DOI] [PubMed] [Google Scholar]
- Fan S. S. Wang Y. Wang Z. Tang J. Tang J. Li X. D. Removal of methylene blue from aqueous solution by sewage sludge-derived biochar: Adsorption kinetics, equilibrium, thermodynamics and mechanism. J. Environ. Chem. Eng. 2017;5:601. doi: 10.1016/j.jece.2016.12.019. [DOI] [Google Scholar]
- Pellera F. M. Giannis A. Kalderis D. Anastasiadou K. Stegmann R. Wang J. Y. Gidarakos E. Adsorption of Cu(II) ions from aqueous solutions on biochars prepared from agricultural by-products. J. Environ. Manage. 2012;96:35. doi: 10.1016/j.jenvman.2011.10.010. [DOI] [PubMed] [Google Scholar]
- Peng L. Ren Y. Q. Gu J. D. Qin P. F. Zeng Q. R. Shao J. H. Lei M. Chai L. Y. Iron improving bio-char derived from microalgae on removal of tetracycline from aqueous system. Environ. Sci. Pollut. Res. 2014;21:7631. doi: 10.1007/s11356-014-2677-2. [DOI] [PubMed] [Google Scholar]
- Kakavandia B. Takdastana A. Jaafarzadeh N. Azizi M. Mirzaei A. Azari A. Application of Fe3O4@C catalyzing heterogeneous UV-Fenton system for tetracycline removal with a focus on optimization by a response surface method. J. Photochem. Photobiol., A. 2016;314:178. doi: 10.1016/j.jphotochem.2015.08.008. [DOI] [Google Scholar]
- Zhu X. D. Liu Y. C. Qian F. Zhou C. Zhang S. C. Chen J. M. Preparation of magnetic porous carbon from waste hydrochar by simultaneous activation and magnetization for tetracycline removal. Bioresour. Technol. 2014;154:209. doi: 10.1016/j.biortech.2013.12.019. [DOI] [PubMed] [Google Scholar]
- Zhang X. T. Shen J. C. Zhuo N. Yang W. B. Interactions between antibiotics and graphene-based materials in water: A comparative experimental and theoretical investigation. ACS Appl. Mater. Interfaces. 2016;8:24273. doi: 10.1021/acsami.6b09377. [DOI] [PubMed] [Google Scholar]
- Yu Y. Wang W. Shi J. Zhu S. Y. Yan Y. C. Enhanced levofloxacin removal from water using zirconium (IV) loaded corn bracts. Environ. Sci. Pollut. Res. 2017;24:10685. doi: 10.1007/s11356-017-8700-7. [DOI] [PubMed] [Google Scholar]
- Yi S. Z. Gao B. Sun Y. Y. Hu X. Removal of levofloxacin from aqueous solution using rice-husk and wood-chip biochars. Chemosphere. 2016;150:694. doi: 10.1016/j.chemosphere.2015.12.112. [DOI] [PubMed] [Google Scholar]
- Huang B. H. Liu Y. G. Li B. Liu S. B. Zeng G. M. Zeng Z. W. Wang X. H. Ning Q. M. Zheng B. H. Yang C. P. Effect of Cu(II) ions on the enhancement of tetracycline adsorption by Fe3O4@SiO2-Chitosan/graphene oxide nanocomposite. Carbohydr. Polym. 2017;157:576. doi: 10.1016/j.carbpol.2016.10.025. [DOI] [PubMed] [Google Scholar]
- Gao Y. Li Y. Zhang L. Huang H. Hu J. J. Shah S. M. Su X. G. Adsorption and removal of tetracycline antibiotics from aqueous solution by graphene oxide. J. Colloid Interface Sci. 2012;368:540. doi: 10.1016/j.jcis.2011.11.015. [DOI] [PubMed] [Google Scholar]
- Martins A. C. Pezoti O. Cazetta A. L. Bedin K. C. Yamazaki D. A. S. Bandoch G. F. G. Asefa T. Visentainer J. V. Almeida V. C. Removal of tetracycline by NaOH-activated carbon produced from macadamia nut shells: Kinetic and equilibrium studies. Chem. Eng. J. 2015;260:2–91. doi: 10.1016/j.cej.2014.09.017. [DOI] [Google Scholar]
- Pai R. Singh A. Simotwo S. Kalra V. In situ grown iron oxides on carbon nanofibers as reestanding anodes in aqueous supercapacitors. Adv. Eng. Mater. 2018;20:1. doi: 10.1002/adem.201701116. [DOI] [Google Scholar]
- Grosvenor A. P. Kobe B. A. Mcityre N. S. Studies of the oxidation of iron by air after being xposed to water vapour using angle-resolved x-ray hotoelectron spectroscopy and QUASES. Surf. Interface Anal. 2004;36:1637. doi: 10.1002/sia.1992. [DOI] [Google Scholar]
- Hou H. Y. Dai Z. P. Liu X. X. Yao Y. Liao Q. S. Yu C. Y. Li D. D. Reutilization of the expired tetracycline for lithium ion battery anode. Sci. Total Environ. 2018;630:495. doi: 10.1016/j.scitotenv.2018.02.126. [DOI] [PubMed] [Google Scholar]
- Ling C. Liu F. Q. Xu C. Chen T. P. Li A. M. An integrative technique based on synergistic coremoval and sequential recovery of copper and tetracycline with dual functional chelating resin: Roles of amine and carboxyl groups. ACS Appl. Mater. Interfaces. 2013;5:11808. doi: 10.1021/am403491b. [DOI] [PubMed] [Google Scholar]
- Vandenberg E. T. Bertilsson L. Liedberg B. Uvdal K. Erlandsson R. Elwing H. Lundström I. Structure of 3-aminopropyl triethoxy silane on silicon oxide. J. Colloid Interface Sci. 1991;147:103. doi: 10.1016/0021-9797(91)90139-Y. [DOI] [Google Scholar]
- Kerber S. Bruckner J. J. Wozniak K. Barr T. L. The nature of hydrogen in x-ray photoelectron spectroscopy: General patterns from hydroxides to hydrogen bonding. J. Vac. Sci. Technol., A. 1996;14:1314. doi: 10.1116/1.579947. [DOI] [Google Scholar]
- Berger R. Resnati G. Metrangolo P. Weber E. Hulliger J. Organic fluorine compounds: a great opportunity for enhanced materials properties. Chem. Soc. Rev. 2011;40:3496. doi: 10.1039/C0CS00221F. [DOI] [PubMed] [Google Scholar]
- Schaff J. E. Roberts J. T. Structure sensitivity in the surface chemistry of ice: Acetone adsorption on amorphous and crystalline ice films. J. Phys. Chem. 1994;98:6900. doi: 10.1021/j100079a002. [DOI] [Google Scholar]
- Henderson M. A. Joyce S. A. Rustad J. Interaction of water with the (1×1) and (2×1) surfaces of α-Fe2O3(012) Surf. Sci. 1988;417:66. doi: 10.1016/S0039-6028(98)00662-1. [DOI] [Google Scholar]
- Iwasita T. Nart F. C. In situ infrared spectroscopy at electrochemecal interfaces. Prog. Surf. Sci. 1997;55:271. doi: 10.1016/S0079-6816(97)00032-4. [DOI] [Google Scholar]
- Kandori K. Sakai J. Ishikawa T. Definitive effects of chloride ions on the formation of spherical hematite particles in a forced hydrolysis reaction. Phys. Chem. Chem. Phys. 2000;2:3293. doi: 10.1039/B002676J. [DOI] [Google Scholar]
- Song C. Sun X. F. Xing S. F. Xia P. F. Shi Y. J. Wang S. G. Characterization of the interactions between tetracycline antibiotics and microbial extracellular polymeric substances with spectroscopic approaches. Environ. Sci. Pollut. Res. Int. 2014;21:1786. doi: 10.1007/s11356-013-2070-6. [DOI] [PubMed] [Google Scholar]
- Jiang Z. F. Xie J. M. Jiang D. L. Yan Z. X. Jing J. J. Liu D. Enhanced adsorption of hydroxyl contained/anionic dyes on non functionalized Ni@SiO2 core-shell nanoparticles: Kinetic and thermodynamic profile. Appl. Surf. Sci. 2014;292:301. doi: 10.1016/j.apsusc.2013.11.136. [DOI] [Google Scholar]
- Liu P. Liu W. J. Jiang H. Chen J. J. Li W. W. Yu H. Q. Modification of bio-char derived from fast pyrolysis of biomass and its application in removal of tetracycline from aqueous solution. Bioresour. Technol. 2012;121:235. doi: 10.1016/j.biortech.2012.06.085. [DOI] [PubMed] [Google Scholar]
- Kang J. Liu H. J. Zheng Y. M. Qu J. Chen J. P. Systematic study of synergistic and antagonistic effects on adsorption of tetracycline and copper onto a chitosan. J. Colloid Interface Sci. 2010;344:117. doi: 10.1016/j.jcis.2009.11.049. [DOI] [PubMed] [Google Scholar]
- Efthimiadou E. K. Katsaros N. Karaliota A. Psomas G. Synthesis, characterization, antibacterial activity, and interaction with DNA of the vanadyl-enrofloxacin complex. Bioorg. Med. Chem. Lett. 2007;17:1238. doi: 10.1016/j.bmcl.2006.12.032. [DOI] [PubMed] [Google Scholar]
- Liu Q. Zhong L. B. Zhao Q. B. Frear C. Zheng Y. M. Synthesis of Fe3O4/Polyacrylonitrile composite electrospun nanofiber mat for effective adsorption of tetracycline. ACS Appl. Mater. Interfaces. 2015;7:14573. doi: 10.1021/acsami.5b04598. [DOI] [PubMed] [Google Scholar]
- Gu C. Karthkeyan K. G. Sorption of the antimicrobial ciprofloxacin to aluminum and iron hydrous oxides. Environ. Sci. Technol. 2005;39:9166. doi: 10.1021/es051109f. [DOI] [PubMed] [Google Scholar]
- Trivedi P. Vasudevan D. Spectroscopic investigation of ciprofloxacin speciation at the goethite-water interface. Environ. Sci. Technol. 2007;41:3153. doi: 10.1021/es061921y. [DOI] [PubMed] [Google Scholar]


