Abstract.
Significance
Continuous glucose monitors (CGMs) are increasingly utilized as a way to provide healthcare to the over 10% of Americans that have diabetes. Fully insertable and optically transduced biosensors are poised to further improve CGMs by extending the device lifetime and reducing cost. However, optical modeling of light propagation in tissue is necessary to ascertain device performance.
Aim
Monte Carlo modeling of photon transport through tissue was used to assess the luminescent output of a fully insertable glucose biosensor that uses a multimodal Förster resonance energy transfer competitive binding assay and a phosphorescence lifetime decay enzymatic assay.
Approach
A Monte Carlo simulation framework of biosensor luminescence and tissue autofluorescence was built using MCmatlab. Simulations were first validated against previous research and then applied to predict the response of a biosensor in development.
Results
Our results suggest that a diode within the safety standards for light illumination on the skin, with far-red excitation, allows the luminescent biosensor to yield emission strong enough to be detectable by a common photodiode.
Conclusions
The computational model showed that the expected fluorescent power output of a near-infrared light actuated barcode was five orders of magnitude greater than a visible spectrum excited counterpart biosensor.
Keywords: Monte Carlo, diabetes, remote health, biosensors
1. Introduction
Since the first indwelling medical device, a pacemaker in the 1960s, at least 8% to 10% of Americans have utilized an indwelling medical device in their healthcare.1 In recent years, research toward the design and development of indwelling sensors has increased due to their potential to detect near real-time physiological parameters for monitoring chronic diseases, such as cancer, cardiovascular disease, gout, and diabetes.2–5 In particular, indwelling biosensors used for monitoring the glucose concentration in patients with diabetes are among the most heavily researched due to the increasing prevalence of diabetes and the deleterious comorbidities that accompany insufficient monitoring of the condition.6,7 According to the Center for Disease Control 2020 National Diabetes Statistics Report, as of 2018, diabetes is estimated to directly affect over 34 million American adults (7.3 million undiagnosed) with an additional 88 million American adults characterized as prediabetic.8 The current focus for indwelling sensors in diabetes has been to mitigate deleterious effects and improve the quality of life by obtaining near real-time glucose data to help the patient and health care provider manage diabetes.7,9
Several researchers have been exploring a grain-of-rice-sized insertable glucose biosensor that converts a chemical signal into an optical signal through a combined recognition component [e.g., competitive binding molecule or glucose oxidase (GOX)] and transduction component [e.g., Förster resonance energy transfer (FRET) or phosphorescence lifetime].10–14 This is unlike currently available commercial continuous glucose meters such as the transcutaneous sensors Dexcom G6 and Abbott Freestyle, as well as the fully implantable Eversense by Senseonics. The commercial transcutaneous continuous glucose monitor are relatively expensive, and since they are transcutaneous, they open the patient to infection and last only 2 weeks primarily due to the eventual loss of skin adhesive. The Eversense was the first fully implantable glucose biosensor, but the transduction assay and optoelectronics are housed in a relatively large capsule, which is implanted by a physician and subsequently transmits data to an external wearable.
A biosensor that includes only the luminescent assay can overcome the limitations of these current devices by being smaller and hence insertable via hypodermic needle—eliminating the need for a physician to implant/explant the biosensor—as well as with potentially better biocompatibility and better cost-effectiveness. However, such an indwelling optically functionalized device mandates that a device external to the body provide excitation light that travels through the skin to the implant and generates a response with a great enough intensity to be read by a photodiode on the skin’s surface. The scattering and absorptive nature of skin, along with endogenous fluorescence, makes this a difficult task.15,16 Additionally, features such as skin tone or body mass index can vary across populations, making optical signal transduction more difficult and highly variable.17 However, tools such as Monte Carlo simulation can be used to predict autofluorescence, scattering, and absorptive events. Thus, it can be used to aid device design to overcome these potential barriers.
Monte Carlo modeling is a frequently used computational method for predicting seemingly nondeterministic situations governed by a probability distribution and multiple degrees of freedom. Monte Carlo modeling is used regularly in engineering, basic sciences, and business, among others.18–20 Wang et al.21 developed a Monte Carlo model of steady-state light in multilayered tissues, a tool that has been used extensively for modeling light transport through layered tissues. This tool not only has a strongly supported design of optical systems intended for interaction with biological tissue but also has spawned a large number of subsequent Monte Carlo programs for varying applications. Such tools have been used to analyze Raman spectroscopy, polarized light, and birefringent media.22–24 It is also frequently utilized within the device commercialization process for either Food and Drug Administration approval or device optimization, as was the case with Phillips’ BiliCheck.25
As a stochastic numerical method, Monte Carlo for photon transport utilizes solutions to the radiative transfer equation informed by materials properties (most commonly absorption coefficient, ; scattering coefficient, ; anisotropy, ; refractive index, ) of media within a domain to determine photon paths. Briefly, a photon is assigned a given “weight” and deposits that weight as it undergoes absorption events or is scattered by turbid media. These interactions occur at a step size informed by the media being traversed and occur at media boundaries.26 More recently developed Monte Carlo programs for photon transport enable simulation of increasingly complex scenarios through the inclusion of tissue autofluorescence, luminescent implants, and inhomogeneous geometries in the , , and axes. Furthermore, computational advancements such as graphics processing unit (GPU) parallelization have enabled increasingly complex simulations to be realized.27–31 This work is such an example, as the simulation domain is fluorescent and phosphorescent and represents a discrete insertable biosensor.
Here, we present the development and validation of a Monte Carlo computational framework that analyzes the fluorescent and phosphorescent performance of a grain-of-rice, fully insertable “barcode” glucose biosensor with the goal of overcoming the aforementioned limitations of optically functionalized and indwelling biosensors. To the author’s best knowledge, there are no references in existing literature referring to a multimodal and fully insertable optical glucose biosensor, and there does not exist a Monte Carlo code framework to evaluate the spectral output of FRET assays in bulk tissue. First, the framework is developed and validated against glucose biosensing assays that are already developed and in the literature and are excitable with a wavelength of 450 nm.32,33 Next, the model is extended to analyze the performance of an in-progress device with an excitation wavelength of 680 nm, as red light penetrates tissue more successfully, particularly for darker skin tones.34,35 We aim to develop a computational workflow that can be used to assess phosphorescence-based and FRET-based insertable biosensors, as well as to determine whether in-development assays will yield sufficient photoluminescent signal to be detectable by an off-the-shelf photodiode.
2. Materials and Methods
2.1. Anatomical Model, Optical Properties, and Computation
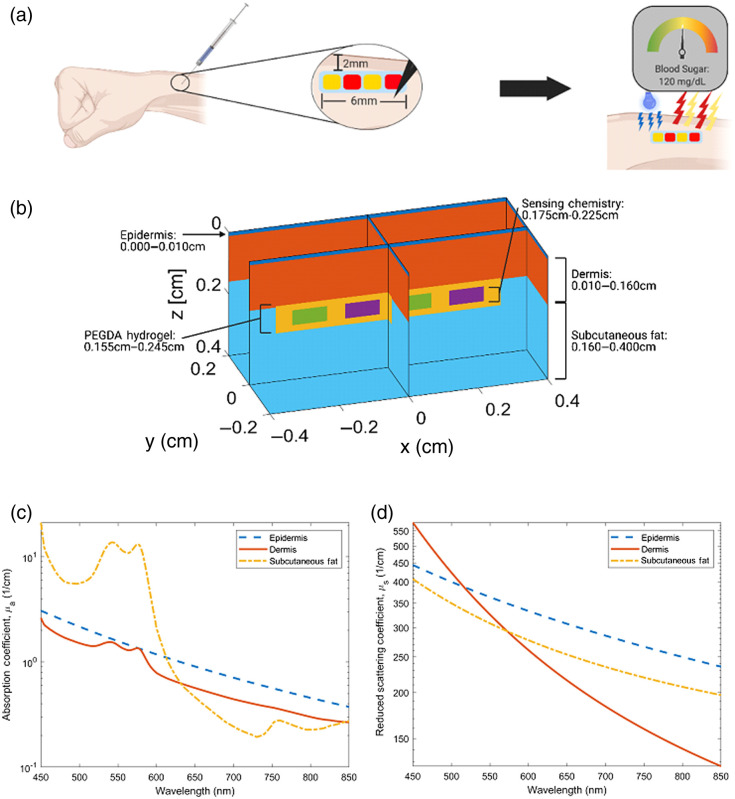
A 3D model representing the dorsal forearm was chosen as the model anatomy and is given viewed in Fig 1(a). Three anatomical layers were used, and the insertable biosensor was centered at a depth of 0.20 cm. Figure 1(b) provides thicknesses for each element. An epidermal thickness of 0.010 cm was chosen due to literature values ranging between 0.0075 and 0.012 cm.36,37 A dermal thickness of 0.15 cm was used along with a 0.24-cm thick layer of subcutaneous fat.38 Figures 1(c) and 1(d) depict the absorption and reduced scattering coefficients used in all simulations, unless otherwise stated. The properties used in these simulations were largely native to MCmatlab and were derived from Jacques et al., with the exception of the epidermal absorption coefficient (which was changed to 1/10th of the native value to reflect the literature).15,39 Refractive index matching was used, and anisotropy was set to .
Fig. 1.
Model anatomy, insertable geometry, and optical properties: (a) dorsal forearm anatomy with proposed bar-code insertable, (b) model geometry with implant, (c) absorption coefficient of tissues, and (d) scattering coefficient of tissue. (a) Created with biorender.com
For this work, the source and detector are colocated to eliminate any spectral effects caused by source/detector spacing that may lead to misrepresentation of emission spectra. The source is a rectangular LED-type emitter with a top-hat near field and Lambertian far-field distribution. There is a beamwidth of 0.40 cm in the -direction and 0.40 cm width in the -direction. This yields a total illumination area of and was chosen to approximate the illumination area of the central green LED on the Apple Watch. In the far-field, a Lambertian distribution with a width of in the and directions was used. The detector is a fiber with a numerical aperture of 0.4 and a diameter of 0.17 cm, located at , , and . This diameter was chosen to mimic the sensing area of the SFH 2704 Photodiode (OSRAM Opto Semiconductors). All simulations were performed on a Lenovo Legion Y720 Laptop. GPU-parallelized simulations were completed on a GeForce GTX 1060. The simulation time varied from to . These values are determined by the overall absorption and scattering of the simulation iteration, as a simulation with a less turbid domain (lower absorption and scattering coefficients) would lead to more interactions before the photon weight reached zero. Simulation time was dependent on the number of interactions was dependent on the number of interactions being calculated as well as the optical properties of the simulation domain and varied from to . Overall, it was found that a complete iteration of the computational modeling, which would yield the emission spectra of all assays within the barcode biosensor, would take between 2 and 3 h.
Fluorescence models were completed by simulating excitation light coming from the source and reaching the biosensor, and then fluorescence simulations were run for the emission spectra of a given fluorophore using a modified quantum yield (). This quantum yield was determined by the expression
| (1) |
This was completed to ensure that results were calculated with the correct tissue optical properties at a given wavelength. The quantum yield of a fluorophore () was multiplied by the ratio of the relative quantum yield at a given wavelength () divided by the sum of relative quantum yields for each relevant wavelength (Em = peak-normalized emission spectra). For input into MCmatlab, was further modified by multiplying by the ratio of excitation wavelength to emission wavelength, as MCmatlab accepts power yield.
Each dye emission spectra was simulated via 80 individual emission simulations, yielding a resolution between 1.8 and 2.6 nm depending on the width of the spectrum. Thus, a given assay will have a single excitation simulation, 80 emission simulations for phosphors, 80 simulations for the FRET donor dye, and 80 simulations for the FRET acceptor dye. Note S2 in the Supplementary Material details the number of simulations required to determine the output of a barcode biosensor iteration. After all simulations were completed, postprocessing was conducted to calculate time-resolved results for phosphorescent fluorophores and the final emission spectra of FRET species.
2.2. Visible Spectrum Biosensor
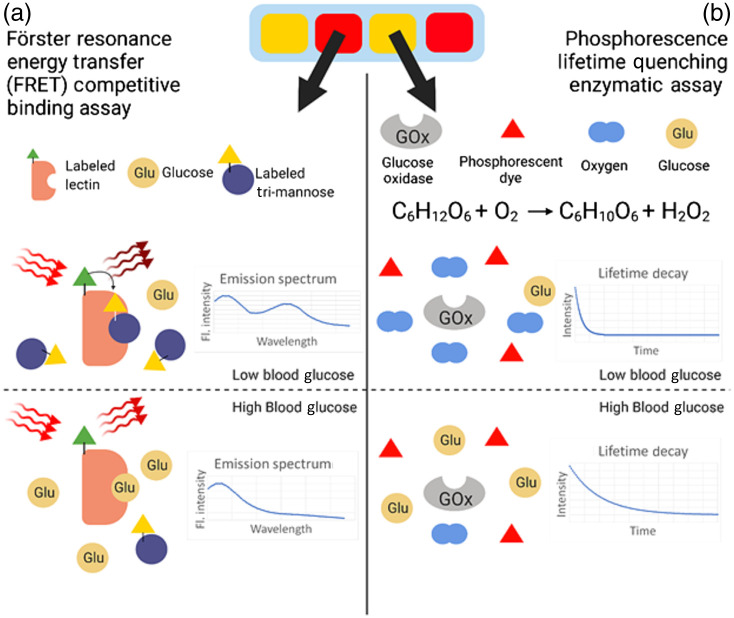
A decay modality for glucose sensing was reported previously by Brown and McShane12 wherein the oxidation of glucose, catalyzed by the enzyme GOX, resulted in a decreasing concentration of molecular oxygen within a hydrogel. This decreasing concentration was then correlated to the phosphorescence lifetime of a dye also embedded in the hydrogel matrix, as oxygen is a strong triplet-state quenching agent.12,40,41 This is depicted in Fig. 2(b). Although a singlet state fluorophore may have a lifetime on the order of , the phosphors used in this assay have lifetimes on the order of . The use of time-domain phosphorescent lifetime measurements is beneficial, as skin autofluorescence exhibits the short lifetimes that accompany singlet state excitation and thus do not interfere with the longer lifetimes associated with triplet state excitation if the emission acquisition is properly gated.42–44 In this model, the domains containing this assay [represented as green regions in Fig. 1(a)] have an absorption coefficient derived from the extinction coefficient of the phosphorescent dye, Pd-meso-tetra(4-carbodyphenyl)porphyrin (PdP), determined as
| (2) |
where is the extinction coefficient and is the molarity of the species. Scattering for this domain is assumed to be negligible, given that the absorption coefficient is multiple orders of magnitude greater than the scattering coefficient. After simulations are completed and a phosphorescence emission spectrum is obtained, the Stern–Volmer (SV) equation
| (3) |
is then applied using phosphorescence intensity and a user-inputted oxygen concentration to determine phosphorescence intensity after quenching. Once all relevant material properties have been collected, a first simulation is conducted again with model geometry that has wavelength-independent optical properties (unlike skin). The emission spectra collected from these simulations were then normalized and compared with published data to validate the modeling framework.32,33 Once agreement was determined to be sufficient, simulations of the biosensor were completed with a geometry and model properties representative of tissue, and iterative simulations were completed to identify differences in response between turbid and nonturbid environments.
Fig. 2.
(a) FRET competitive binding assay and (b) phosphorescence lifetime quenching enzymatic assay.
The second sensing modality was previously reported by Meadows and Schultz45 and improved upon by Cummins et al.46 Using FRET, the competitive binding between substrates glucose and dye-bound mannatetraose (APTS-MT) to enzyme Concanavalin A (ConA), which is bound to tetramethylrhodamine isothiocyanate (TRITC), is represented by the ratio of two fluorescent emission peaks as the donor dye (APTS) engages in efficient long-distance dipole–dipole coupling with the acceptor dye (TRITC) when occupying the active site of ConA. As glucose concentration increases, the acceptor peak decreases in relative intensity because energy transfer is reduced when the competing ligand is displaced from the ConA as glucose occupies more active sites. This is depicted in Fig. 2(a). The absorption coefficient is derived from the donor, which absorbs the excitation light. Fluorescence simulations were completed for the donor and acceptor separately to identify the effect of tissue-like media on emission spectra. The final combined emission spectra for this assay were determined as
| (4) |
and
| (5) |
for the donor and acceptor, respectively, and then were additively combined. To determine the fluorescent intensity as a fraction of source intensity (), the fluorescent light reaching the detector (FLRD) was modified by parameters determined via the binding kinetics, such as the percent of bound Concanavalin A (ConA) and Mannotetraose (MT); the fluorophore excitation and emission spectra, such as the spectral overlap (SO); the FRET efficiency (), the relative extinction coefficient of each fluorophore ; and the orientation factor, . To validate this component of the framework, the emission spectra of two combinations of the assay, representing high and low glucose concentrations, were simulated with the framework and then compared with experimental fluorescence data of free-solution versions of the assay with identical concentrations: TRITC-ConA: 100 nM APTS-MT and 500 nm TRITC-ConA: 100 nM APTS-MT.13 Good agreement between the data generated by the computational framework and data found in previous literature indicates that the model can accurately determine the fluorescent response of this FRET assay.
Simulations and postprocessing were completed using optical properties representing wavelength-independent media, as described previously, to compare with published literature and ensure accuracy at the assay-specific ratiometric values of 520 and 600 nm. Then, simulations were completed in tissue to identify any changes in spectra associated with the turbidity of skin.
2.3. Tissue Autofluorescence
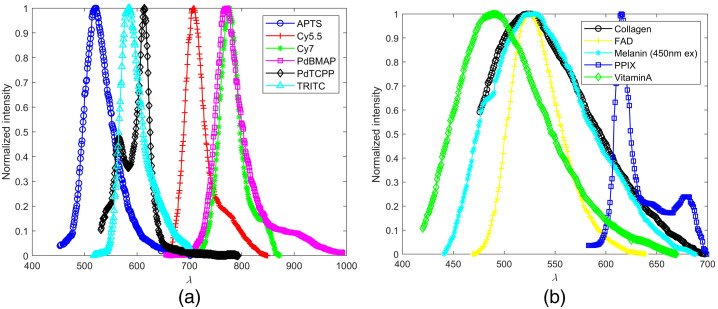
An additional set of models was used to replicate autofluorescence, fluorescence light emitted by endogenous fluorophores within the tissue, at excitation wavelengths of 450 and 680 nm. This was done to analyze spectral characteristics of fluorescence originating from fluorophores of interest, namely, flavin adenine dinucleotide (FAD), collagen, melanin, and vitamin A. The common endogenous fluorophore nicotinamide adenine dinucleotide was excluded because it is not excited with 450-nm light.47 The resultant spectra were compared with the fluorescence output of the biosensor. The spectral properties of these fluorophores are illustrated in Fig. 3(b).
Fig. 3.
(a) Dye emission spectra and (b) endogenous fluorophore emission spectra.33,48–54
A different model was created for each individual endogenous fluorophore. All models have a three-layer base geometry (epidermis/dermis/subcutis). The optical properties of the layer for which a given endogenous fluorophore resides were modified to represent fluorescence as determined by values from the literature. As shown in Table 1, the absorption coefficient and quantum yield were modified. It was then assumed that all absorption that occurred was completed by endogenous fluorophores. The FAD layer was in the epidermis (excluding the stratum corneum, which occupied the top 0.20 mm), the melanin layer was in the stratum basale, and collagen and vitamin A occupied the dermis.62,78–80 Equation (2) was used to determine the absorption coefficient of a fluorophore layer, the reduced scattering coefficient remained constant from the original layer, and quantum yield was derived from the literature. Simulations were completed at a resolution .
Table 1.
Fluorophore properties.
| Fluorophore | Excitation wavelength (nm) | () | |
|---|---|---|---|
| PdP | 450 | 0.006632,55,56 | 0.06848,57,58 |
| TRITC-ConA | 450 | 0.0017161,33,51 | 0.159 |
| APTS-MT | 450 | n/a | 0.2 |
| Collagen | 450 | 7.813160,61 | 0.05 |
| Vitamin A | 450 | 0.020762,63 | 0.0364 |
| FAD | 450 | 0.364365 | 0.03366 |
| PPIX | 450 | 0.1058 | 0.08567 |
| Melanin | 450/680 | 14.24/1.0368,69 | 0.0005/0.0005670 |
| Cy5.5-MT | 680 | 250.058,71 | 0.272 |
| Cy7-ConA | 680 | n/a | 0.373–75 |
| BMAP | 680 | 168.05,75–77 | 0.2148,76 |
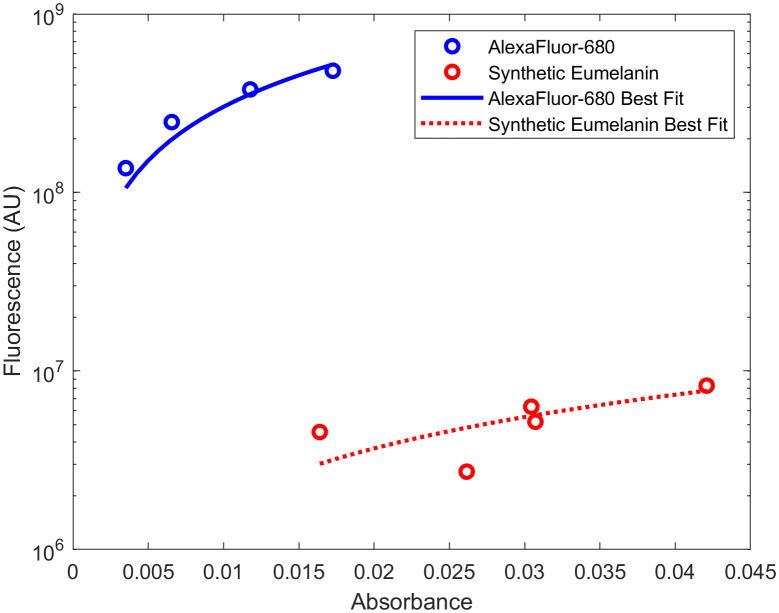
Melanin autofluorescence with an excitation wavelength of 680 nm was also simulated. The emission spectrum and quantum yield at this excitation wavelength could not be found in published literature; therefore, it was determined experimentally via published protocols70,81 using a PTI Quantamaster series fluorescence spectrometer and a Cary 300 Series UV-Vis Spectrophotometer, Agilent Technologies. The linear relationship comparing the absorbance and fluorescence of five solutions of synthetic eumelanin (Melanin, Sigma Aldrich) dissolved in ammonium hydroxide (0.033, 0.027, 0.02, 0.013, and 0.0067 mM) was compared to the same parameter from a known standard, Alexafluor-680 (AF-680, Thermo Fisher Scientific, Massachusetts) dissolved in phosphate-buffered saline (PBS). The quantum yield of melanin was then calculated according to
| (6) |
where “Gradient” is the slope of the best fit line between absorbance and fluorescence and is the refractive index.
2.4. Far-Red Biosensor
A phosphorescence lifetime decay modality described previously was simulated in this work.44 This domain works identically to the visible spectrum counterpart but utilizes the phosphorescent dye Palladium (II) tetramethacrylated benzoporphyrin (BMAP) and an excitation wavelength of 680 nm. Similarly, a far-red FRET assay is modeled using Cy5.5 and Cy7 as its donor and acceptor, respectively, according to Eqs. (4) and (5). The simulated fluorescence of the far-red FRET assay differs from the visible spectrum counterpart in that both the donor and acceptor dyes emit fluorescence when excited with 680 nm. Thus, simulating the fluorescent output of the far-red FRET assay consisted of two components: simulation of fluorescence originating from FRET with the assumption that the binding kinetics of APTS-MT and TRITC-ConA will be similar to Cy5.5-MT and Cy7-ConA and an additional computation of Cy7 fluorescence emission with a quantum yield of 0.30 and an absorption coefficient of . The latter computation was completed by changing the quantum yield and absorption coefficient to the previously mentioned values and not applying Eqs. (4) and (5) in postprocessing. The results of both simulations were then additively combined to generate the final result.
2.5. Power Analysis
Finally, the photoluminescent output of the visible and far-red assays (four in total) was compared with the detectability limits of the SFH 2704 (OSRAM Opto Semiconductors), a photodiode with a wide sensing window that has been applied to healthcare applications.82,83 The minimum power detectable by the selected photodiode was calculated via
| (7) |
where is the power, NEP is the noise equivalent power, BW is the bandwidth, and is the spectral sensitivity. To compare output power from the Monte Carlo simulations with the minimum power detectable by the SFH 2704, an incident power of the excitation source was assigned using the maximum permissible exposure of skin to illumination from light of wavelengths 450 and 680 nm. This was found to be 32 mW or for an LED with an area of for both excitation wavelengths.84
2.6. Parametric Analysis for Model Convergence
A parametric convergence study was completed to determine the number of photons required to accurately represent biosensor excitation and emission such that the result of a simulation with was different than the result of a simulation with . For these simulations, the model parameters described in Fig. 1 were used, except for the absorption coefficient and quantum yield of the target fluorophore. The target fluorophore was assigned the low absorption coefficient and power yield of and 0.001 (defined as the quantum yield multiplied by the ratio of emission wavelength to excitation wavelength), respectively. This was held constant over the emission spectrum.
These parametric convergence study simulations were conducted with an excitation of 450 (emission: 493 to 700 nm) and 680 nm (emission: 700 to 900 nm) to match the excitation and emission wavelengths used in this work, and the results are viewable in Fig. S1 in the Supplementary Material and described in Note S1 in the Supplementary Material. Simulations were repeated with an increasing number of photons until it was observed that simulations with yielded results different in magnitude of light reaching the photodetector when compared with simulations completed with . It was found that this also maintained the coefficient of variation (COV) below 1%. Thus, were used for all simulations in this work.
2.7. Parametric Sweep for Implant Depth and Volume Fraction Melanosomes
Parametric sweeps were conducted to determine the decrease in optical power associated with increasing the implant depth and increasing the amount of melanin in the epidermal layer. To quantify the effect of implant depth, the depth of the center of the biosensor was increased from 0.20 to 0.50 mm, and simulations were completed in triplicate. To quantify the effect of volume fraction of melanosomes, three values of 0.03, 0.23, and 0.43 were chosen as representative of individuals with Fitzpatrick skin tone I, Fitzpatrick skin tone IV, and Fitzpatrick skin tone VI.69 Then, epidermal optical properties were recalculated to be representative of increased melanin concentration.15
2.8. Summary of Methods
In summary, this computational framework seeks to predict the optical power output of a “barcode” glucose biosensor in three parts, as shown in Table 2. First, MC models of existing phosphorescence lifetime decay and FRET assays with an excitation wavelength of 450 nm are created and validated against results presented in previous literature that demonstrate the glucose-sensing abilities of these assays in an in vitro setting. The phosphorescence lifetime decay assay is validated by comparing emission spectrum and emission intensity over time (lifetime). The FRET assay is validated by comparing the emission spectrum over high and low physiological glucose concentrations. Second, tissue autofluorescence is simulated by analyzing the fluorescence emission from significant endogenous fluorophores in tissue, and the subsequent model is validated by comparing the computationally generated emission spectrum with a reference spectrum from the literature. Lastly, the computational capabilities developed in the prior two components are applied to predict the photoluminescent output of a “barcode” biosensor with an excitation wavelength of 680 nm, as well as the associated autofluorescence emission.
Table 2.
Summary of methods.
| Workflow component | Description | Notes |
|---|---|---|
| Existing biosensor assays (450-nm excitation) | PdP-based phosphorescence lifetime decay | Replication of work in Ref. 32 |
| APTS-MT/TRITC-ConA FRET assay | Replication of work in Ref. 33 | |
| Tissue autofluorescence | 450-nm excitation tissue autofluorescence | Replication of work in Ref. 16 |
| 680-nm excitation tissue autofluorescence | Application of validated tissue autofluorescence simulation | |
| Far-red barcode biosensor (680-nm excitation) | BMAP-based phosphorescence lifetime decay | Application of validated phosphorescence lifetime decay assay |
| Cy5.5-MT/Cy7-ConA FRET assay | Application of validated FRET simulation |
3. Results and Discussion
3.1. Visible Spectrum Barcode
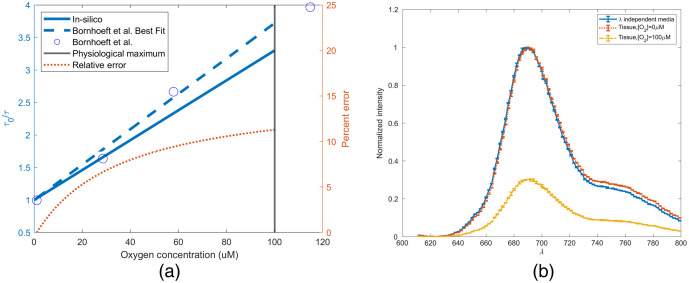
Palladium meso-tetra(4-carboxyphenyl)porphyrin (PdTCPP) based sensing chemistry was simulated in silico in nonwavelength-dependent media, and the time-resolved simulation was validated against previous literature using the SV relationship. In Fig. 4(a), the SV response of the sensor found in previous literature (SV constant of [] and a natural lifetime of ) was compared with the simulated results. Overall, the mean average percent error (MAPE) from 0 mM to the expected operational maximum () was found to be 7.87%.32,85 This error is possibly caused by the changing fraction of fluorophore able to be quenched that occurs as a function of the sensing chemistry surface area. The SV relationship applies not only to lifetime but also to spectral intensity. Figure 4(b) illustrates the decrease in intensity that is associated with the physiological maximum oxygen concentration, as well as the spectral shift observed when the simulation was performed with in vivo optical properties. A 2-nm redshift is observed after 700 nm and results in the weighted average of the spectra changing from 708 to 710 nm. Additionally, the normalized intensity of a given wavelength after 700 nm is, on average, 2% greater in the wavelength-dependent simulation. This is likely due to the minimal change in tissue optical properties at this wavelength range, compared with that observed between 550 and 600 nm. As shown in Fig. 4(b), peak intensity of the emission spectrum at the physiological maximum oxygen concentration will decrease to of the intensity predicted in the absence of oxygen. From this data, we can conclude not only that are we accurately able to replicate the phosphorescence response of this assay, but also that inclusion of such an assay in vivo would not require a change in optical filtering because the peak does not change.
Fig. 4.
(a) SV for validation of in silico PdTCPP time-resolved measurement and (b) change in emission spectra as a function of tissue.
Figures 5(a) and 5(b) illustrate the comparison of the in silico spectra to Cummins.33 As a ratiometric assay, glucose concentrations are determined using the relative intensities at 520 and 600 nm. However, matching the entire spectrum provides for a more robust model, allowing for comparisons across the entire emission. Figure 5(a) compares spectra with lower acceptor emission that would be representative of a higher glucose concentration versus that shown in Fig. 5(b), where a more noticeable acceptor peak is observed. Overall, the MAPE between the in silico and in vitro spectra in Figs. 5(a) and 5(b) was found to be 2.69% and 5.84%, respectively, which is well within a 10% target acceptance. Our model predicts a greater response in the red-end of the emission spectra than has been observed in the literature, but it is accurate in producing the waveform and relative strength of the donor and acceptor fluorophores. Figure 5(c) illustrates the predicted spectral transformation of emission from a 1:10 donor:acceptor ratio when the assay is placed in tissue. A significant shift in spectra is observed. The acceptor peak moves to 597 from 580 nm. This dramatic change is likely caused by the absorptive effects of hemoglobin within the tissue over the same wavelengths. The donor peak also undergoes a blue shift of a smaller magnitude from 523 to 521 nm. This is likely due to the absorption of subcutaneous fat and being higher at 523 than 521 nm (8.4 and , respectively), which is in contrast to the general decrease in tissue absorption as wavelength increases. From this data, the created Monte Carlo models demonstrate sufficient agreement with the published data.
Fig. 5.
(a) Comparison of simulation and previous literature for 500 nm TRITC-ConA: 100 nM APTS-MT, (b) comparison of simulation and previous literature for TRITC-ConA: 100 nM APTS-MT, and (c) simulated change of TRITC-ConA: 100 nM APTS-MT spectra in vivo.
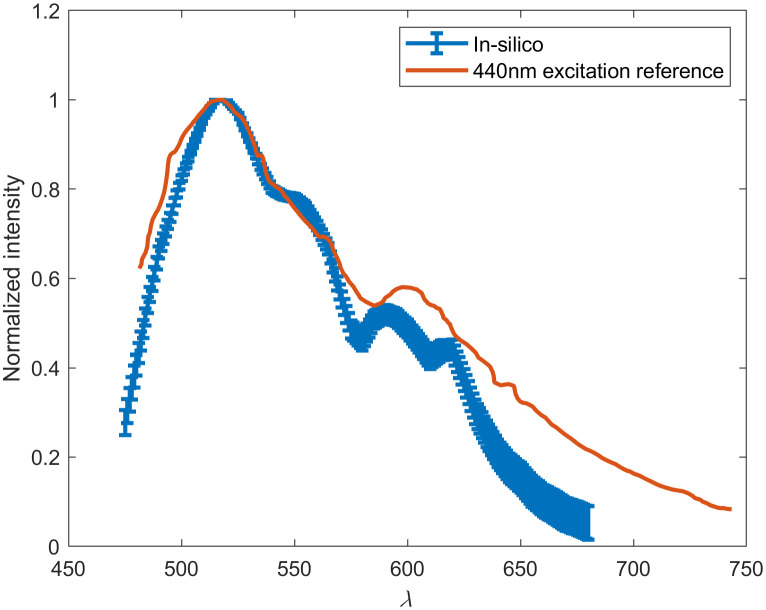
One of the obstacles to implementing insertable fluorescence-based monitoring technology is tissue autofluorescence. Although the phosphorescence decay assay is time-resolved and is able to circumvent endogenous fluorescence via time-gated detection, the ratiometric FRET assay is not. Thus, autofluorescence in tissue at 450 nm was simulated to estimate the effect of endogenous fluorophores on this signal. To ensure a sufficiently high resolution and provide triplicate results of each endogenous fluorophore spectra, a total of 675 simulations of was completed. Figure 6 demonstrates these results as compared with autofluorescence spectra collected from the hand dorsum and inner forearm of Asian and Caucasian volunteers by Zeng et al.86 There is a 6.3% difference in simulated spectra compared with the reference data between 482 and 600 nm. However, above 600 nm, this difference increases to 43%. This indicates the model’s ability to determine spectral peaks and its inability to replicate the end of emission spectra. These differences are possibly due to the 10 nm difference in excitation wavelength as well as the lack of specific anatomical data available about the participants used in Zeng et al., specifically dermal thicknesses and melanin concentrations. Most importantly, the simulation confirms a peak at 520 nm and a secondary peak around 600 nm. The primary 520-nm peak is caused by collagen, which is a large source of autofluorescence at most visible spectrum excitation wavelengths and is most important to accurately estimate due to the overlap with the anticipated fluorescence peaks from the FRET assay. Additionally, it is well understood that 450-nm excitation light will not propagate far through tissue. For the phosphorescence assay, only 0.0001% of light from a 450-nm incident LED will be absorbed by the assay. Thus, it is not likely that the 450-nm excitation “barcode” will have sufficient signal compared with the autofluorescence noise determined to exist at these wavelengths. However, the use of Monte Carlo to replicate the spectroscopic and time-resolved assay has been validated and will be used to assess the feasibility of a barcode featuring identical interrogation methods but with a far-red excitation wavelength of 680 nm.
Fig. 6.
In silico 450-nm excitation autofluorescence spectra compared with 440-nm excitation spectra collected by Zeng.16
3.2. Far-Red Barcode
As mentioned previously, a version of the biosensor with far-red excitation and emission was designed to overcome the limitations of visible light propagation through tissue. This biosensor, consisting of a Palladium (II) tetramethacrylated benzoporphyrin (BMAP) phosphorescence lifetime assay and a Cy5.5/Cy7 FRET competitive binding assay, is anticipated to yield a greater luminescent output with decreased tissue absorption and autofluorescence.
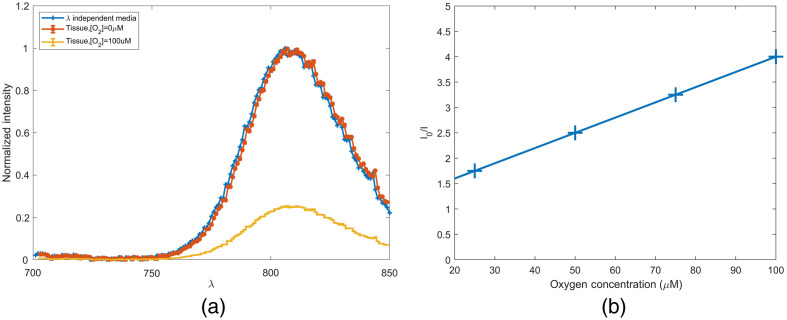
The results of simulating a glucose biosensor with 0.91 mM of phosphorescent dye BMAP in wavelength independent media and in vivo are shown in Fig. 7(a). Anoxic conditions in wavelength independent media and in vivo present nearly identical spectra. A shift of 1 nm is observed, as the in vivo spectra peak is located at 807 nm and the wavelength-independent media peak is at 806 nm. This insignificant shift is not anticipated to affect sensor functionality or cause any change to the device design. After determining the effect of physiological maximum oxygen concentration on phosphorescent intensity with an SV coefficient of 0.03, an intensity reduction of 75% is observed in Fig. 7(b).44 Although this compares similarly to the 70% loss in intensity for the visible spectrum phosphorescent assay, the near-infrared (NIR) version still performs favorably as it absorbs 5.32% of all excitation light absorbed within the simulation domain. This is four orders of magnitude of incident light absorbed by the visible spectrum assay. This increase can be attributed to the absorption coefficient, which is four orders of magnitude greater than the visible spectrum counterpart, and the increase in light penetration. Tissue irradiance at a depth of 0.2 cm is greater when 680-nm light is used compared with 450-nm light.
Fig. 7.
(a) In silico 680-nm excitation PdBMAP in wavelength independent media versus tissue and (b) PdBMAP intensity as a function of interstitial oxygen concentration.
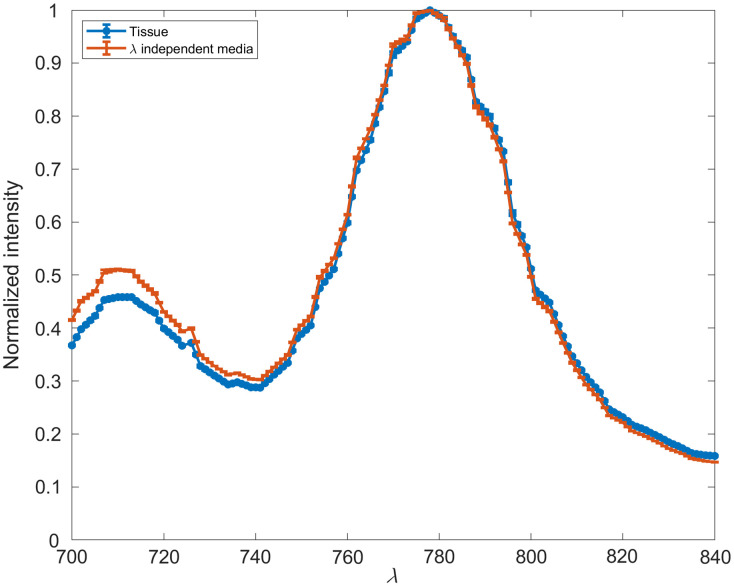
The far-red version of the FRET assay does not undergo a spectral shift when one compares the wavelength-dependent simulations with wavelength-independent simulations (Fig. 8). However, it does undergo a shift in normalized intensity across the emission spectra. In wavelength-independent media, the ratio of peak intensities () is 1.96. In wavelength-dependent media, this shifts to 2.18. Across the entire spectra, the weighted mean emission wavelength is 763 nm in wavelength-independent media and 765 nm in skin-like media. This difference, similar to that observed for the phosphorescence lifetime assay, is not significant enough to warrant any consideration as the assay is further developed. The NIR assay performs favorably to the visible spectrum analog, as it absorbs 8.19% of all incident light that was absorbed within the simulation domain, whereas the visible spectrum assay absorbs only 0.000026%.
Fig. 8.
In silico 680-nm excitation Cy5.5-ConA and Cy7-MT in wavelength-independent media and tissue.
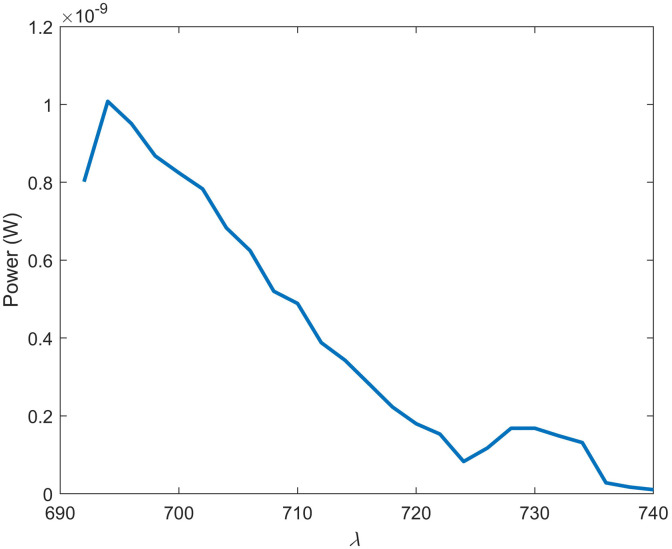
As mentioned previously, the 450-nm excitation barcode also induces an autofluorescence spectra that featured a peak overlapping with the ratiometric FRET assay. Thus, it would be prudent to evaluate the endogenous fluorescence expected in vivo with an excitation wavelength of 680 nm. Although far-red single-photon endogenous fluorescence has not been studied as thoroughly as visible spectrum autofluorescence, it is well known that far-red autofluorescence is orders of magnitude weaker than its visible spectrum counterpart.87,88 The major endogenous fluorophores in the far-red/NIR range have been reported to be melanin and porphyrins.53 However, contradicting literature exists, demonstrating that porphyrins associated with healthy tissue do not excite beyond the red-most band, which ends at around 660 nm.53,89 Thus, only melanin was included in the simulations to estimate far-red autofluorescence. First, the quantum yield of melanin at this wavelength had to be determined experimentally by relating melanin fluorescence and absorbance to the same parameters from a known standard. The gradient of synthetic eumelanin in ammonium hydroxide and standard AlexaFluor-680 in PBS is shown in Fig. 9 and was found to be and , respectively. The refractive index of melanin in ammonium hydroxide and Alexafluor-680 in PBS at 680 nm was 1.348 and 1.3284, respectively. The quantum yield of synthetic eumelanin in ammonium hydroxide was then calculated to be 0.00056 according to Eq. (6). The absorption coefficient for an individual with a 3% volume fraction of melanin was set to . As shown in Fig. 10, fluorescence has a peak at and then decreases with a shoulder at 730 nm. The location of the peak at 695 nm is closest to the 710-nm peak observed for Cy55, and autofluorescence retains of its intensity at that wavelength. However, given the relatively narrow 50-nm bandwidth of this spectrum, it is possible that this noise source can be overcome with sufficiently strong emission from fluorophores in the implants.
Fig. 9.
Experimental determination of melanin quantum yield: (blue) AlexaFluor-680 and (red) synthetic eumelanin.
Fig. 10.
In silico 680-nm excitation of melanin in tissue with a 32-mW LED.
3.3. Power Comparison and Parametric Sweep
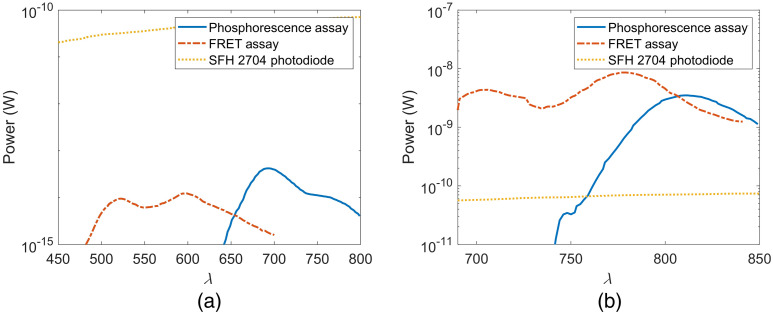
As light penetration through tissue generally increases as a function of wavelength within the visible spectrum, it is anticipated that the far-red version of the barcode will have greater output power. Additionally, the higher molar extinction coefficients of far-red dyes used in this work compared with their visible spectrum counterparts allow for an increase in light absorption and thus light emission. Figure 11 illustrates not only the change in observed power with each assay but also the detectability on a low-cost photodiode commonly used in biosensing (SFH 2704). In each case the simulated source power is 32 mW, which was chosen because it achieves the maximum permissible exposure for 450 and 680 nm. Figure 11(a) shows that the visible spectrum assays emit light such that only a maximum of and of light reaches the photodetector aperture for the FRET and phosphorescence assays, respectively. This value is too low to be detectable by the majority of low-cost photodiodes. Additionally, this assay combination requires a wide window of detectability, which would increase the photodiode cost when such a significant minimum detectable power is required. The far-red assay demonstrates an increased power output up to five orders of magnitude greater, as shown in Fig. 11(b). The greatest magnitude expected is . It is also found that the fluorescence output of the far-red FRET assay is one order of magnitude greater than the simulated fluorescence output of the endogenous melanin. However, these conditions assume the near-ideal optical conditions of superficial implant depth, low volume fraction melanosomes, and colocated source and detector.
Fig. 11.
Comparison of assay power at the detector for a 32-mW excitation LED to SFH 2704 photodiode minimum detectable power. (a) Visible spectrum biosensor and (b) far-red biosensor.
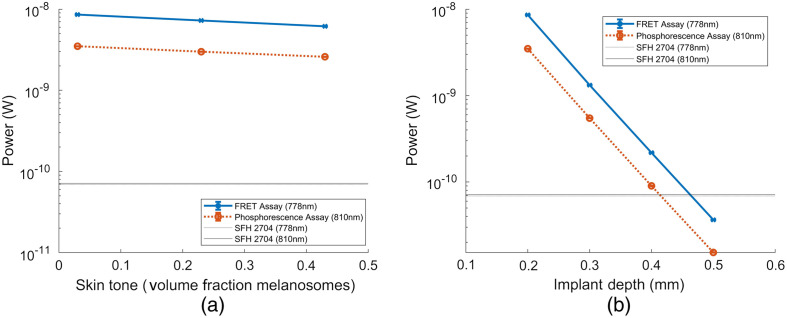
Figure 12 shows the decrease in photoluminescent intensity of each assay’s maximum emission wavelength, 778 and 810 nm for the FRET and phosphorescence lifetime assay, respectively, as a function of implant depth and increase in melanin concentration. Figure 12(a) shows that at the peak emission wavelength, both assays remain detectable from an approximation of Fitzpatrick skin tone I through Fitzpatrick skin tone VI. The percent decrease in signal intensity observed in both assays is 28.5% and 25.9% for the FRET and phosphorescence assay, respectively. Figure 12(b) shows that, at the peak emission wavelength, both assays remain detectable until implantation depth is 0.50 mm. As implant depth increases by 0.1 from 0.20 to 0.50 mm, signal intensity decreases anywhere from 83% to 85% for each iteration. The COV when repeating these simulations in triplicate increases from 0.2% to 0.7%, indicating that 1e7 photons is still sufficient for making these measurements.
Fig. 12.
Parametric sweep of assay power output at a wavelength of maximum intensity. (a) Varying implant depth from 0.30 to 0.50 mm and (b) varying skin tone from 0.03 volume fraction melanosome (∼Fitzpatrick skin tone I) to 0.43 volume fraction melanosome (∼Fitzpatrick skin tone VI).
Overall, the simulations indicate that both the FRET and phosphorescence assays are detectable by this photodiode, but the signal-to-noise ratio is low, especially in cases of deeper implantation and dark skin tone. Thus, future work will involve maximizing the fluorescence output of this biosensor. Additionally, this work features a colocated source and detector. This was done to properly validate these computational models, as an offset between source and detector for the barcode, which does not have rotational symmetry at 90 deg and 180 deg, would lead to spectral changes as smaller-wavelength components of emission spectra will not propagate as far as larger-wavelength components of emission spectra. In practice, this colocated configuration is unlikely to be achievable, and the addition of spacing between the source and detector would reduce the power output of this assay. To this end, it is important to determine an ideal source/detector configuration in follow-up studies.
4. Conclusion
We created a Monte Carlo framework using MCmatlab that predicts the fluorescent output of a fully insertable and multimodal glucose biosensor. The results of this framework were compared against visible wavelength results reported in previous literature and then expanded to estimate the fluorescence output of a biosensor with different assay components and in the red to NIR range. We were able to represent tissue autofluorescence and to quantify the expected fluorescent power output of the red-NIR light actuated barcode to be five orders of magnitude greater than a visible spectrum excited counterpart biosensor. This framework was applied to conceptualize a novel “barcode” glucose biosensor that uses repeating domains of two different sensing modalities, and it was found that such a biosensor should yield an output strong enough to be detectable by an off-the-shelf photodiode. This framework can be used to develop glucose biosensors that use either FRET and/or phosphorescence lifetime decay assays.
Supplementary Material
Acknowledgments
This work was supported by the National Science Foundation Engineering Research Center for Precise Advanced Technologies and Health Systems for Underserved Populations (PATHS-UP) (#1648451) and the National Institutes of Health (R01EB024601, MJM). Thank you to Lydia Colvin for guidance regarding FRET assay development and Minh Nguyen for contributing to work on determining assay theoretical detectability.
Biographies
Jesse Fine is a PhD candidate in biomedical engineering at Texas A&M University. After receiving his bachelor’s degree in biomedical engineering from Ohio State University in 2018, he joined the biomedical engineering department at Texas A&M University as a fellow within PATHS-UP to use computational modeling as a tool to design wearable and implantable optical biosensors toward continuous monitoring.
Michael J. McShane is currently a professor and the department head of biomedical engineering at Texas A&M University, and he holds the James J. Cain professorship II in biomedical engineering. He has 28 years of experience with optical sensor technology development, including new concepts and applications of micro/nanotechnology for implantable optical sensors and related materials and instrumentation. He has published over 300 journal articles, proceedings, and abstracts on these topics. He is a senior member of SPIE and IEEE as well as a fellow of AIMBE.
Gerard L. Coté is a Texas A&M University Regents professor and holds the James J. Cain professorship I in biomedical engineering at Texas A&M University. His research interest includes biomedical sensing for diagnostic and monitoring applications with a recent focus on the development of wearable and handheld medical devices for underserved populations. He is a fellow of four societies (IEEE, SPIE, BMES, and AIMBE), an entrepreneur who has founded several startup companies, and an elected fellow of the National Academy of Inventors.
Disclosures
The authors have no relevant financial interests in this article and no potential conflicts of interest to disclose.
Contributor Information
Jesse Fine, Email: jfine@tamu.edu.
Michael J. McShane, Email: mcshane@tamu.edu.
Gerard L. Coté, Email: gcote@tamu.edu.
Code, Data, and Materials Availability
The code used to generate the results is available in a GitHub repository: https://github.com/TEES-CRHTS/montecarlobarcode.
References
- 1.Zhou D., Greenbaum E., Implantable Neural Prostheses 2: Techniques and Engineering approaches, Springer Science & Business Media; (2010). [Google Scholar]
- 2.Iwasaki W., et al. , “Monitoring of the core body temperature of cows using implantable wireless thermometers,” Comput. Electron. Agric. 163, 104849 (2019). 10.1016/j.compag.2019.06.004 [DOI] [Google Scholar]
- 3.Siontorou C. G., et al. , “Point-of-care and implantable biosensors in cancer research and diagnosis,” in Next Generation Point-of-Care Biomedical Sensors Technologies for Cancer Diagnosis, Chandra P., Tan Y. N., Singh S. P., Eds., pp. 115–132, Springer; (2017). [Google Scholar]
- 4.Chow E., Sanghani S., Morris M., “Wireless MEMS-based implantable medical devices for cardiology,” in Wireless MEMS Networks And Applications, Uttamchandani D., Ed., pp. 77–100, Elsevier; (2017). [Google Scholar]
- 5.Falohun T., McShane M. J., “An optical urate biosensor based on urate oxidase and long-lifetime metalloporphyrins,” Sensors 20(4), 959 (2020). 10.3390/s20040959 [DOI] [PMC free article] [PubMed] [Google Scholar]
- 6.Rodrigues D., et al. , “Skin-Integrated wearable systems and implantable biosensors: a comprehensive review,” Biosensors 10(7), 79 (2020). 10.3390/bios10070079 [DOI] [PMC free article] [PubMed] [Google Scholar]
- 7.Bobrowski T., Schuhmann W., “Long-term implantable glucose biosensors,” Curr. Opin. Electrochem. 10, 112–119 (2018). 10.1016/j.coelec.2018.05.004 [DOI] [Google Scholar]
- 8.Centers for Disease Control and Prevention, National Diabetes Statistics Report, 2020, Centers for Disease Control and Prevention, US Department of Health and Human Services, Atlanta, Georgia: (2020). [Google Scholar]
- 9.Cappon G., et al. , “Wearable continuous glucose monitoring sensors: a revolution in diabetes treatment,” Electronics 6(3), 65 (2017). 10.3390/electronics6030065 [DOI] [Google Scholar]
- 10.Pickup J. C., et al. , “Fluorescence-based glucose sensors,” Biosens. Bioelectron. 20(12), 2555–2565 (2005). 10.1016/j.bios.2004.10.002 [DOI] [PubMed] [Google Scholar]
- 11.Cote G. L., McShane M., Pishko M., “Fluorescence‐based glucose biosensors,” in Handbook of Optical Sensing of Glucose in Biological Fluids and Tissues, Tuchin V. V., Ed., p. 319 (2008). [Google Scholar]
- 12.Brown J. Q., McShane M. J., “Modeling of spherical fluorescent glucose microsensor systems: design of enzymatic smart tattoos,” Biosens. Bioelectron. 21(9), 1760–1769 (2006). 10.1016/j.bios.2005.08.013 [DOI] [PubMed] [Google Scholar]
- 13.Cummins B., et al. , “ConA-based glucose sensing using the long-lifetime Azadioxatriangulenium fluorophore,” Proc. SPIE 8951, 89510A (2014). 10.1117/12.2039824 [DOI] [Google Scholar]
- 14.Jafri R. Z., et al. , “A three-way accuracy comparison of the Dexcom G5, Abbott Freestyle Libre Pro, and Senseonics Eversense CGM devices in an outpatient study of subjects with type 1 diabetes,” Am. Diabetes Assoc. (2018). 10.2337/db18-14-OR [DOI] [PubMed] [Google Scholar]
- 15.Jacques S. L., “Optical properties of biological tissues: a review,” Phys. Med. Biol. 58(11), R37 (2013). 10.1088/0031-9155/58/11/R37 [DOI] [PubMed] [Google Scholar]
- 16.Zeng H., Human Skin Optical Properties and Autofluorescence Decay Dynamics, University of British Columbia; (1993). [Google Scholar]
- 17.Boonya-Ananta T., et al. , “Synthetic Photoplethysmography (PPG) of the radial artery through parallelized Monte Carlo and its correlation to Body Mass Index (BMI),” Sci. Rep. 11(1), 1–11 (2021). 10.1038/s41598-021-82124-4 [DOI] [PMC free article] [PubMed] [Google Scholar]
- 18.Bird G., “Monte-Carlo simulation in an engineering context,” Prog. Astron. Aeronaut. 74, 239–255 (1981). 10.2514/5.9781600865480.0239.0255 [DOI] [Google Scholar]
- 19.Trauth D. M., et al. , “Representation of the molecular structure of petroleum resid through characterization and Monte Carlo modeling,” Energy Fuels 8(3), 576–580 (1994). 10.1021/ef00045a010 [DOI] [Google Scholar]
- 20.Bao-cheng H., et al. , “Using Monte Carlo simulation with crystal ball to improve mergers & acquisitions decision,” in Int. Conf. E-Business and E-Government, pp. 1592–1595 (2010). [Google Scholar]
- 21.Wang L., Jacques S. L., Zheng L., “MCML—Monte Carlo modeling of light transport in multi-layered tissues,” Comput. Methods Prog. Biomed. 47(2), 131–146 (1995). 10.1016/0169-2607(95)01640-F [DOI] [PubMed] [Google Scholar]
- 22.Periyasamy V., et al. , “Experimentally validated Raman Monte Carlo simulation for a cuboid object to obtain Raman spectroscopic signatures for hidden material,” J. Raman Spectrosc. 46(7), 669–676 (2015). 10.1002/jrs.4709 [DOI] [Google Scholar]
- 23.Ramella-Roman J. C., Prahl S. A., Jacques S. L., “Three Monte Carlo programs of polarized light transport into scattering media: part I,” Opt. Express 13(12), 4420–4438 (2005). 10.1364/OPEX.13.004420 [DOI] [PubMed] [Google Scholar]
- 24.Wang X., Wang L. V., “Propagation of polarized light in birefringent turbid media: a Monte Carlo study,” J. Biomed. Opt. 7(3), 279–290 (2002). 10.1117/1.1483315 [DOI] [PubMed] [Google Scholar]
- 25.Jacques S. L., et al. , “Developing an optical fiber reflectance spectrometer to monitor bilirubinemia in neonates,” Proc. SPIE 2975, 115–124 (1997). 10.1117/12.275465 [DOI] [Google Scholar]
- 26.Wang L., Jacques S. L., Monte Carlo Modeling of Light Transport in Multi-Layered Tissues in Standard C, pp. 4–11, The University of Texas, MD Anderson Cancer Center, Houston: (1992). [Google Scholar]
- 27.Swartling J., et al. , “Accelerated Monte Carlo models to simulate fluorescence spectra from layered tissues,” J. Opt. Soc. Am. A 20(4), 714–727 (2003). 10.1364/JOSAA.20.000714 [DOI] [PubMed] [Google Scholar]
- 28.Ren N., et al. , “GPU-based Monte Carlo simulation for light propagation in complex heterogeneous tissues,” Opt. Express 18(7), 6811–6823 (2010). 10.1364/OE.18.006811 [DOI] [PubMed] [Google Scholar]
- 29.Fang Q., “Mesh-based Monte Carlo method using fast ray-tracing in Plücker coordinates,” Biomed. Opt. Express 1(1), 165–175 (2010). 10.1364/BOE.1.000165 [DOI] [PMC free article] [PubMed] [Google Scholar]
- 30.Periyasamy V., Pramanik M., “Monte Carlo simulation of light transport in turbid medium with embedded object—spherical, cylindrical, ellipsoidal, or cuboidal objects embedded within multilayered tissues,” J. Biomed. Opt. 19(4), 045003 (2014). 10.1117/1.JBO.19.4.045003 [DOI] [PubMed] [Google Scholar]
- 31.Fang Q., Boas D. A., “Monte Carlo simulation of photon migration in 3D turbid media accelerated by graphics processing units,” Opt. Express 17(22), 20178–20190 (2009). 10.1364/OE.17.020178 [DOI] [PMC free article] [PubMed] [Google Scholar]
- 32.Bornhoeft L., Biswas A., McShane M., “Composite hydrogels with engineered microdomains for optical glucose sensing at low oxygen conditions,” Biosensors 7(1), 8 (2017). 10.3390/bios7010008 [DOI] [PMC free article] [PubMed] [Google Scholar]
- 33.Cummins B. M., “A rationally-designed fluorescence competitive binding assay for continuous glucose monitoring applications,” Texas A&M University; (2014). [Google Scholar]
- 34.Clement M., Daniel G., Trelles M., “Optimising the design of a broad‐band light source for the treatment of skin,” J. Cosmet. Laser Ther. 7(3-4), 177–189 (2005). 10.1080/14764170500344575 [DOI] [PubMed] [Google Scholar]
- 35.Mahmoud B. H., et al. , “Effects of visible light on the skin,” Photochem. Photobiol. 84(2), 450–462 (2008). 10.1111/j.1751-1097.2007.00286.x [DOI] [PubMed] [Google Scholar]
- 36.Chen X., et al. , “In vivo real-time imaging of cutaneous hemoglobin concentration, oxygen saturation, scattering properties, melanin content, and epidermal thickness with visible spatially modulated light,” Biomed. Opt. Express 8(12), 5468–5482 (2017). 10.1364/BOE.8.005468 [DOI] [PMC free article] [PubMed] [Google Scholar]
- 37.Sandby-Moller J., Poulsen T., Wulf H. C., “Epidermal thickness at different body sites: relationship to age, gender, pigmentation, blood content, skin type and smoking habits,” Acta Dermato Venereol. 83(6), 410–413 (2003). 10.1080/00015550310015419 [DOI] [PubMed] [Google Scholar]
- 38.Van Mulder T., et al. , “High frequency ultrasound to assess skin thickness in healthy adults,” Vaccine 35(14), 1810–1815 (2017). 10.1016/j.vaccine.2016.07.039 [DOI] [PubMed] [Google Scholar]
- 39.Anderson R., Parrish J., “Optical properties of human skin,” in The Science of Photomedicine, Regan J. D., Parrish J. A., Eds., pp. 147–194, Springer; (1982). [Google Scholar]
- 40.Grewer C., Brauer H.-D., “Mechanism of the triplet-state quenching by molecular oxygen in solution,” J. Phys. Chem. 98(16), 4230–4235 (1994). 10.1021/j100067a006 [DOI] [Google Scholar]
- 41.Kolenc O. I., Quinn K. P., “Evaluating cell metabolism through autofluorescence imaging of NAD (P) H and FAD,” Antioxid. Redox Signaling 30(6), 875–889 (2019). 10.1089/ars.2017.7451 [DOI] [PMC free article] [PubMed] [Google Scholar]
- 42.Ferulova I., Lihachev A., Spigulis J., “Photobleaching effects on in vivo skin autofluorescence lifetime,” J. Biomed. Opt. 20(5), 051031 (2015). 10.1117/1.JBO.20.5.051031 [DOI] [PubMed] [Google Scholar]
- 43.Lewis J. A., Escalante-Semerena J. C., “The FAD-dependent tricarballylate dehydrogenase (TcuA) enzyme of Salmonella enterica converts tricarballylate into cis-aconitate,” J. Bacteriol. 188(15), 5479–5486 (2006). 10.1128/JB.00514-06 [DOI] [PMC free article] [PubMed] [Google Scholar]
- 44.Unruh R. M., et al. , “Preclinical evaluation of poly (hema-co-acrylamide) hydrogels encapsulating glucose oxidase and palladium benzoporphyrin as fully implantable glucose sensors,” J. Diabetes Sci. Technol. 9(5), 985–992 (2015). 10.1177/1932296815590439 [DOI] [PMC free article] [PubMed] [Google Scholar]
- 45.Meadows D. L., Schultz J. S., “Design, manufacture and characterization of an optical fiber glucose affinity sensor based on an homogeneous fluorescence energy transfer assay system,” Anal. Chim. Acta 280(1), 21–30 (1993). 10.1016/0003-2670(93)80236-E [DOI] [Google Scholar]
- 46.Cummins B. M., et al. , “Overcoming the aggregation problem: a new type of fluorescent ligand for ConA-based glucose sensing,” Biosens. Bioelectron. 63, 53–60 (2015). 10.1016/j.bios.2014.07.015 [DOI] [PMC free article] [PubMed] [Google Scholar]
- 47.Schaefer P. M., et al. , “NADH autofluorescence—a marker on its way to boost bioenergetic research,” Cytometry Part A 95(1), 34–46 (2019). 10.1002/cyto.a.23597 [DOI] [PubMed] [Google Scholar]
- 48.Borisov S., et al. , “New NIR-emitting complexes of platinum (II) and palladium (II) with fluorinated benzoporphyrins,” J. Photochem. Photobiol. A: Chem. 201(2-3), 128–135 (2009). 10.1016/j.jphotochem.2008.10.003 [DOI] [Google Scholar]
- 49.Amao Y., Okura I., “An oxygen sensing system based on the phosphorescence quenching of metalloporphyrin thin film on alumina plates,” Analyst 125(9), 1601–1604 (2000). 10.1039/b004065g [DOI] [Google Scholar]
- 50.Agostoni E., Aliprandi A., “Migraine and hypertension,” Neurol. Sci. 29(1), 37 (2008). 10.1007/s10072-008-0883-8 [DOI] [PubMed] [Google Scholar]
- 51.Wu Y., Qu J. Y., “Autofluorescence spectroscopy of epithelial tissues,” J. Biomed. Opt. 11(5), 054023 (2006). 10.1117/1.2362741 [DOI] [PubMed] [Google Scholar]
- 52.Choi H., Yang Z., Weisshaar J. C., “Single-cell, real-time detection of oxidative stress induced in Escherichia coli by the antimicrobial peptide CM15,” Proc. Natl. Acad. Sci. U. S. A. 112(3), E303–E310 (2015). 10.1073/pnas.1417703112 [DOI] [PMC free article] [PubMed] [Google Scholar]
- 53.Huang Z., et al. , “Cutaneous melanin exhibiting fluorescence emission under near-infrared light excitation,” J. Biomed. Opt. 11(3), 034010 (2006). 10.1117/1.2204007 [DOI] [PubMed] [Google Scholar]
- 54.Croce A. C., Bottiroli G., “Autofluorescence spectroscopy and imaging: a tool for biomedical research and diagnosis,” Eur. J. Histochem. 58(4), 2461 (2014). 10.4081/ejh.2014.2461 [DOI] [PMC free article] [PubMed] [Google Scholar]
- 55.Vasil’ev V., et al. , “Dimerization, aggregation, and luminescent properties of palladium (II) and platinum (II) complexes with meso-tetrakis (4-carboxyphenyl) porphyrin,” Russ. J. Inorg. Chem. 48(3), 385–390 (2003). [Google Scholar]
- 56.Chen Z.-A., et al. , “Encapsulation of palladium porphyrin photosensitizer in layered metal oxide nanoparticles for photodynamic therapy against skin melanoma,” Sci. Technol. Adv. Mater. 16(5), 054205 (2015). 10.1088/1468-6996/16/5/054205 [DOI] [PMC free article] [PubMed] [Google Scholar]
- 57.Vinogradov S. A., et al. , “Frequency domain instrument for measuring phosphorescence lifetime distributions in heterogeneous samples,” Rev. Sci. Instrum. 72(8), 3396–3406 (2001). 10.1063/1.1386634 [DOI] [Google Scholar]
- 58.Grabovskis A., et al. , “Effect of probe contact pressure on the photoplethysmographic assessment of conduit artery stiffness,” J. Biomed. Opt. 18(2), 027004 (2013). 10.1117/1.JBO.18.2.027004 [DOI] [PubMed] [Google Scholar]
- 59.Antelmi I., et al. , “Influence of age, gender, body mass index, and functional capacity on heart rate variability in a cohort of subjects without heart disease,” Am. J. Cardiol. 93(3), 381–385 (2004). 10.1016/j.amjcard.2003.09.065 [DOI] [PubMed] [Google Scholar]
- 60.Yova D. M., Hovhannisyan V. A., Theodossiou T., “Photochemical effects and hypericin photosensitized processes in collagen,” J. Biomed. Opt. 6(1), 52–58 (2001). 10.1117/1.1331559 [DOI] [PubMed] [Google Scholar]
- 61.Karsdal M., Biochemistry of Collagens, Laminins and Elastin: Structure, Function and Biomarkers, Academic Press; (2019). [Google Scholar]
- 62.Vahlquist A., et al. , “Vitamin A in human skin: II Concentrations of carotene, retinol and dehydroretinol in various components of normal skin,” J. Investig. Dermatol. 79(2), 94–97 (1982). 10.1111/1523-1747.ep12500033 [DOI] [PubMed] [Google Scholar]
- 63.Hemley R., Kohler B., Siviski P., “Absorption spectra for the complexes formed from vitamin-A and beta-lactoglobulin,” Biophys. J. 28(3), 447 (1979). 10.1016/S0006-3495(79)85192-9 [DOI] [PMC free article] [PubMed] [Google Scholar]
- 64.Peterson P. A., Rask L., “Studies on the fluorescence of the human vitamin A-transporting plasma protein complex and its individual components,” J. Biol. Chem. 246(24), 7544–7550 (1971). 10.1016/S0021-9258(19)45809-2 [DOI] [PubMed] [Google Scholar]
- 65.Nivetha K. B., Sujatha N., “Development of thin skin mimicking bilayer solid tissue phantoms for optical spectroscopic studies,” Biomed. Opt. Express 8(7), 3198–3212 (2017). 10.1364/BOE.8.003198 [DOI] [PMC free article] [PubMed] [Google Scholar]
- 66.Islam S. D., et al. , “Fluorescence quenching of flavin adenine dinucleotide in aqueous solution by pH dependent isomerisation and photo-induced electron transfer,” Chem. Phys. 295(2), 137–149 (2003). 10.1016/j.chemphys.2003.08.013 [DOI] [Google Scholar]
- 67.Gotardo F., et al. , “Investigating the intersystem crossing rate and triplet quantum yield of Protoporphyrin IX by means of pulse train fluorescence technique,” Chem. Phys. Lett. 674, 48–57 (2017). 10.1016/j.cplett.2017.02.055 [DOI] [Google Scholar]
- 68.Nordlund J. J., et al. , The Pigmentary System: Physiology and Pathophysiology, Oxford University Press, New York: (1998). [Google Scholar]
- 69.Jacques S., “Optical absorption of melanin,” https://omlc.org/spectra/melanin/.
- 70.Nighswander-Rempel S. P., et al. , “A quantum yield map for synthetic eumelanin,” J. Chem. Phys. 123(19), 194901 (2005). 10.1063/1.2075147 [DOI] [PubMed] [Google Scholar]
- 71.Collier B., Long R., McShane M., “Dual-probe luminescence lifetime measurements for the oxygen compensation in enzymatic biosensors,” in Sensors, 2009 IEEE, pp. 703–706 (2009). 10.1109/ICSENS.2009.5398556 [DOI] [Google Scholar]
- 72.Nilsson L., Johansson A., Kalman S., “Macrocirculation is not the sole determinant of respiratory induced variations in the reflection mode photoplethysmographic signal,” Physiol. Meas. 24(4), 925 (2003). 10.1088/0967-3334/24/4/009 [DOI] [PubMed] [Google Scholar]
- 73.Ram M. R., et al. , “A novel approach for motion artifact reduction in PPG signals based on AS-LMS adaptive filter,” IEEE Trans. Instrum. Meas. 61(5), 1445–1457 (2011). 10.1109/TIM.2011.2175832 [DOI] [Google Scholar]
- 74.Ibey B. L., et al. , “Competitive binding assay for glucose based on glycodendrimer− fluorophore conjugates,” Anal. Chem. 77(21), 7039–7046 (2005). 10.1021/ac0507901 [DOI] [PubMed] [Google Scholar]
- 75.Ziegler K. J., “Developing implantable optical biosensors,” Trends Biotechnol. 23(9), 440–444 (2005). 10.1016/j.tibtech.2005.07.006 [DOI] [PubMed] [Google Scholar]
- 76.Andrus L. P., et al. , “Characterization of lactate sensors based on lactate oxidase and palladium benzoporphyrin immobilized in hydrogels,” Biosensors 5(3), 398–416 (2015). 10.3390/bios5030398 [DOI] [PMC free article] [PubMed] [Google Scholar]
- 77.You Y.-H., et al. , “SERS-active smart hydrogels with modular microdomains: from pH to glucose sensing,” IEEE Sens. J. 17(4), 941–950 (2016). 10.1109/JSEN.2016.2636020 [DOI] [Google Scholar]
- 78.Fereidouni F., et al. , “Phasor analysis of multiphoton spectral images distinguishes autofluorescence components of in vivo human skin,” J. Biophotonics 7(8), 589–596 (2014). 10.1002/jbio.201200244 [DOI] [PubMed] [Google Scholar]
- 79.Riley P., “Melanin,” Int. J. Biochem. Cell Biol. 29(11), 1235–1239 (1997). 10.1016/S1357-2725(97)00013-7 [DOI] [PubMed] [Google Scholar]
- 80.Meigel W. N., Gay S., Weber L., “Dermal architecture and collagen type distribution,” Arch. Dermatol. Res. 259(1), 1–10 (1977). 10.1007/BF00562732 [DOI] [PubMed] [Google Scholar]
- 81.Lawson-Wood K., Upstone S., Evans K., Determination of Relative Fluorescence Quantum Yields using the FL6500 Fluorescence Spectrometer, PerkinElmer Inc; (2018). [Google Scholar]
- 82.Bharucha E., Gosselin B., Lellouche F., “A long-lifetime, low-cost self-tuning patch oximeter for ventilation therapy,” in 18th IEEE Int. New Circuits and Syst. Conf. (NEWCAS), pp. 327–330 (2020). [Google Scholar]
- 83.Retch S., “Health monitoring,” Application Note No. AN147, L. Florian, Ed., osram.com (2020).
- 84.Smith M. H., Fork R. L., Cole S. T., “Safe delivery of optical power from space,” Opt. Express 8(10), 537–546 (2001). 10.1364/OE.8.000537 [DOI] [PubMed] [Google Scholar]
- 85.Kumosa L. S., et al. , “Permeability of subcutaneous tissues surrounding long-term implants to oxygen,” Biomaterials 35(29), 8287–8296 (2014). 10.1016/j.biomaterials.2014.05.012 [DOI] [PMC free article] [PubMed] [Google Scholar]
- 86.Zeng H., et al. , “Reconstruction of in vivo skin autofluorescence spectrum from microscopic properties by Monte Carlo simulation,” J. Photochem. Photobiol. B: Biol. 38(2–3), 234–240 (1997). 10.1016/S1011-1344(96)00008-5 [DOI] [PubMed] [Google Scholar]
- 87.Jun Y. W., et al. , “Addressing the autofluorescence issue in deep tissue imaging by two-photon microscopy: the significance of far-red emitting dyes,” Chem. Sci. 8(11), 7696–7704 (2017). 10.1039/C7SC03362A [DOI] [PMC free article] [PubMed] [Google Scholar]
- 88.Wegner W., et al. , “In vivo mouse and live cell STED microscopy of neuronal actin plasticity using far-red emitting fluorescent proteins,” Sci. Rep. 7(1), 1–10 (2017). 10.1038/s41598-017-11827-4 [DOI] [PMC free article] [PubMed] [Google Scholar]
- 89.Uttamlal M., Holmes-Smith A. S., “The excitation wavelength dependent fluorescence of porphyrins,” Chem. Phys. Lett. 454(4–6), 223–228 (2008). 10.1016/j.cplett.2008.02.012 [DOI] [Google Scholar]
Associated Data
This section collects any data citations, data availability statements, or supplementary materials included in this article.


