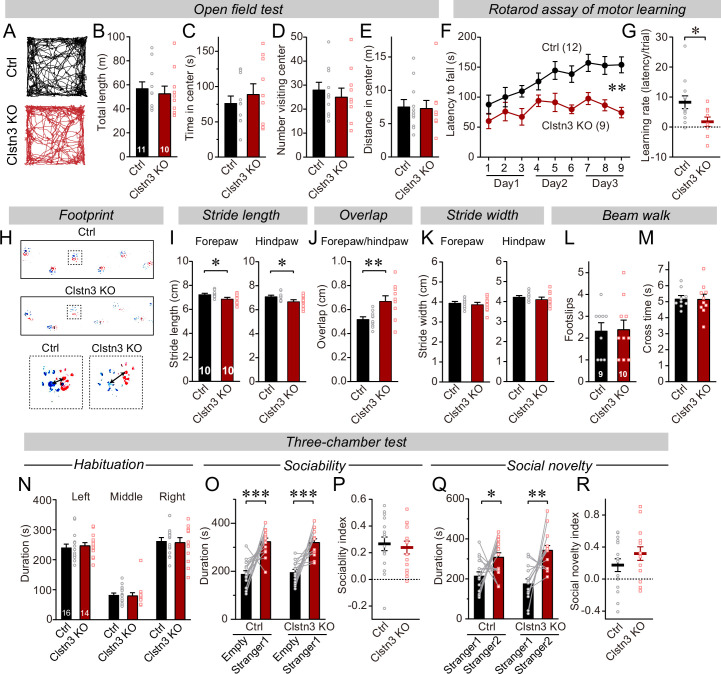
Figure 3. The CRISPR/Cas9-mediated deletion of Clstn3 in cerebellum impairs motor learning and gait performance.
(A–E) The CRISPR-mediated Clsn3 KO had no effects on the open field behaviors. (A, representative tracks for both control and Clstn3 KO; B, total length travelled (m); C, time spent in center; D, number of the mice visiting center; E, distance in center). (F & G) The CRISPR-mediated Clstn3 KO in the cerebellum severely impairs motor learning as analyzed by the rotarod assay (F, rotarod learning curve; G, slope of rotarod curve used as an index of the learning rate). (H–K) Clstn3 deletion significantly impaired gait performance. (H, upper images are representative footprints from both control and Clstn3 KO group, the lower shows footprints of forepaw and hindpaw placements; I, stride length of forepaw and hindpaw from both control and Clstn3 KO groups; J, distance between the center of forepaw and hindpaws; K, stride width of forepaw and hindpaw from both groups). (L & M) Beam walk test reveal no difference between the control group and the Clstn3 KO group. (L, footslips; M, cross times).(N–R) CRISPR deletion of Clstn3 in the cerebellum in vivo does not affect social behaviors. (N, control and Clstn3 KO mice exhibited the same exploration behavior of the left and right chambers during the habituation period O and P, test mice were exposed to a non-familiar ‘stranger’ mouse in one of the outer chambers O, the time that the test mouse spent in the chambers with empty cup or ‘stranger1’ mouse; P, sociability index). Q & R, test mice were given the choice between exploring a ‘stranger 1’ mouse to which it was previously exposed, or a ‘stranger 2’ mouse that is novel, both control and cerebellar Clstn3 KO mice prefer the novel mouse for interactions (Q, the same as O, except empty cup has ‘stranger2’; R, social novelty index). All data are means ± SEM. Statistical analyses were performed using double-tailed and unpaired t-test for panels B-E, G, I-M, N, P, and R. Double-tailed paired t-tests were applied to analyze panel O and Q, *p < 0.05, **p < 0.01, ***p < 0.001. Repeat-measures ANOVA was applied for rotarod curve in panel F (F(1, 19) = 11.791, **p < 0.01). Numbers of animals for each experiment are indicated in graphs.

