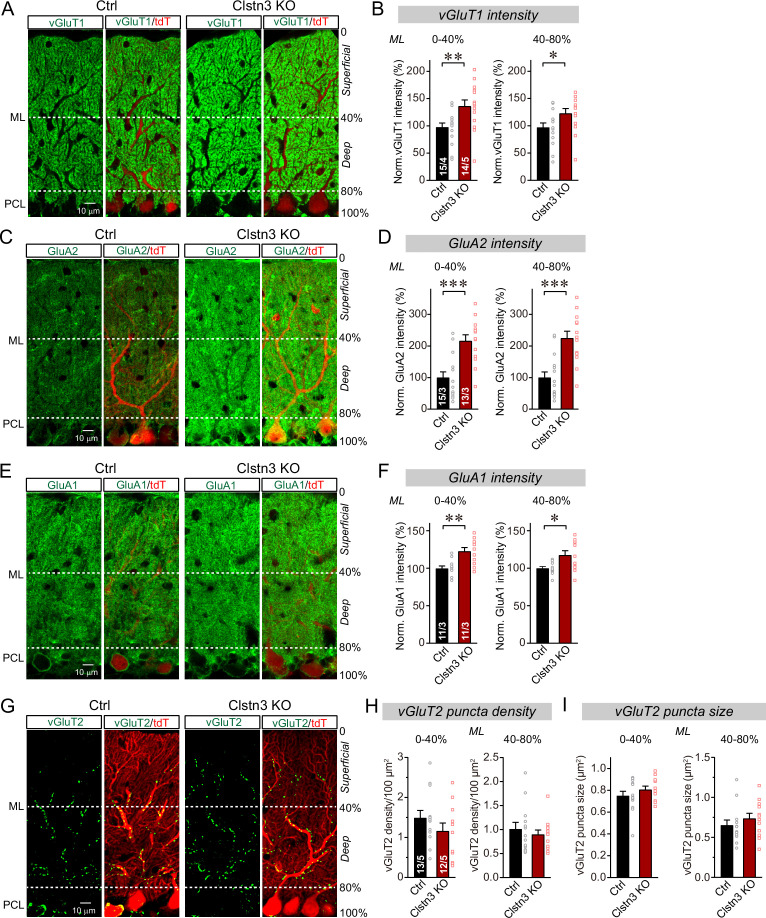
Figure 7. CRISPR-mediated Clstn3 deletion in the cerebellar cortex increases parallel-fiber excitatory synapse numbers without changing climbing-fiber synapse numbers.
(A & B) Immunostaining of cerebellar cortex sections an with antibody to vGluT1 as a presynaptic marker for parallel-fiber synapses reveals a significant increase (A, representative confocal images from control and Clstn3 KO mice [green vGluT1; red, tdTomato]; (B) summary graphs of the vGluT1 staining intensity in the superficial (0–40%) and deep (40–80%) molecular layers of the cerebellar cortex). Note that the staining intensity is used as a proxy for synapse density since individual parallel-fiber synapse puncta cannot be resolved. (C & D) Immunostaining with an antibody to GluA2 as a postsynaptic marker for parallel-fiber synapses confirms the robust increase in parallel-fiber synapse abundance observed with vGluT1 staining (E, representative confocal images from control and Clstn3 KO mice [green, GluA2; red, tdTomato]; F, summary graphs of the GluA2 staining intensity in the superficial (0–40%) and deep (40–80%) molecular layers of the cerebellar cortex). (E & F) Immunostaining with antibody to GluA1, an astroglial marker for tripartite parallel-fiber synapses containing Bergmann glia processes, also uncovers a significant increase in staining intensity (C, representative confocal images from control and Clstn3 KO samples [green vGluT1; red, tdTomato]; (D) summary graphs of the GluA1 staining intensity in the superficial (0–40%) and deep (40–80%) molecular layers of the cerebellar cortex). (G–I) Immunostaining for vGluT2 as a marker for climbing-fiber synapses in cerebellar cortex fails to detect a Clstn3 KO-induced change (G, representative confocal images [green, vGluT2; red, tdTomato]; (H & I) summary graphs of the density (H) and size (I) of vGluT2-positive synaptic puncta in the superficial (0–40%) and deep (40–80%) molecular layers of the cerebellar cortex). All numerical data are means ± SEM; numbers of sections/mice analyzed are indicated in the first bar graphs for each experiment. Statistical significance was assessed by unpaired Student’s t-test (*p < 0.05, **p < 0.01, ***p < 0.001).

