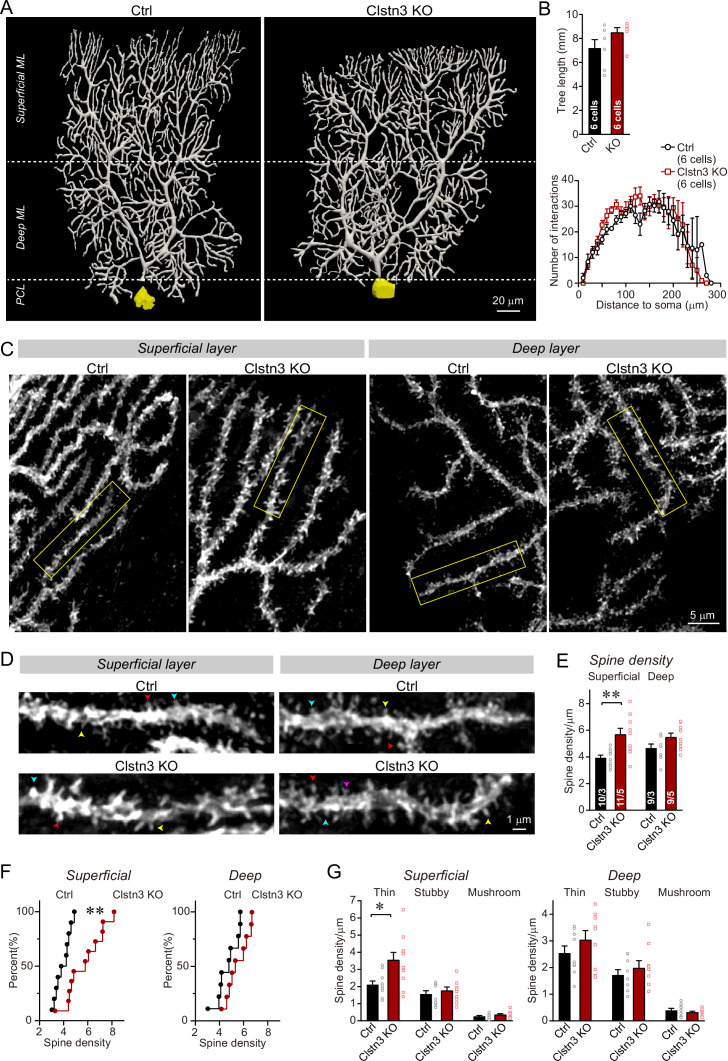
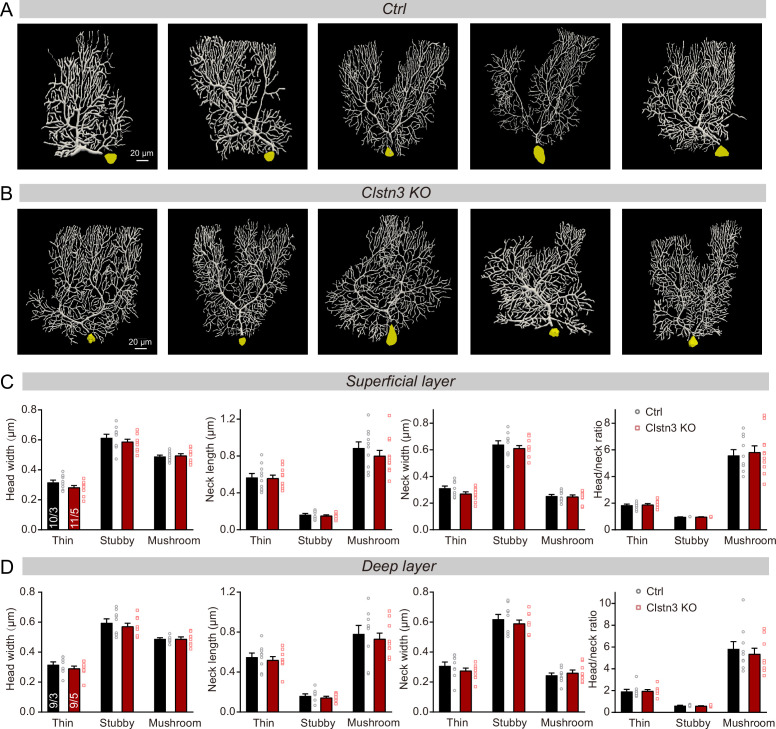
Figure 8. Morphological analysis of individual Purkinje cells reveals that the Clstn3 KO robustly increases the dendritic spine density of Purkinje cells without significantly altering their dendritic arborization.
(A & B) Biocytin filling of individual Purkinje cells via a patch pipette demonstrates that the Clstn3 KO does not significantly change the overall dendritic architecture of Purkinje cells (A, representative images of Purkinje cell dendritic trees for control and Clstn3 KO mice after 3D reconstruction [for more images, see , Figure 8—figure supplement 1]; B, quantifications of the dendritic tree length [top] or dendritic arborization using Scholl analysis [bottom]). (C–F) The Clstn3 KO increases the density of dendritic spines of Purkinje cells in the superficial part of the cerebellar cortex (C & D, representative images of spiny dendrites at low and high magnifications, respectively; [blue, red, and yellows arrowheads mark different spine types]; (E & F) summary graph [E] and cumulative distribution of the spine density [F]). (G) The Clstn3 KO in Purkinje cells increases preferentially the density of thin spines in the superficial part of the cerebellar cortex, based on a morphological classification of spine types into thin, stubby and mushroom spines. All data in B, E, and G are means ± SEM; 6 control and Clstn3 KO Purkinje cells were reconstructed for B; numbers in the first bars of E indicate the number of cell/animal analyzed for E-G. Statistical significance (*p < 0.05; **p < 0.01) in B and G was assessed by an unpaired t-test, and in E by one-way ANOVA (F(3, 35) = 5.693, p = 0.003), followed by Tukey’s post hoc comparisons for control and Clstn3 KO groups.


