Abstract
Neuron-specific enolase (NSE) is one of the most commonly used serum tumor biomarker in clinical practice for small cell lung cancer screening, early diagnosis, evaluation of therapeutic efficacy and prognosis. In this study, we obtained DNA aptamers with great affinity and selectivity to NSE via subtractive SELEX approach. After 10 rounds, three candidate aptamers were successfully selected and identified. Their affinities were measured by surface plasmon resonance. Apt-5 aptamer with high binding affinity and good specificity were obtained, which had the dissociation constant (KD) values of 12.26 nM. In addition, electrophoretic mobility shift assay (EMSA) experiment also further indicated that the Apt-5 had a highly specific affinity to NSE without binding to HSA. The circular dichroism (CD) analysis revealed that the three aptamers formed stable B-form, stem-loop conformations. The selected aptamers were used to construct a chemiluminescence (CL) aptasensor biosensing platform to detect NSE from actual serum samples. Experimental results confirmed that the CL immunosensing platform had good sensitivity with detection limits of 1–100 ng mL−1. The results demonstrated that our obtained the Apt-5 aptsensor was highly specific in the detection of NSE in serum samples. The detection limit was 0.1 ng mL−1, which was lower than the 0.25 ng mL−1 limit of the ELISA used at the hospital. Moreover, the aptasensor can contribute to better detection of small cell lung cancer (SCLC).
Neuron-specific enolase (NSE) is one of the most commonly used serum tumor biomarker in clinical practice for small cell lung cancer screening, early diagnosis, evaluation of therapeutic efficacy and prognosis.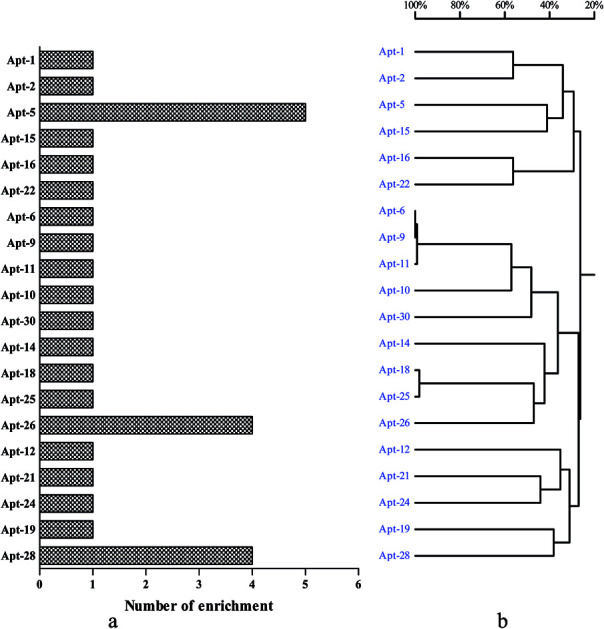
Introduction
Recently, a number of based on aptamer for the early diagnosis and rapid evaluation of therapeutic efficacy and prognosis of cancer have been developed.1,2 Neuron-specific enolase, an intracellular metalloenzyme (phosphopyruvate dehydrogenase), is a dimeric protein with tissue specificity of the expression of 3 different subunits (α, β and γ).3 NSE was widely used to screen and diagnose small cell lung cancer in high-risk populations.4,5 Usually, the concentration of NSE is relatively low in human serum (<13 ng mL−1),6 and the sample amount is also very limited.7 In addition, the earlier the SCLC is diagnosed, a significantly improved in the five-year survival rate of the patients is observed.8 Although the immunological method, like enzyme-linked immunosorbent assay (ELISA), is a widely used method for NSE detection.9 The ELISA method are popular at present, but the procedure is relatively complex and time-consuming sometimes.10 Therefore, to develop a fast and effective method for NSE detection remedy the extant weaknesses is essential in tumor marker monitoring program as well as clinical diagnosis.
Aptamers are short single-stranded DNA (ssDNA) or RNA molecules that can bind to their target with high selectivity and specificity by folding into three dimensional structures.11,12 They can be generated by the systematic evolution of exponential enrichment (SELEX) technique in vitro.13 Compared with antibodies, aptamers would be promising recognition elements for bioanalysis because of their high affinity and specificity with various kinds of targets,14 low molecular weight, reproducible synthesis,15 facile modification, and good stability.16
Aptamers for various targets have been selected and used for designing biosensors. Karpik et al. developed an aptamer-based biosensor to detect Mucin 1 protein to monitor Prostatic cancer (PCa).17 Fluorescent assay based on aptamer and amplification were further applied to design biosensor to detect prostate specific antigen (PSA).18 However, there is still no aptamer for NSE to be selected.
In this study, a subtractive SELEX process for the selection of DNA aptamers with high affinity and strong specificity for NSE was described. Enrichment of the ssDNA libraries was evaluated by qPCR. The Apt-5 had the highest binding affinity with the lowest KD value (12.26 nM). EMSA experiment also indicated that the Apt-5 had a highly specific affinity to NSE without binding to HSA. Detection of NSE in serum samples is carried out commonly using an immunoassay that depends on two-site antibody–antigen interactions, such as an enzyme-linked immunosorbent assay (ELISA). However, despite antibodies still being frequently used as receptors in immuno-based bioassays, aptamers constitute promising alternatives. Herein, we describe the first in vitro selection of DNA aptamers by subtractive SELEX and the development of a novel CL aptasensor for the highly sensitive and specific detection of NSE in serum samples.
Materials and methods
Chemicals
The NSE (1 mg mL−1) and carcino-embryonic antigen (CEA) (1 mg mL−1) were provided by Shanghai Sangon Biotechnology Co., Ltd., China.
The DNA library (5′-CTATAGCAATGGTACGGTACTTCC-N40-CAAAAGTGCACGCTACTTTGCTAA-3′) contained a central randomized sequence of 40 nucleotides (N40) flanked by 24 nucleotide constant regions and primers (forward primer 5′-CTATAGCAATGGTACGGTACTTCC-3′, reverse primer 5′-biotin-5′-TTAGCAAAGTAGCGTGCACTTTTG-3′) were supplied by Sangon Biotechnology (Shanghai, China). Carboxylated magnetic beads (MBs, 30 mg mL−1, 2 × 10⁹ beads mL−1) were supplied by Invitrogen (Carlsbad, CA, USA).
The binding buffer solution was a mixture of phosphate-buffered saline (1 × PBS = 137 mM NaCl, 2.7 mM KCl, 10 mM Na2HPO4 and 2 mM KH2PO4, pH 7.4) (Invitrogen Co., USA). 1 × PBST (1 × PBS + 1% (v/v) Tween-20) were stored at 4 °C. All related PCR reagents were gained from Sangon Biotech (Shanghai, China). All reagents used in this work were of analytical grade.
The small cell lung cancer serum, non-small cell lung cancer serum and normal serum were supplied by the first hospital of Qinhuangdao, Hebei Province in China.
Aptamer selection
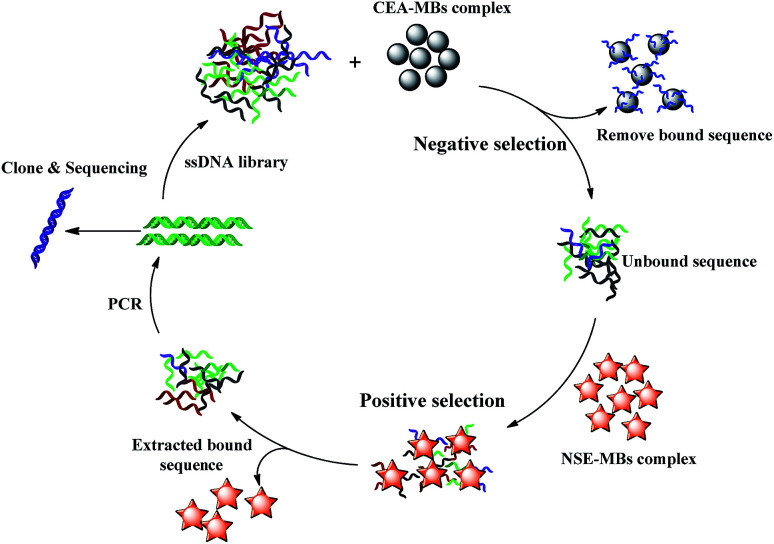
A schematic diagram of the SELEX process is shown in Scheme 1. The subtractive SELEX strategy as described previously was performed with a few modifications.19 Briefly, NSE (10 μg mL−1 in PBS, pH 7.4, 500 μL) was immobilized onto the MBs (200 μL, about 4 × 10⁸ beads) through amidation between amino and carboxylic group coated on the MBs surface at 37 °C for 2 h. After the incubation step, the MBs–NSE complex were resuspended in blocking buffer (0.1 μg μL−1 Salmon sperm DNA, 0.1 μg μL−1 tRNA, 1% BSA in PBS buffer, 1 mL) at 37 °C for 30 min to eliminate the risk of unspecific binding. The initial ssDNA library (OD: 1.0) dissolved in 3 mL of PBS solution was denatured at 95 °C for 10 min and then snap cooled at 4 °C. The MBs–NSE complex in a 5 mL EP tube were incubated with the prepared initial library for 1 h at 37 °C for positive selection. After magnetic separation, the unbound ssDNA supernatant were discarded. The MBs–NSE–ssDNA complexes were washed three times with 3 mL of binding buffer to remove unbound sequences. The NSE-bound ssDNAs were eluted by heating at 95 °C for 10 min. After magnetic separation, the supernatant was collected and amplified by qPCR using forward primer and biotin-labeled reverse primer under the following conditions: pre-denaturing at 95 °C for 7 min, followed by 20 or 25 cycles of denaturing at 95 °C for 30 s, annealing at 60 °C for 34 s and extension at 72 °C for 1 min. The obtained double-stranded DNA (dsDNA) product in the PCR solution was separated by streptavidin-coated MBs, TPBS solution (1 wt%, 1 mL) was added, and the mixture was incubated for 10 min at 40 °C. The ssDNA library was collected and used later for next round selection.
Scheme 1. Schematic diagram of the SELEX process.
The levels of carcinoembryonic antigen (CEA) can be related to lung adenocarcinoma and SCLC.20 For the SELEX strategy, CEA-MBs were introduced for negative selection. The CEA–MBs complex were incubated with the selected ssDNA library at 37 °C for 1 h. The unbound ssDNAs were removed and then incubated with the MBs–NSE complex for further positive selection.
In order to acquire aptamers with high affinity and specificity. Incubation time with NSE–MBs complex were decreased from 60 min to 30 min as the number of selection rounds increased as well as the washing strength was enhanced by gradually increasing washing time (from 1 min to 3 min), washing volume (from 3 mL to 6 mL) and washing times (from 3 to 5 times).
After 10 selection cycles, q-PCR was used to monitor the enrichment of the DNA libraries according to the ΔCT value. The progression of the selection was represented by the CT value (ΔCT = CT (CEA) − CT (NSE)). The NSE-binding ssDNA and CEA-binding ssDNA were eluted by heating at 95 °C for 10 min in each round of selection progress. After magnetic separation, the supernatant was collected separately. Finally, 6 μL of the supernatant containing the ssDNA was used for quantification through qPCR. Aptamer was amplified with Taq DNA polymerase using a SYBR® Green master mix. Samples were heated at 95 °C for 7 min followed by 40 cycles of denaturation at 95 °C for 30 s, annealing at 60 °C for 34 s, extension at 72 °C for 1 min and hold on 4 °C. The data were analyzed with the Rotor-Gene 6000 Series Software (Corbett Life Science, USA). The SELEX cycle was terminated until the ΔCT value remains unchanged.
Cloning and sequencing
After 10 rounds of SELEX, the winning pool was harvested. The ssDNA library from the 10th selection round was PCR amplified using unmodified primers, the PCR products were sent for cloning and sequencing by Sangon Biotechnology (Shanghai, China).
As we known, aptamers can fold into complex and stable three-dimensional shapes that allows them to specifically bind to target molecules. The secondary structure of each candidate aptamer sequence was predicted using NUPACK software.21,22
Determination of KD values of individual aptamers
The dissociation constant (KD) of the candidate aptamers to NSE were measured by surface plasmon resonance (SPR) via a BIAcore T200 instrument (GE Healthcare Life Sciences, USA). HEPES buffer was used as the running buffer and NSE (50 μg mL−1, 500 μL) were immobilized onto CM5 chip according to the standard protocol of the amine-coupling method (BIAapplication Handbook). The candidate aptamer were diluted to a series of concentration and following procedures were implemented automatically for repetitive cycles of sample injection and regeneration (2 M MgCl2). The association and disassociation of the aptamer–NSE conjugates were monitored for 300 s.23,24 The statistical analysis of the KD values was measured by the kinetic Evaluation Software.
CD analysis
To determine possible secondary structure characteristics. Three candidate aptamers (5 μM) were dissolved in 20 mM Na3PO4 (pH 7.4) that contained 100 mM KCl or NaCl. Aptamers were denatured under 90 °C for 5 min and followed by gradually cooling to room temperature. CD spectra were collected by a JASCO J-810 spectropolarimeter from 320–220 nm, with a 1 cm path length cuvette.
Identification of the highest binding affinity aptamer by EMSA assay
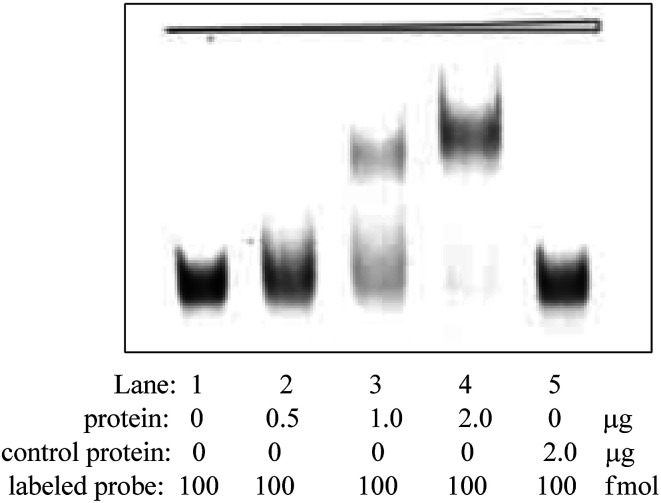
A series of progressively diluted NSE (0.5 μg, 1 μg, 2 μg) were respectively incubated with in PBS solution (20 μL) of containing labeled Apt-5 (100 fmol). The labeled Apt-5 were heated to 95 °C for 10 min and cooled at 4 °C for 10 min before incubation. Human serum albumin (HSA, 2 μg) was incubated with in PBS solution (20 μL) of containing labeled Apt-5 (100 fmol) as a negative control. The complexes were then evaluated by electrophoresis on an 8% native polyacrylamide gel.
Construction of a CL aptasensor
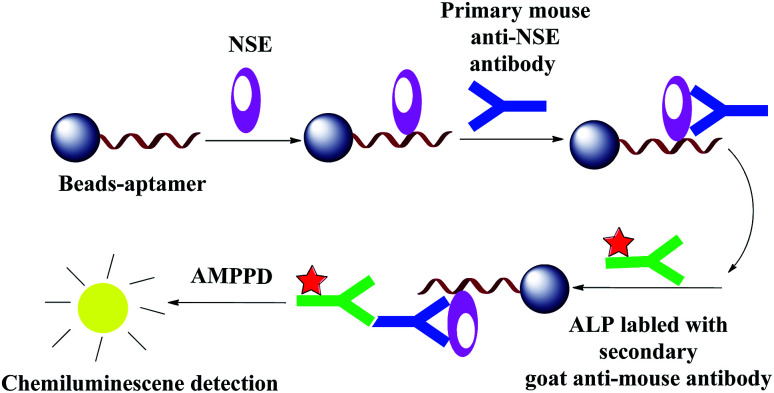
The advantages of CL method are high sensitivity, wide linear dynamic range, relatively simple operation requirements,25 and low equipment cost.26 Construction of a CL aptasensor based on magnetic beads separation and aptamer is shown in Scheme 2.
Scheme 2. Construction of a CL aptasensor based on magnetic separation and aptamer.
Amino-modified Apt-5 was synthesized by Shanghai Biotechnology (Shanghai, China). First, the carboxylated MBs was mixed with amino-modified Apt-5 and incubated for 1 h at 37 °C with gentle shaking. After magnetic separation, the MBs–Apt-5 complex were collected and the supernatants were discarded. Then blocking buffer added as a blocking agent for 1 h at 37 °C. The blocking buffer can effectively prevent nonspecific binding with any possible interfering proteins. Second, the composites were incubated with NSE solution (100 ng mL−1). Then, standard solution containing a range of concentrations of the primary mouse NSE antibody and secondary goat antimouse antibody labeled with alkaline phosphatase (ALP) were added to the incubating solution. Finally, after magnetic separation, CL of AMPPD was catalyzed by the complexes. The CL detection of different concentrations of NSE for standards or serum samples were performed using an Enspire 2300 multilabel reader.
Test of selectivity and sensitivity
Different interfering serum samples including normal serum, NSCLC serum and SCLC serum were used to examine the selectivity of Apt-5. These interfering serum samples were used as negative controls and SCLC serum as a positive control. NSE in positive SCLC serum was diluted to a series of concentrations (100, 50, 10, 1, and 0.1 ng mL−1). A 50 μL aliquot of each of the serum samples was used in each test. Each experiment was repeated 3 times for averaging.
Results and discussions
Selection of DNA aptamers against NSE
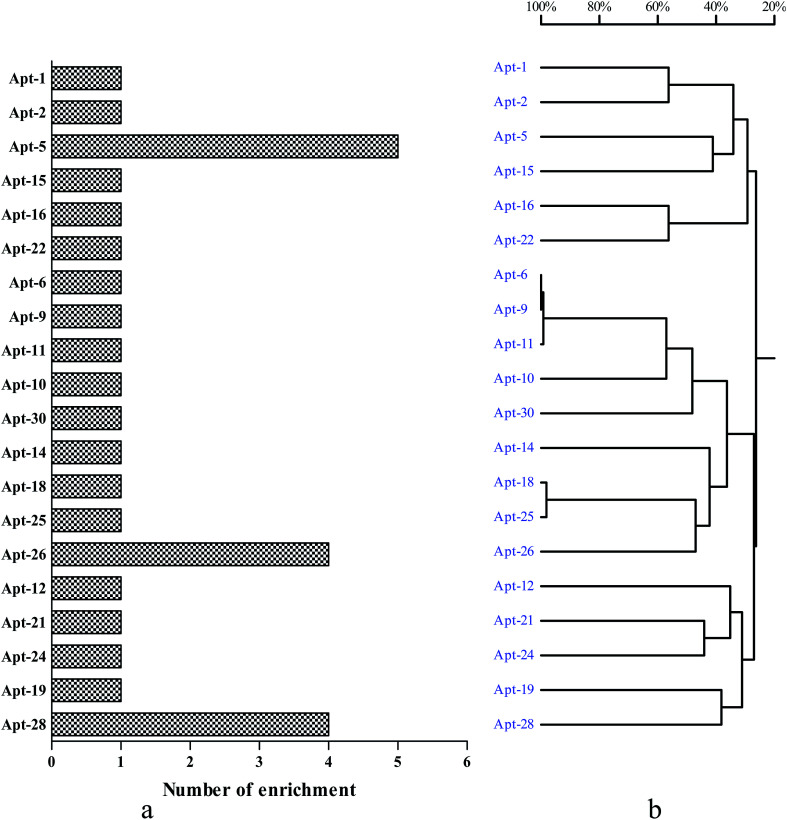
To select high affinity aptamers for NSE, we performed an in vitro MB-SELEX by using NSE as target protein. In order to ensure proper folding of the oligonucleotide structure, the ssDNA library was first heated at 95 °C for 10 min and cooled at 4 °C for 10 min. Ten SELEX rounds were performed in total in the process of selecting an aptamer against NSE. The progress of the SELEX procedure was monitored using qPCR for the ssDNA libraries from round 1 to 10 with the described method in Section 2.2. The change in ΔCT value directly represents the convergence of aptamer species in the SELEX process. The binding affinity of specific aptamer library from the selected rounds increased. Therefore, in our study, by the end of the 10th round of selection, the ΔCT value showed was not increased, which indicated that the enriched aptamer library was specific to NSE and had reached saturation. Therefore, the selection was stopped. The secondary ssDNA library from the 10th round with the highest binding affinity was cloned and thirty clones were sequenced. These sequences were clustered with DNAMAN version 6.0 software. These sequence of NSE aptamers were divided into five major families based on homology (Table S1, ESI†). As shown in Fig. 1. Considering that the most frequently repeated sequence has been found to have the highest binding affinity. We chose the three that were most highly amplified in the selection process, Apt-5, Apt-26 and Apt-28, which were enriched five, four and four times, respectively. These three aptamers were required further identification, and their sequences were listed in Table 1.
Fig. 1. Generation of aptamers against NSE. (a) The number of enrichment is shown in the left column chart. (b) DNAMAN analysis of 30 oligonucleotide sequences after 10 rounds of SELEX.
A list of the three sequences identified from the 40 nt randomized region of the library after 10 rounds of subtractive SELEX against NSE.
| Aptamer | Sequence (5′–3′) |
|---|---|
| Apt-5 | TCACACACGGACCTCTCCTACATTAATTGCGCATTTCGTT |
| Apt-26 | GGGTTTAATTGCTCTCAGGTTATTCGTCTGAGGTAATGCG |
| Apt-28 | ATCACGAATGTCGAGGCTCCTTTCCGCCCTGTCTGCTCGT |
Characterization of aptamers
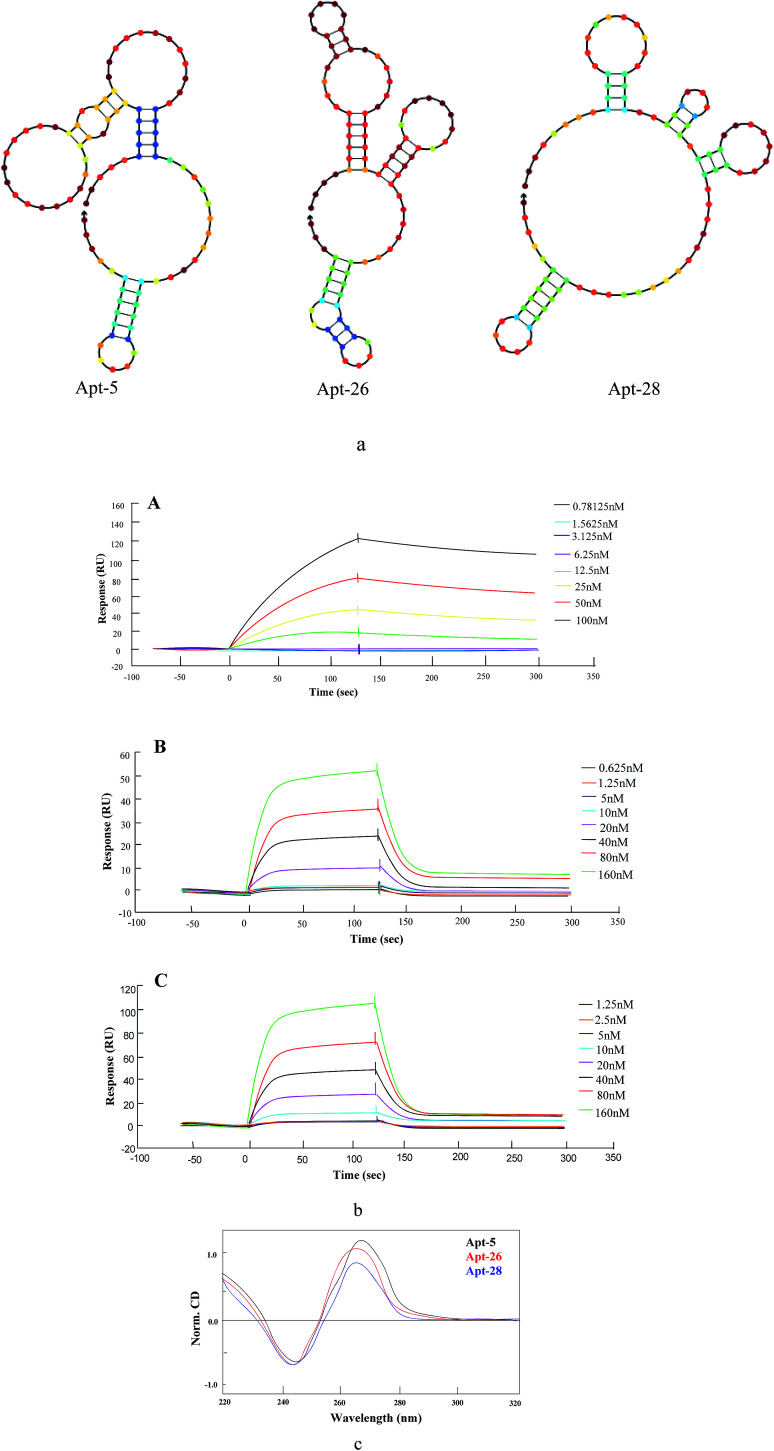
The secondary structures of three aptamers were predicted using an NUPACK software, which is based on a free energy minimization algorithm. These three sequences contained a relatively high guanine content. The three aptamers were of identical length with diverse base sequences, folded into distinct secondary structures (Fig. 2a). A stem-loop structure appeared as common among the candidate aptamers. In addition, the primer regions of these sequences were also involved in the stem-loop structure.
Fig. 2. Characterization of aptamers. (a) Structural analysis of the aptamers was performed using NUPACK to predict the secondary structures. (b) Binding affinity determination for (A) Apt-5 (B) Apt-26 (C) Apt-28 (c) CD spectra of three aptamers. CD data is obtained with a 5 μM concentration in the presence of in 20 mM Na3PO4, pH 7.4, containing 100 mM KCl.
CD spectra provide reliable information for identifying DNA structures. The CD spectra were measured in the presence of either NaCl or KCl because earlier literature reported that the presence of potassium or sodium ion and appropriate heat-and-cooling procedure would facilitate the correct formation of a stem loop type B-DNA structure.27 As shown in Fig. 2c, the CD spectrum of three aptamers displayed a negative peak at 246 nm and two positive peaks at 220 nm and 265 nm, signifying a stem loop type B-DNA structure.28
Dissociation constant (KD) of candidate aptamers
The SPR analysis was performed to determine the affinity of candidate aptamers (Apt-5, Apt-26 and Apt-28) to NSE. The interaction of various concentrations of aptamers with immobilized NSE (50 μg mL−1) is demonstrated in Fig. 2b. The dissociation constants (KD) of all aptamers were in the low nanomolar range (Table 2), suggesting strong binding to the NSE with Apt-5 showing the lowest KD of 12.26 nM. Moreover, Apt-26 gave the closest KD value to Apt-28, despite having very few bases in common.
Affinity constants of aptamer candidates.
| Apt-5 | Apt-26 | Apt-28 | |
|---|---|---|---|
| K ON (M min)−1 | 16.8 × 10⁴ | 5.6 × 10⁴ | 8.0 × 10⁴ |
| K OFF (min−1) | 2.1 × 10⁻³ | 1.4 × 10⁻³ | 1.7 × 10⁻³ |
| K D (M) | 12.26 × 10⁻⁹ | 24.85 × 10⁻⁹ | 21.18 × 10⁻⁹ |
Identification of the highest binding affinity aptamer by EMSA assay
To further identify specificity of Apt-5 by using electrophoretic mobility shift assay (EMSA) method. EMSA analyses were used to evaluate the binding affinity of the Apt-5 with NSE. The color density of the electrophoretic bands corresponding to the Apt-5 bound NSE increases with increasing concentration of NSE. As shown in Fig. 3 indicated that the Apt-5 had a highly specific affinity to NSE without binding to HSA.
Fig. 3. Identification of binding affinity Apt-5 aptamer by EMSA assay.
Optimization of the assay conditions
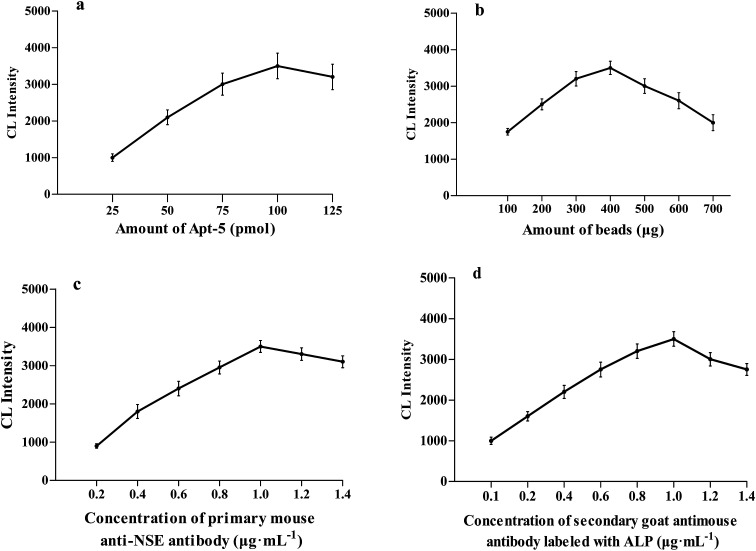
We optimized the following parameters in experiments: (a) concentration of aptamer; (b) the amount of beads; (c) concentration of primary mouse anti-NSE antibody; (d) concentration of secondary goat antimouse antibody labeled with ALP.
The concentration of Apt-5 is a vital parameter for NSE detection. The concentration of Apt-5 was in the range of 25–100 pmol, the CL intensity gradually increased as the amount of aptamer increased. The CL intensity initially increased to reach a maximum at 100 pmol, and then slightly decreased (Fig. 4a). Hence, subsequent work employed 100 pmol of Apt-5.
Fig. 4. Optimization of different conditions for the detection of NSE. (a) The relationship between the amounts of Apt-5 and the CL intensity. (b) The relationship between the concentration of NSE and the CL intensity. (c) The relationship between concentration of primary mouse anti-NSE antibody and CL intensity. (d) The relationship between concentration of secondary goat antimouse antibody labeled with ALP and CL intensity.
A series of experiments with increasing amounts of MBs were conducted. The CL intensity was maintained at an approximately steady level between 300 and 500 μg of MBs (Fig. 4b). As the amount of MBs was increased, the CL intensity decreased gradually, too much beads could result in a poor output signal. Thus subsequent work employed 400 μg MBs.
The dilution of primary mouse anti-NSE antibody and the effect of concentration on the CL intensity was also investigated (Fig. 4c). As the amount of primary mouse anti-NSE antibody increased the CL intensity increased in the range of 0.2–1.0 μg mL−1 and then slightly decreased. Consequently, 1.0 μg mL−1 of primary mouse anti-NSE antibody was selected for subsequent work. In a similar fashion, as the amount of secondary goat antimouse antibody labeled with ALP increased the CL intensity increased in the range of 0.2–1.0 μg mL−1 and then gradually decreased (Fig. 4d). 1.0 μg mL−1 of secondary goat antimouse antibody labeled with ALP was selected for subsequent work.
Detection of pure NSE
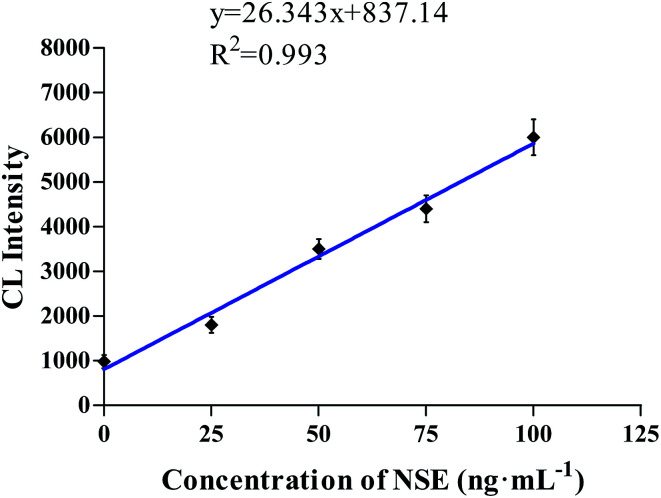
As shown in Fig. 5, the NSE was diluted to prepare for different concentrations, and then the CL intensity was detected using our novelly designed CL aptasensor. When the NSE concentration was in the range of 1–100 ng mL−1, the CL intensity was linear with the concentration (y = 26.343x + 837.14, R2 = 0.993, where y represented the CL intensity, x represented the NSE concentration).
Fig. 5. The linear relationship between the concentration of NSE and the CL intensity in the range of 1–100 ng mL−1.
Selectivity of aptamer to serum samples
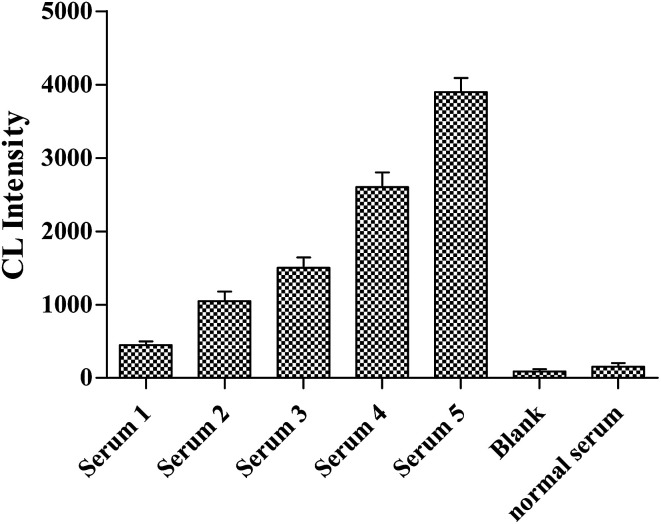
As shown in Fig. 6, five clinical samples of NSE-positive serum were diluted to different concentrations (100, 50, 10, 1 and 0.1 ng mL−1) in order to further confirm the selectivity of Apt-5 aptasensor. The results showed that the detection limit of NSE is 0.1 ng mL−1. All these test results supported the high selectivity of Apt5 sensor.
Fig. 6. NSE concentrations of serum samples 1 to 5 were 0.1, 1, 10, 50, and 100 ng mL−1, respectively.
Identification of the selectivity of Apt-5 to NSE
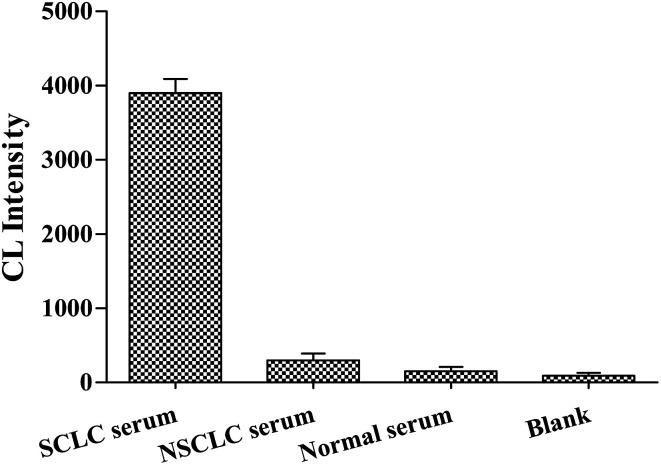
We performed cross-reaction studies in order to verify the specific affinity of Apt-5 sensor for NSE in serum samples. We used equal volumes of SCLC serum and NSCLC serum as controls experiments, respectively. Normal serum as negative control. And ddH2O was used instead of serum as a blank control experiment. The NSE concentration of SCLC serum was 112 ng mL−1 from the ELISA used at the hospital. The results of the cross-reaction study are presented in Fig. 7. It is observed that the normal serum, NSCLC serum chemiluminescence intensity were close to the blank. The Apt-5 was bound to NSE-positive serum, however, a significant increase in CL intensity was observed, indicating that the Apt-5 had high selectivity toward NSE. The aptasensor would work well in complex serum environments. In sum, this aptasensor demonstrated sufficient selectivity for the detection of NSE in serum samples.
Fig. 7. Selectivity of Apt-5 for different serums.
Conclusions
In this work, for the first time, we have isolated a 88-nucleotide DNA aptamer that had the ability to specifically recognize NSE by subtractive SELEX. Enrichment of the ssDNA libraries was assessed by qPCR. SPR test results show that the Apt-5 had the highest binding affinity with the lowest KD value (12.26 nM). Besides, EMSA experiment also indicated that the Apt-5 had a highly specific affinity to NSE without binding to HSA. In addition, based on the secondary structure predictions, these aptamers secondary structures is able to fold into distinct secondary structures. A stem-loop structure appeared as common among the candidate aptamers. In addition, the primer regions of these sequences were also involved in the stem-loop structure. The binding mechanism between the target molecule and aptamer will be further explored in the follow-up work.
A CL aptasensor based on magnetic separation and aptamer was constructed to detect NSE from serum samples. The new Apt-5 sensor had a linear relationship between CL intensity and concentration when the NSE concentration was in the range of 1–100 ng mL−1. The detection limit for NSE was 0.1 ng mL−1, 2.5 times lower than the 0.25 ng mL−1 limit of an ELISA in use at the hospital. However, ELISA is complex to perform and time-consuming. The novel CL aptasensor based on magnetic separation and immunoassay allows rapid separation and sensitive detection of NSE in serum. This aptasensor has the potential for wide clinical application in the diagnosis of SCLC. Further research should be focused on improving detection limits and combined it with this Apt–AuNPs probe, which would then be expected to be a potential and powerful tool in biomonitoring NSE in clinical diagnostics.
Conflicts of interest
The authors declare that they have no conflict of interests.
Supplementary Material
Acknowledgments
We thank the National Natural Science Foundation of China (30960104; 30770639), and the Heibei Key R & D Program (17272402), for their financial support.
Electronic supplementary information (ESI) available. See DOI: 10.1039/c9ra00785g
References
- Mao Q. X. Jiang F. Yin R. Wang J. Xia W. Dong G. Ma W. Yang Y. Xu L. Hu J. Cancer Lett. 2018;36:40–48. doi: 10.1016/j.canlet.2017.11.036. [DOI] [PubMed] [Google Scholar]
- Erren C. E. Glende C. B. Morfeld P. Piekarski C. Int. Arch. Occup. Environ. Health. 2009;82:997–1004. doi: 10.1007/s00420-008-0387-0. [DOI] [PubMed] [Google Scholar]
- Jiang Z. F. Wang M. Xu J. L. Life Sci. 2018;194:1–6. doi: 10.1016/j.lfs.2017.12.020. [DOI] [PubMed] [Google Scholar]
- Bernhard F. Alois P. Daniele C. Resuscitation. 2017;121:166–171. doi: 10.1016/j.resuscitation.2017.09.001. [DOI] [PubMed] [Google Scholar]
- Holdenrieder S. Pawel V. Dankelmann J. Clin. Cancer Res. 2008;14:7813–7821. doi: 10.1158/1078-0432.CCR-08-0678. [DOI] [PubMed] [Google Scholar]
- Takashi H. Okuda K. Yamaoka T. Ishida K. Kusumoto S. Sugiyama T. Shirai T. M. Ohnshi T. Ohmori T. Adachi M. Lung Cancer. 2011;71:224–228. doi: 10.1016/j.lungcan.2010.05.004. [DOI] [PubMed] [Google Scholar]
- Fang S. C. Zhang H. T. Wang C. Y. Clin. Chim. Acta. 2014;433:123–127. doi: 10.1016/j.cca.2014.03.005. [DOI] [PubMed] [Google Scholar]
- Nicole V. T. Noemi V. F. Clin. Chim. Acta. 2013;424:216–221. doi: 10.1016/j.cca.2013.06.009. [DOI] [PubMed] [Google Scholar]
- Xi Z. J. Huang R. R. Deng Y. Su E. B. He N. Y. Sci. Adv. Mater. 2016;8:1678–1682. doi: 10.1166/sam.2016.2447. [DOI] [Google Scholar]
- Wang Q. Y. Kang Y. J. Nanoscale Res. Lett. 2016;11:150–159. doi: 10.1186/s11671-016-1359-z. [DOI] [PMC free article] [PubMed] [Google Scholar]
- Tuerk C. Gold L. Science. 1990;249:505–510. doi: 10.1126/science.2200121. [DOI] [PubMed] [Google Scholar]
- Ellington A. D. Szostak J. W. Nature. 1990;34:818–822. doi: 10.1038/346818a0. [DOI] [PubMed] [Google Scholar]
- Shim W. B. Kim M. J. Mun H. Kim M. G. Biosens. Bioelectron. 2014;62:288–294. doi: 10.1016/j.bios.2014.06.059. [DOI] [PubMed] [Google Scholar]
- Zheng J. Li J. Jiang Y. Anal. Chem. 2011;83:6586–6592. doi: 10.1021/ac201314y. [DOI] [PubMed] [Google Scholar]
- Wang F. Banerjee D. Liu Y. Chen X. Liu X. Analyst. 2010;135:1839–1854. doi: 10.1039/C0AN00144A. [DOI] [PubMed] [Google Scholar]
- Piyasena M. E. Real L. J. Diamond R. A. Xu H. H. Gomez F. A. Anal. Bioanal. Chem. 2008;392:877–886. doi: 10.1007/s00216-008-2327-y. [DOI] [PMC free article] [PubMed] [Google Scholar]
- Karpik A. E. Crulhas B. P. Rodrigues C. B. Castro G. R. Pedrosa V. A. Electroanalysis. 2017;29:2246–2253. doi: 10.1002/elan.201700318. [DOI] [Google Scholar]
- Fang B. Y. Wang C. Y. Li C. Wang H. B. Zhao Y. D. Sens. Actuators, B. 2017;244:928–933. doi: 10.1016/j.snb.2017.01.045. [DOI] [Google Scholar]
- Liu M. Wang Z. F. Tan T. Chen Z. S. Mou X. B. Yu X. C. Deng Y. Lu G. M. He N. Y. Theranostics. 2018;20:5772–5783. doi: 10.7150/thno.28949. [DOI] [PMC free article] [PubMed] [Google Scholar]
- Grunnet M. Sorensen J. B. Lung Cancer. 2012;76:138–143. doi: 10.1016/j.lungcan.2011.11.012. [DOI] [PubMed] [Google Scholar]
- Huang Z. X. Xie Q. Guo Q. P. Wang K. M. Chen Y. Y. Chin. Chem. Lett. 2017;28:1252–1257. doi: 10.1016/j.cclet.2017.01.002. [DOI] [Google Scholar]
- Grunnet M. Sorensen J. B. Anal. Chem. 2012;84:2647–2653. doi: 10.1021/ac202559w. [DOI] [PubMed] [Google Scholar]
- Bailor M. H. Sun X. Hashimi H. M. J. Mol. Endocrinol. 2002;29:23–39. [Google Scholar]
- Hamid S. Raheleh H. Jafar A. J. Biotechnol. 2018;9:245–253. [Google Scholar]
- Zhou Y. Li W. S. Tseng Y. J. Talanta. 2018;39:326–332. [Google Scholar]
- Xi Z. J. Huang R. R. Li Z. Y. ACS Appl. Mater. Interfaces. 2015;7:11215–11223. doi: 10.1021/acsami.5b01180. [DOI] [PubMed] [Google Scholar]
- Lu T. F. Ma Q. Yan W. Z. Wang Y. Z. Zhang Y. Y. Zhao L. L. Chen H. Y. Talanta. 2018;176:214–220. doi: 10.1016/j.talanta.2017.08.037. [DOI] [PubMed] [Google Scholar]
- Sharma T. K. Bruno J. G. Dhiman A. Biotechnol. Adv. 2017;35:275–301. doi: 10.1016/j.biotechadv.2017.01.003. [DOI] [PubMed] [Google Scholar]
Associated Data
This section collects any data citations, data availability statements, or supplementary materials included in this article.


