Abstract
Metal–organic frameworks (MOFs) have been shown to be promising candidates in the recent decades for the immobilization of guest active species due to their diversified structures, porosity, and high surface area. In this study, silicotungstic acid (HSiW) encapsulated UiO-66 has been successfully synthesized by one-pot synthesis strategy. The synthesized composite (HSiW-UiO-66) was characterized by X-ray diffraction (XRD), Fourier transform infrared spectrometry (FT-IR), nitrogen adsorption–desorption isotherms, scanning electron microscopy (SEM), transmission electron microscopy (TEM), and thermogravimetric (TG) techniques, and the HSiW-UiO-66 was also employed as a solid acidic catalyst for the synthesis of biodiesel by esterification of lauric acid with methanol. The results revealed that the HSiW-UiO-66 composite had better textural properties (such as large BET surface area (758.3 m2 g−1), large pore volume (0.438 cm3 g−1), and smaller particle size (about 50–200 nm)), good thermal stability, and high catalytic activity. In addition, the effect of the esterification process parameters on biodiesel production was analyzed using single factor experimental method combined with response surface methodology (RSM); a high conversion of 80.5% with single factor optimization and 92.8% with RSM was obtained. More importantly, the conversion of lauric acid decreased from 80.5% to just 70.2% when the catalyst had been reused six times, which exhibited that the catalyst had excellent reusability. The high activity of HSiW-UiO-66 benefited from low activation energy of 27.5 kJ mol−1. This work thus offers an underlying application for green biodiesel obtained from free fatty acids esterification or pre-esterification of low-cost oils with high acid value.
Silicotungstic acid (HSiW) encapsulated UiO-66 nanocatalyst have been successfully synthesized by one-pot synthesis strategy and used as a stable and highly efficient catalyst for esterification.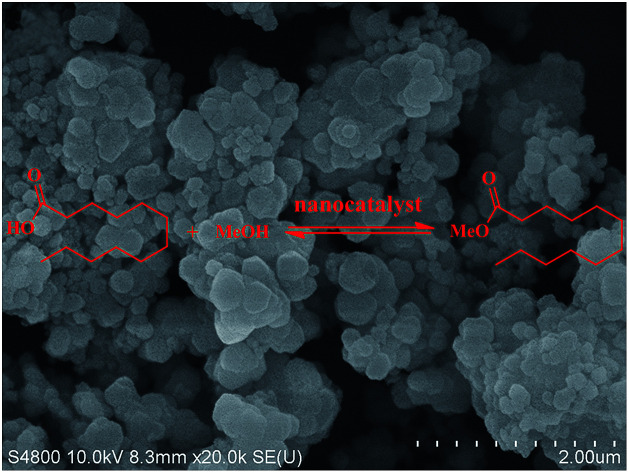
1. Introduction
The increase in industrialization and urbanization energy demands have led to the depletion of the world's oil reserves and intensified environmental degradation. Thus, it is a great challenge for investigators to develop alternative renewable energy to replace petroleum-based fuels.1,2 At present, the conversion of refined edible oils, waste oil, and free fatty acids (FFAs) into biodiesel is receiving more and more attention3 due to the merits of sustainability, lower pollution and greenhouse gas emissions, biodegradability, non-toxicity, and better lubricity in comparison with fossil diesel fuels and it can be applied in any compression-ignition engine without modification.4
Biodiesel can be prepared by transesterification of oils or esterification of FFAs with short chain alcohols catalyzed by an acid or base catalyst. Nevertheless, the cost of the raw materials is the major contributor to biodiesel production.5 In this regard, low-cost oils (such as non-edible oils and restaurant waste oils) are economical raw materials for biodiesel production. However, low-cost oils usually contain abundant FFAs and cannot be used with an alkaline catalyst, which causes significant saponification problems.6 Thus, as they cannot be translated to biodiesel by a one-step conversion process, most researchers focuses on the development of a two-step technique including acid-catalyzed esterification of the FFAs and the following alkali-catalyzed transesterification of triglycerides to biodiesel.7 On the other hand, the two-step methods will increase the cost due to complex operation. Therefore, acidic catalysts are more suitable for the conversion of FFAs and low-cost oils into biodiesel.
Although homogeneous acid catalysts have high catalytic capability for the esterification of FFAs, it has several limitations such as non-reusability, high equipment corrosion, the requirement of separation and purification steps, and environmental problems.8 Other than homogenous acid catalysts, heterogeneous solid acid catalysts afford high activity and stability, ease of separation, low corrosive and eco-friendly process.9 In this paper, various solid acid catalysts have been extensively investigated for the esterification of FFAs with methanol such as metal oxides,10 zeolites,11 and solid superacids.12 Recently, heteropolyacids were widely studied as solid acid catalysts with good to excellent activity for esterification.13–16 However, bulk heteropolyacids have low specific surface area and are soluble in polar organic media that make their recycling difficult. In order to avert these drawbacks, multiple approaches were attempted to modify the heteropolyacids, for instance, embedding them into supports,17 partial or full substitution of the heteropolyacids' H+ with large monovalent ions,18 and grafting on functionalized surfaces.19 Nevertheless, the preparation of stable encapsulated heteropolyacids that do not leach in polar organic media is urgently required. In particular, the reported studies have shown that metal–organic frameworks (MOFs) are able to interact and stabilize the dispersed active species due to controllable composition, a large number of uniformly sized micropores, and large surface area.20–22 Among these MOF materials, the zirconium-based MOF UiO-66 has emerged as an attractive catalyst support for the production of efficient and stable solid catalysts because of the high robustness and chemical stability.23
In this work, silicotungstic acid (HSiW) encapsulated on UiO-66 was prepared, characterized, and investigated for the esterification of lauric acid with methanol. The effects of reaction parameters on the esterification conversion were also investigated by using one variable statistical method and response surface methodology (RSM). Subsequently, the catalyst reusability and kinetic parameters of the reaction were studied.
2. Experimental
2.1. Materials
The following chemicals were procured from Shanghai Aladdin Industrial Inc: zirconium(iv) chloride, terephthalic acid, silicotungstic acid (HSiW, H4SiW12O40·nH2O), lauric acid (98%), oleic acid, methanol (>99%), stearic acid (98%), myristic acid (98%), and palmitic acid (98%). All chemicals were of analytical grade and used without further purification, unless otherwise noted.
2.2. Materials' preparation and characterization
Silicotungstic acid encapsulated metal–organic framework (UiO-66) was prepared by a previously reported one-pot hydrothermal method with slight modifications.24 Zirconium(iv) chloride (0.51 g) and silicotungstic acid (0.5 g) were initially mixed into 18 mL N,N-dimethylformamide (DMF) at room temperature with stirring, followed by the addition of terephthalic acid (0.3275 g). After stirring at room temperature for 3 h, the substrate mixture was transferred into a Teflon-lined stainless steel autoclave for hydrothermal treatment at 393 K for 6 h, followed by cooling to the ambient temperature. Then, the formed precipitate was obtained by centrifugation, washing several times with DMF and ethanol to remove the un-reacted moieties, and drying at 80 °C for 24 h (denoted as HSiW-UiO-66). For comparison, the blank sample without silicotungstic acid was also synthesized under the same conditions and is denoted as UiO-66. The obtained UiO-66 and HSiW-UiO-66 catalyst were dried at 120 °C before use in the catalytic esterification reaction.
X-ray diffraction (XRD) spectra were obtained using a D8 ADVANCE spectrometer (Germany) using CuKĮ (1.5406 Å) radiation. The FT-IR spectra were obtained on a PerkinElmer Spectrum 100 using the KBr disc technique (4000–400 cm−1). Nitrogen physisorption measurements were performed using a Quantachrome Quadrasorb EVO apparatus (Quantachrome Instruments, Boynton Beach, USA) and the specific surface area was calculated by the Brunauer–Emmett–Teller (BET) algorithm, whereas the pore size and pore volume distributions were calculated using the Barrett–Joyner–Halenda (BJH) method. Thermogravimetric analysis (TGA) was performed on a NETZSCH/STA 409 PC Luxx simultaneous thermal analyzer with a heating rate of 5°C min−1 under an air flow rate of 20 mL min−1. Scanning electron microscopic (SEM) images were obtained using a Hitachi S4800 scanning electron microscope. The microscopic features were obtained by TEM on a FEI Tecnai G2 20 with an accelerating voltage of 200 kV.
2.3. The esterification test
The catalytic activity of the HSiW-UiO-66 catalyst was evaluated through the catalytic esterification of lauric acid with methanol for the preparation of biodiesel (Scheme 1). In a typical run, lauric acid, methanol, and the catalyst (w/w of lauric acid) were loaded into a stainless-steel high-pressure autoclave reactor and reacted at 160 °C under autogenous pressure. When the designated time had elapsed, the reactor was cooled to room temperature, and the catalyst was separated from the reaction mixture by centrifugation. Then, the substrate was purified under reduced pressure distillation to remove water and excess methanol. The acid values (AV, mg KOH g−1) of lauric acid and the products were determined according to the ISO 660-2009 standard and the conversion of lauric acid could be determined based on the following formula: where AV1 is the acid value before the reaction and AV2 is the acid value after the reaction.
Scheme 1. Esterification of lauric acid with methanol over nano-solid acid.
3. Results and discussion
3.1. Catalysts' characterization
3.1.1. The XRD spectra of the catalysts
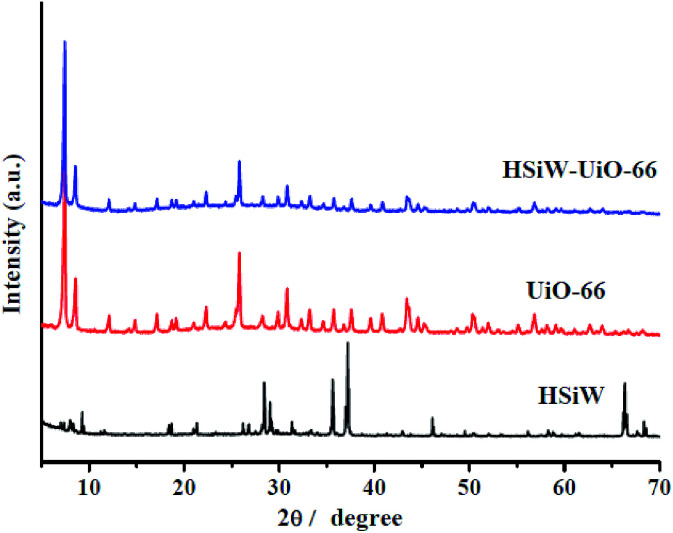
X-ray diffraction (XRD) patterns of pristine HSiW, UiO-66, and HSiW-UiO-66 are shown in Fig. 1. UiO-66 shows peaks at 2θ = 7.2°, 8.5°, 12.1°, 14.7°, 17.2°, 22.3°, 25.7°, 30.8°, and 33.3° correspond to the (111), (002), (022), (113), (004), (115), (224), (046), and (137) planes and its XRD pattern UiO-66 is in accordance with the published literature.25 XRD patterns of UiO-66 and HSiW-UiO-66 do not show any differences except that the intensity of peaks is weakened with the entry of pristine HSiW inside the cage. The crystallinity reduction of HSiW-UiO-66 indicates proper encapsulation of HSiW into the UiO-66 material, which is in good agreement with the previous results.26 Moreover, the XRD pattern of HSiW cannot be obtained from the XRD pattern of the HSiW-UiO-66 sample, implying the uniform distribution of HSiW. Based on this analysis, these XRD results suggest that the HSiW clusters are mainly incorporated into the UiO-66 cavities.
Fig. 1. XRD spectra of HSiW, UiO-66, and HSiW-UiO-66.
3.1.2. The FT-IR spectra of the catalysts
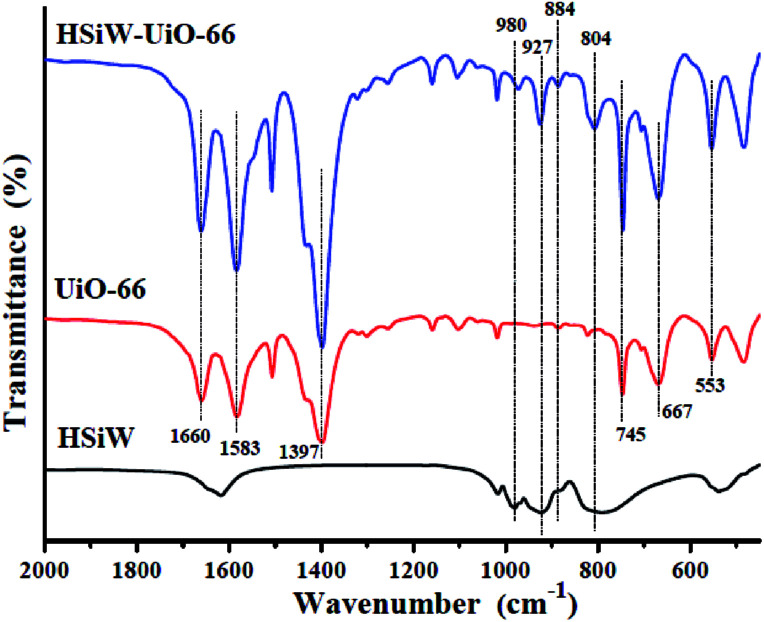
Fig. 2 shows the FT-IR spectra of pristine HSiW, UiO-66, and HSiW-UiO-66. For pristine HSiW, the peaks at 980, 927, 884, and 804 cm−1 represent the particular antisymmetric stretching vibrations of W O, Si–O, W–Oc–W, and W–Oe–W, respectively,27 and it can be detected for the Keggin structures. For UiO-66, the peak at 1660 cm−1 is attributed to the C O stretching vibrations of BDC carboxylic acid, and the peaks at 1583 and 1397 cm−1 are representing the O–C–O asymmetric and symmetric stretching of the BDC ligand, respectively. Meanwhile, the peaks at 745 and 667 cm−1 belong to the O–H and C–H vibrations in the BDC ligand, whereas the band at around 553 cm−1 is assigned to the Zr-(OC) asymmetric stretch, which are in good agreement with the previous results.28 Compared to the pristine HSiW and UiO-66, the FT-IR spectra of the HSiW-UiO-66 composite contains typical infrared peaks belonging to HSiW with the Keggin structures and the FT-IR spectra of the HSiW-UiO-66 composite is similar with the spectra of UiO-66, suggesting that HSiW incorporated the pores in the UiO-66 material. The aforementioned analysis is in accordance with the results drawn from the XRD experiments.
Fig. 2. FT-IR spectra of HSiW, UiO-66, and HSiW-UiO-66.
3.1.3. N2 adsorption–desorption analysis of the catalysts
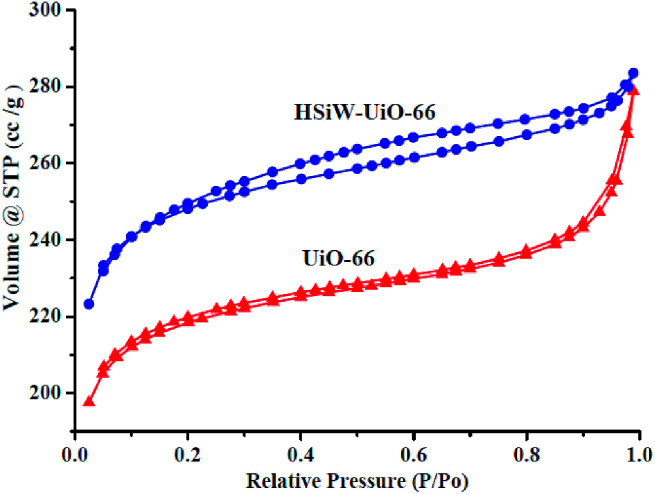
In order to evaluate the porosity of the catalysts, N2 adsorption isotherms were plotted (see Fig. 3), which confirmed that the UiO-66 and HSiW-UiO-66 structures were type I isotherms, indicating the typical predominant microporous feature of the samples; the porosity of UiO-66 was retained after encapsulation of pristine HSiW. Additionally, the specific surface area (BET) of UiO-66 was 667.2 m2 g−1 with 0.431 cm3 g−1 pore volume and the average pore size was mainly distributed at 2.58 nm. After the incorporation of HSiW, the BET surface area was 758.3 m2 g−1 with a pore volume of 0.438 cm3 g−1 and average pore size of 2.3 nm. It is interesting that HSiW-UiO-66 had a higher BET surface area than UiO-66, which is beneficial for good catalytic activity. However, the average pore sizes of HSiW-UiO-66 became smaller than UiO-66 since the pore channel was partly occupied by the incorporated HSiW, which further confirms that HSiW was encapsulated in the porous cages of UiO-66.
Fig. 3. N2 adsorption–desorption isotherms of UiO-66 and HSiW-UiO-66.
3.1.4. SEM analysis of the catalysts
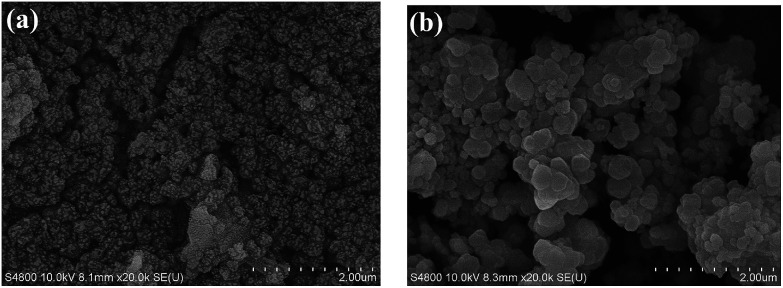
Fig. 4 shows several representative SEM images of UiO-66 and HSiW-UiO-66. As is obvious, the morphology of UiO-66 (Fig. 4a) displays near-spherical shapes for the aggregates of irregular inter-grown crystallites, the particle size of which was nearly 200 nm. As can be seen from Fig. 4b, the incorporation of HSiW gave rise to an octahedral morphology, where the crystals are uniformly distributed and the sizes are about 50–200 nm. Such results suggested the interaction between the guest HSiW molecules and matrix UiO-66, which prevented the aggregation of the UiO-66 crystallites to a certain extent and increased the dispersion. Meanwhile, the incorporation of HSiW into UiO-66 did not affect the morphology of HSiW-UiO-66, which displayed its strong stability.
Fig. 4. SEM images of UiO-66 (a) and HSiW-UiO-66 (b).
3.1.5. TEM analysis of the catalysts
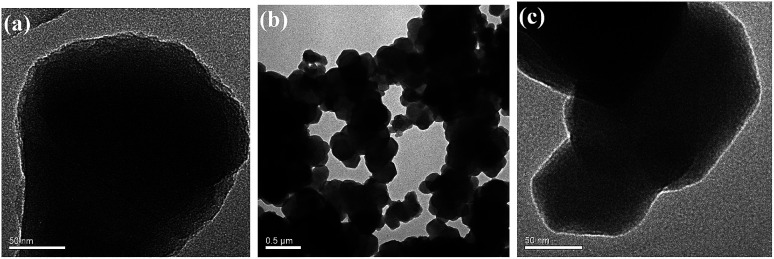
Fig. 5 shows the TEM images of UiO-66 and HSiW-UiO-66. From comparison of the two samples, we can clearly observe that a significant change in the morphological features do not emerge, revealing that UiO-66 has a highly stable structure and the guest HSiW molecules encapsulated in UiO-66 do not alter the structure and morphology of UiO-66. These results are in accordance with the results obtained from XRD and SEM analysis.
Fig. 5. TEM images of UiO-66 (a) and HSiW-UiO-66 (b and c).
3.1.6. Thermogravimetric (TG) analysis of HSiW-UiO-66
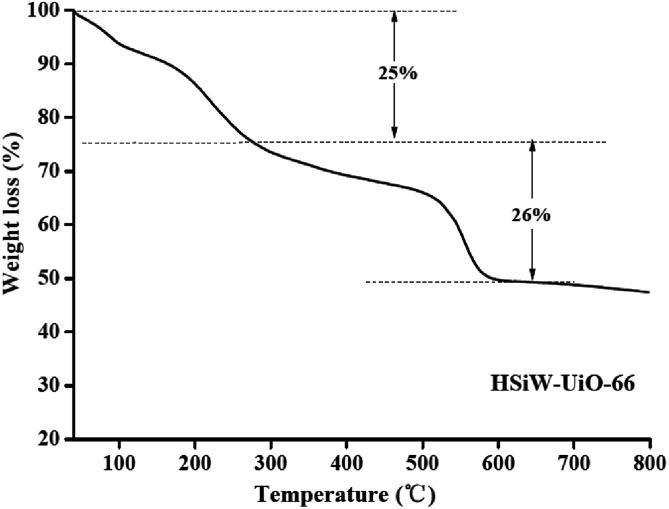
To measure the thermal stability of the catalyst, the HSiW-UiO-66 composite was investigated from 40 °C to 800 °C (Fig. 6), as shown in Fig. 6. At the very beginning, weight loss (about 25%) was observed up to 300 °C due to the loss of physically adsorbed water, guest water and solvent molecules. The weight loss (about 26%) at 300–650 °C is mainly attributed to the release of a portion of the organic ligand, the decomposition of the Keggin structure of HSiW and the framework structure of UiO-66 into simple oxides.29 Accordingly, this figure demonstrates that the HSiW-UiO-66 composite has better thermal stability and thus enables it to be used as a solid acid catalyst for biodiesel production.
Fig. 6. TG curve of HSiW-UiO-66.
3.2. Effect of reaction parameters on the catalytic activity of HSiW-UiO-66 nanocatalyst
The conversion to biodiesel could be affected by the parameters of esterification of lauric acid with methanol. Therefore, the influences of different esterification reaction parameters (i.e., catalyst amount, reaction time, reaction temperature, and molar ratio) on the catalytic performance of the HSiW-UiO-66 nanocatalyst towards the esterification of lauric acid and methanol were explored.
3.2.1. Effect of reaction temperature
The effect of reaction temperature in the esterification of lauric acid is multifaceted. In general, the higher temperature would facilitate the collision probability of molecules and catalysts, and give rise to accelerated reaction rate. Fig. 7a presents the effect of temperature on esterification conversion. From Fig. 7a, it can be clearly seen that ester conversion improves from 51.6% to 80.5% with the rise in temperature from 110 °C up to 160 °C. At the reaction temperatures beyond 160 °C, the lauric acid conversion remained almost constant. As a result, the optimum reaction temperature of 160 °C was chosen for further analysis.
Fig. 7. Methyl laurate conversion affected by various reaction parameters: (a) reaction temperature (molar ratio of 1 : 20, 7 wt% catalyst weight, and 4 h), (b) catalyst weight (molar ratio of 1 : 20, 160 °C, and 4 h), (c) reaction time (molar ratio of 1 : 20, 7 wt% catalyst weight, and 160 °C), and (d) lauric acid to methanol molar ratio (160 °C, 7 wt% catalyst weight, and 4 h).
3.2.2. Effect of catalyst amount
In general, the higher the catalyst amount employed, the more are the catalytic active sites available.30 The effect of catalyst amount ranging from 0 wt% to 11 wt% was investigated on lauric acid conversion by the HSiW-UiO-66 nanocatalyst with other operating conditions fixed, as depicted in Fig. 7b. Without the catalyst, the lauric acid conversion was lower (17.6%). The conversion increased as the catalyst amount increased, as could be seen that the lauric acid conversion was found to increase from 47.4% to 80.5% when the catalyst amount increased from 1 wt% to 7 wt%. However, further increase in the catalyst amount led to the reduction of the esterification conversion due to the increasing viscosity of the reaction mixture, which led to poor diffusion of the reactants and decrease in the biodiesel conversion.31 Thus, the appropriate catalyst amount was 7 wt% for the reaction.
3.2.3. Effect of reaction time
The reaction time needed for the completion of esterification relies on the extent of proper contact among the reactant molecules.32 Therefore, the effect of reaction time on the conversion of lauric acid is shown in Fig. 7c. From Fig. 7c, it can be found that the conversion of methyl laurate at the beginning was low and then increased steadily in the time range between 1 h and 4 h. The conversion of 81.0% is obtained after 5 h and then, as the reaction time is prolonged, the esterification reaction is basically constant. Therefore, 4 h was selected as the appropriate reaction time for the process.
3.2.4. Effect of lauric acid to methanol molar ratio
Lauric acid to methanol molar ratio is one of the important parameters that has a considerable effect on the conversion as well as on the production cost. In general, the molar ratio of methanol and lauric acid is 1 : 1 and the esterification reaction is a reversible process. In order to keep the equilibrium on the right side of the reaction, a slightly more amount of methanol is required. Fig. 7d graphically shows the relationship between lauric acid to methanol in a certain range (1 : 5, 1 : 10, 1 : 15, 1 : 20, 1 : 25, 1 : 30) and the esterification conversion. The best methyl laurate conversion of 80.5% was obtained with the optimal lauric acid to methanol ratio of 1 : 20, whereas the conversion decreased beyond the lauric acid to methanol ratio of 1 : 20 probably because of lower interactions between the reactants and the catalyst, and the dilution of lauric acid and the catalyst in the mixture, an observation that was similarly reported by Nongbe et al.33 Thus, the lauric acid to methanol ratio of 1 : 20 was the optimal ratio for esterification.
3.3. Response surface methodology for optimal conversion
According to the preliminary single factor experiments given above, it is indicated that the reaction temperature, reaction time, and catalyst amount are significant variables for the esterification of lauric acid with methanol. Therefore, a 3-level-3-factor Box–Behnken design of experiments was used to discover the influence of operational factors on the conversion achieved with lauric acid to methanol ratio of 1 : 20. The levels of the variables studied in this work are shown in Table 1S† and the experimental results and the predicted responses based on Box–Behnken design are summarized in Table 2S.† From the RSM results and analysis, a second-order quadratic model relationship between conversion (C) and the various variables in coded units are given in eqn (1) as
| Cconversion = 79.94 + 6.73X1 + 4.30X2 + 3.52X3 − 2.45X1X2 + 1.60X1X3 + 3.15X2X3 − 2.57X12 − 0.32X22 − 1.62 X32 | 1 |
where Cconversion is the lauric acid conversion, X1, X2, and X3 are the coded variables in the esterification process.
The model was statistically analyzed using the software in order to assess the ANOVA and to study the model fit, and the results are presented in Table 1 in terms of sum of squares, degrees of freedom, mean square, as well as F- and p-values. As can be seen in Table 1, the model F-value and p-values of 34.81 and <0.0001, respectively, imply that the model is significant. Apart from that, the ‘Lack of Fit P-value’ of 0.3756 is higher than 0.05, which indicates that Lack of Fit is not significant relative to pure error. Meanwhile, the coefficient of determination (R2) of 0.9781 implies that the model can explain 97.8% of the variability. The R2-predicted of 0.8068 is in good agreement with the R2-adjusted of 0.9500. Under the circumstances, X1, X2, X3, X1X2, X2X3, and X12 are significant model terms, and insignificant terms such as X1X3, X22, and X32 have negative effects on the esterification conversion.
ANOVA of the proposed second-order modela.
| Source | Sum of squares | df | Mean square | F value | Probability (P) > F | |
|---|---|---|---|---|---|---|
| Model | 725.18 | 9 | 80.58 | 34.81 | <0.0001 | Significant |
| X 1 | 361.81 | 1 | 361.81 | 156.32 | <0.0001 | |
| X 2 | 147.92 | 1 | 147.92 | 63.91 | <0.0001 | |
| X 3 | 99.40 | 1 | 99.40 | 42.95 | 0.0003 | |
| X 1 X 2 | 24.01 | 1 | 24.01 | 10.37 | 0.0146 | |
| X 1 X 3 | 10.24 | 1 | 10.24 | 4.42 | 0.0735 | |
| X 2 X 3 | 39.69 | 1 | 39.69 | 17.15 | 0.0043 | |
| X 1 2 | 27.81 | 1 | 27.81 | 12.02 | 0.0105 | |
| X 2 2 | 0.43 | 1 | 0.43 | 0.19 | 0.6790 | |
| X 3 2 | 11.05 | 1 | 11.05 | 4.77 | 0.0652 | |
| Residual | 16.20 | 7 | 2.31 | |||
| Lack of fit | 8.17 | 3 | 2.72 | 1.36 | 0.3756 | Not significant |
| Pure error | 8.03 | 4 | 2.01 | |||
| Cor total | 741.38 | 16 |
R 2 pred = 0.8086, R2 adj = 0.9500, R2 = 0.9781.
The three-dimensional response surfaces of lauric acid conversion towards the independent variables are presented in Fig. 1S.† The experimental results were optimized and found to be as follows: reaction time 5 h, 170 °C reaction temperature, and 11 wt% of catalyst amount. The maximum conversion of lauric acid achieved under these optimum conditions was 92.28%. Under these optimum conditions, the experiments were conducted in parallel triplicate and the average conversion of lauric acid that could be achieved was 92.8%, which was in accordance with the predicted value. From these results, it can be concluded that the quadratic model was fair and the regression equation effectively reflected the effect of various variables on esterification conversion.
3.4. Lauric acid esterification reaction kinetics over HSiW-UiO-66 nanocatalyst
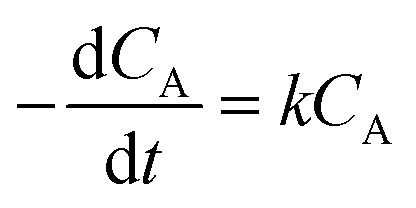
For the kinetic studies, independent experiments were carried out under the optimized conditions for lauric acid conversion: the lauric acid/methanol molar ratio of 1 : 20, 7 wt% catalyst amount, and the reaction temperature was varied in each experiment (160, 150, and 140 °C). During each experiment, the results were collected at different reaction times (from 0.5 to 5 h), as given in Fig. 2S.† The obtained maximum variation in the conversion of methyl laurate was different at different temperatures and thus, the kinetic studies were performed for different temperatures. In each of the experiments, due to methanol being taken in large excess, the reaction rate was considered to follow first-order kinetics and is consistent with previous literature reports.34–36 The reaction rate (r) according to the following equation is:
 |
2 |
where k represents the modified rate constant and CA represents the concentration of lauric acid. CA is defined as:
| CA = CA0 (1 − X) | 3 |
where X and CA0 are the conversion of used lauric acid and the initial concentration of lauric acid, respectively. Thus, eqn (3) can be changed to eqn (4).
| −ln(1 − X) = kt | 4 |
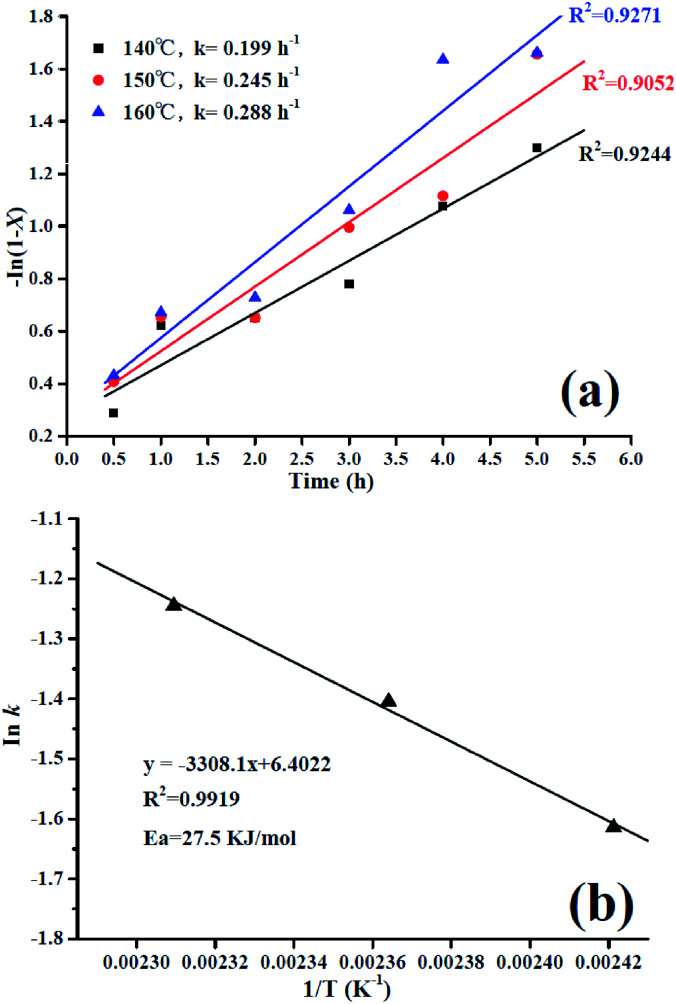
Fig. 8a shows a linear relationship of the first-order for −ln (1 − X) versus t. The reaction rate constants (k) at different reaction temperatures were obtained by linear regression and the k is found to be increasing with increasing reaction temperature with a good straight-line fit. It can be clearly seen that elevating the temperature promotes the esterification process due to enhanced mass transfer effect. Moreover, the activation energy for the lauric acid esterification reaction was evaluated graphically from the plot of ln k versus 1/T (see Fig. 8b) and using the Arrhenius equation given as follows.
| ln k = −Ea/RT + ln A | 5 |
Fig. 8. (a) Linear relationship between –ln(1 − X) and time at different reaction temperatures for esterification in the presence of the HSiW-UiO-66 nanocatalyst (b) the linear Arrhenius plot for ln k versus 1/T for esterification in the presence of the HSiW-UiO-66 nanocatalyst.
From Fig. 8b, the observed activation energy (Ea) was 27.5 kJ mol−1, and the Ea in our work is much lower. Meanwhile, it has been reported that the activation energy for diffusion-limited reactions is relatively low (10–15 kJ mol−1) and reactions controlled by a truly chemical step usually show Ea higher than 25 kJ mol−1.37,38 Hence, in the present study, the esterification reaction is kinetically controlled by a chemical step owing to the high activation energy.
3.5. Reusability of catalyst
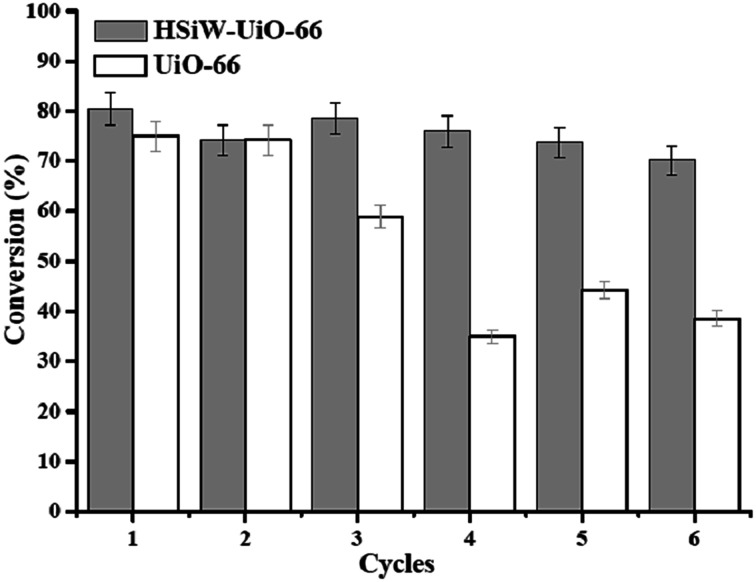
The catalyst reusability test is of great importance as it indicates the advantage of using a catalyst to reduce the preparation cost for its application in industrial production. Therefore, the reusability of blank UiO-66 and HSiW-UiO-66 nanocatalyst was investigated in the esterification of lauric acid with methanol under optimum reaction conditions (catalyst amount 7 wt%, molar ratio of lauric acid to methanol 1 : 20, reaction temperature 160 °C, and reaction time 4 h). After each run, the catalyst was separated by centrifugation, washed with methanol, and directly used for the next run. The experimental results are shown in Fig. 9. After six successive runs, the lauric acid conversion decreased from 80.5% to 70.2% with the HSiW-UiO-66 nanocatalyst and the conversion decreased from 75.0% to 38.6% with the blank UiO-66, suggesting that the HSiW-UiO-66 nanocatalyst was efficient and reusable for biodiesel production. This result may be due to the HSiW-UiO-66 nanocatalyst having a relatively strong interaction between the HSiW and UiO-66 material after the encapsulation of HSiW, resulting in a synergistic effect, similar to the previous literature results.39,40 It could be also concluded that the incorporation of HSiW into the UiO-66 cavities improved the conversion of lauric acid with methanol and the stability of the HSiW-UiO-66 nanocatalyst. However, the small loss in the reusability of the HSiW-UiO-66 nanocatalyst is probably due to the leaching of the active sites of the catalyst in the reaction mixture. The FT-IR spectrum of the recovered HSiW-UiO-66 (Fig. 3S†) was similar to that of the fresh catalyst, suggesting the structure and composition of HSiW encapsulated UiO-66 was mostly maintained. Based on the above analysis, the as-obtained HSiW-UiO-66 nanocatalyst exhibits great stability during the esterification reaction.
Fig. 9. Reusability study of HSiW-UiO-66 and UiO-66 catalysts in esterification.
3.6. Comparison of different catalysts for esterification
The catalytic activities of various solid acid catalysts in esterification were compared and the observed results are shown in Table 2. From Table 2, it can be seen that HSiW-UiO-66 exhibits higher catalytic activity with 92.7% conversion under mild reaction conditions, whereas the other catalysts show low conversion (40%) or require higher temperature (≥200 °C) to obtain similar conversion. According to the explanation given above, the HSiW-UiO-66 nanocatalyst has appropriate catalytic properties, attributed to the high surface areas, strong acidity, and better thermal stability. Therefore, it can be used as a promising solid acid catalyst for biodiesel production.
Comparison of performance of several catalysts with the present work for esterification.
| Catalysts | Reaction conditions | Activity | Ref. | |||
|---|---|---|---|---|---|---|
| Temperature (°C) | FFAs : MeOH molar ratio | Amount of catalyst | Time (h) | |||
| H3PW12O40/K10 | 165 | 1 : 8 | 5 wt% | 5 | ≈100% | 34 |
| WO3/USY | 200 | 1 : 6 | 10 wt% | 2 | 74% | 41 |
| Niobic acid | 249 | 1 : 10.83 | 0.7 g | — | 90% | 42 |
| HPW@MIL-100 | 111 | 1 : 11 | 15 wt% | 5 | 40% | 43 |
| [BMIm][CH3SO3] | 140 | 1 : 2 | 4 wt% | 5 | 93% | 44 |
| HSiW-UiO-66 | 160 | 1 : 20 | 7 wt% | 4 | 80.5% | This work |
| HSiW-UiO-66 | 170 | 1 : 20 | 11 wt% | 5 | 92.8% | This work |
4. Conclusions
In conclusion, silicotungstic acid was successfully incorporated into UiO-66 through a one-pot hydrothermal synthesis. The HSiW-UiO-66 nanocatalyst exhibited excellent textural properties and good thermal stability. Meanwhile, the optimum catalytic performance in the conversion of lauric acid with methanol to produce biodiesel was achieved by the HSiW-UiO-66 nanocatalyst, using which the conversion can reach up to 80.5% with single factor optimization and 92.8% with RSM. Moreover, there existed no remarkable reduction in the catalytic performance even after six runs. The reaction mechanism followed pseudo-first-order kinetic model and the result show that the activation energy was 27.5 kJ mol−1. Thus, the HSiW-UiO-66 nanocatalyst presented here has great potential to be a stable and highly efficient solid acid catalyst for biodiesel production and may have broader applications in other acid-catalyzed reaction systems.
Conflicts of interest
There are no conflicts to declare.
Supplementary Material
Acknowledgments
This work was financially supported by the Technical Talent Support Program of Guizhou Education Department (No. KY [2018]069), the Joint Science and Technology Funds of Guizhou S&T Department, Anshun City People's Government and Anshun university (No. LH [2016]7278), the Creative Research Groups support program of Guizhou Education Department (No. KY [2017]049), Construction Projects of Innovation Platform from Science and Technology Bureau in Anshun (No. [2016]-4), Guizhou Science & Technology Foundation (No. [2019]1009), the Youth Growth Science & Technology Personnel Foundation of Guizhou Education Department (No. KY [2018] 292).
Electronic supplementary information (ESI) available. See DOI: 10.1039/c9ra03209f
Notes and references
- Lee A. F. Bennett J. A. Manayil J. C. Wilson K. Chem. Soc. Rev. 2014;43:7887–7916. doi: 10.1039/C4CS00189C. [DOI] [PubMed] [Google Scholar]
- Tan S. X. Lim S. Ong H. C. Pang Y. L. Fuel. 2019;235:886–907. doi: 10.1016/j.fuel.2018.08.021. [DOI] [Google Scholar]
- Ambat I. Srivastava V. Sillanpää M. Renewable Sustainable Energy Rev. 2018;90:356–369. doi: 10.1016/j.rser.2018.03.069. [DOI] [Google Scholar]
- Muhammad F. Anita R. Duvvuri S. J. Clean. Prod. 2013;59:131–140. doi: 10.1016/j.jclepro.2013.06.015. [DOI] [Google Scholar]
- Zhang Q. Y. Liu X. F. Yang T. T. Yue C. Y. Pu Q. L. Zhang Y. T. RSC Adv. 2019;9:8113–8120. doi: 10.1039/C8RA10574J. [DOI] [PMC free article] [PubMed] [Google Scholar]
- Jaggernauth-Ali P. John E. Bridgemohan P. Fuel. 2015;158:372–378. doi: 10.1016/j.fuel.2015.05.022. [DOI] [Google Scholar]
- Mazumdar P. Dasari S. R. Borugadda V. B. Srivasatava G. Sahoo L. Goud V. V. Biomass Convers. Biorefin. 2013;3:361–369. doi: 10.1007/s13399-013-0077-3. [DOI] [Google Scholar]
- Zhang Q. Y. Wei F. F. Ma P. H. Zhang Y. T. Wei F. H. Chen H. L. Waste Biomass Valorization. 2018;9:911–918. doi: 10.1007/s12649-017-9865-5. [DOI] [Google Scholar]
- Pirez C. Lee A. F. Manayil J. C. Parlett C. M. A. Green Chem. 2014;16:4506–4509. doi: 10.1039/C4GC01139B. [DOI] [Google Scholar]
- Zhang Q. Y. Li H. Yang S. J. Oleo Sci. 2018;67:579–588. doi: 10.5650/jos.ess17231. [DOI] [PubMed] [Google Scholar]
- Chung K. H. Park B. G. J. Ind. Eng. Chem. 2009;15:388–392. doi: 10.1016/j.jiec.2008.11.012. [DOI] [Google Scholar]
- Huang C. C. Yang C. J. Gao P. J. Wang N. C. Chen C. L. Chang J. S. Green Chem. 2015;17:3609–3620. doi: 10.1039/C5GC00188A. [DOI] [Google Scholar]
- Chen Y. Zhang X. L. Dong M. M. Wu Y. H. Zheng G. P. Huang J. Guan X. X. Zheng X. C. J. Taiwan Inst. Chem. Eng. 2016;61:147–155. doi: 10.1016/j.jtice.2015.12.005. [DOI] [Google Scholar]
- Zhang Q. Y. Wei F. F. Li Q. Huang J. S. Feng Y. M. Zhang Y. T. RSC Adv. 2017;7:51090–51095. doi: 10.1039/C7RA10554A. [DOI] [Google Scholar]
- Ramli N. A. S. Sivasubramaniam D. Amin N. A. S. BioEnergy Res. 2017;10:1105–1116. doi: 10.1007/s12155-017-9872-1. [DOI] [Google Scholar]
- Zhang Q. Y. Yue C. Y. Pu Q. L. Yang T. T. Wu Z. F. Zhang Y. T. ACS Omega. 2019;4:9041–9048. doi: 10.1021/acsomega.9b01037. [DOI] [PMC free article] [PubMed] [Google Scholar]
- Gawade A. B. Tiwari M. S. Yadav G. D. ACS Sustainable Chem. Eng. 2016;4:4113–4123. doi: 10.1021/acssuschemeng.6b00426. [DOI] [Google Scholar]
- Cai J. Zhang Q. Y. Wei F. F. Huang J. S. Feng Y. M. Ma H. T. Zhang Y. T. J. Oleo Sci. 2018;67:427–432. doi: 10.5650/jos.ess17208. [DOI] [PubMed] [Google Scholar]
- Hanada Y. Kamada M. Umemoto K. Kominami H. Kera Y. Catal. Lett. 1996;37:229–233. doi: 10.1007/BF00807759. [DOI] [Google Scholar]
- Fujie K. Yamada T. Ikeda R. Kitagawa H. Angew. Chem., Int. Ed. 2015;126:11484–11487. doi: 10.1002/ange.201406011. [DOI] [Google Scholar]
- Diercks C. S. Liu Y. Cordova K. E. Yaghi O. M. Nat. Mater. 2018;17:301–307. doi: 10.1038/s41563-018-0033-5. [DOI] [PubMed] [Google Scholar]
- Jrad A. Abu Tarboush B. J. Hmadeh M. Ahmad M. Appl. Catal., A. 2019;570:31–41. doi: 10.1016/j.apcata.2018.11.003. [DOI] [Google Scholar]
- Cao Y. Zhao Y. X. Lv Z. J. Song F. J. Zhong Q. J. Ind. Eng. Chem. 2015;27:102–107. doi: 10.1016/j.jiec.2014.12.021. [DOI] [Google Scholar]
- Wee L. H. Bajpe S. R. Janssens N. Hermans I. Houthoofd K. Kirschhock C. E. A. Martens J. A. Chem. Commun. 2009;46:8186–8188. doi: 10.1039/C0CC01447H. [DOI] [PubMed] [Google Scholar]
- Kandiah M. Nilsen M. H. Usseglio S. Jakobsen S. Olsbye U. Tilset M. Larabi C. Quadrelli E. A. Bonino F. Lillerud K. P. Chem. Mater. 2010;22:6632–6640. doi: 10.1021/cm102601v. [DOI] [Google Scholar]
- Ferey G. Mellot-Draznieks C. Serre C. Millange F. Dutour J. Surble S. Margiolaki I. Science. 2005;309:2040–2042. doi: 10.1126/science.1116275. [DOI] [PubMed] [Google Scholar]
- Parida K. M. Mallick S. J. Mol. Catal. A: Chem. 2007;275:77–83. doi: 10.1016/j.molcata.2007.05.022. [DOI] [Google Scholar]
- Tang J. Dong W. J. Wang G. Yao Y. Z. Cai L. M. Liu Y. Zhao X. Xu J. Q. Tan L. RSC Adv. 2014;4:42977–42982. doi: 10.1039/C4RA07133F. [DOI] [Google Scholar]
- Yang X. L. Qiao L. M. Dai W. L. Microporous Mesoporous Mater. 2015;211:73–81. doi: 10.1016/j.micromeso.2015.02.035. [DOI] [Google Scholar]
- Alhassan F. H. Rashid U. Yunus R. Sirat K. Lokman I. M. Taufiq-Yap Y. H. Int. J. Green Energy. 2015;12:987–994. doi: 10.1080/15435075.2014.880843. [DOI] [Google Scholar]
- Lee S. L. Wong Y. C. Tan Y. P. Yew S. Y. Energy Convers. Manage. 2015;93:282–288. doi: 10.1016/j.enconman.2014.12.067. [DOI] [Google Scholar]
- Sahani S. Banerjee S. Sharma Y. C. J. Taiwan Inst. Chem. Eng. 2018;86:42–56. doi: 10.1016/j.jtice.2018.01.029. [DOI] [Google Scholar]
- Nongbe M. C. Ekou T. Ekou L. Yao K. B. Grognec E. L. Felpin F. X. Renewable Energy. 2017;106:135–141. doi: 10.1016/j.renene.2017.01.024. [DOI] [Google Scholar]
- Nandiwale K. Y. Bokade V. V. Ind. Eng. Chem. Res. 2014;53:18690–18698. doi: 10.1021/ie500672v. [DOI] [Google Scholar]
- Kaur N. Ali A. Renewable Energy. 2015;81:421–431. doi: 10.1016/j.renene.2015.03.051. [DOI] [Google Scholar]
- Shalini S. Chandra S. Y. Energy Convers. Manage. 2018;171:969–983. doi: 10.1016/j.enconman.2018.06.059. [DOI] [Google Scholar]
- Brahmkhatri V. Patel A. Appl. Catal., A. 2011;403:161–172. doi: 10.1016/j.apcata.2011.06.027. [DOI] [Google Scholar]
- Patel A. Brahmkhatri V. Fuel Process. Technol. 2013;113:141–149. doi: 10.1016/j.fuproc.2013.03.022. [DOI] [Google Scholar]
- Yu D. D. Gao W. X. Xing S. Y. Lian L. L. Zhang H. Wang X. Y. Lou D. W. RSC Adv. 2019;9:4884–4891. doi: 10.1039/C8RA10388G. [DOI] [PMC free article] [PubMed] [Google Scholar]
- Zhang M. Shang Q. G. Wan Y. Q. Cheng Q. R. Liao G. Y. Pan Z. Q. Appl. Catal., B. 2019;241:149–158. doi: 10.1016/j.apcatb.2018.09.036. [DOI] [Google Scholar]
- Costa A. A. Braga P. R. S. de Macedo J. L. Dias J. A. Dias S. C. L. Microporous Mesoporous Mater. 2012;147:142–148. doi: 10.1016/j.micromeso.2011.06.008. [DOI] [Google Scholar]
- Rade L. L. Letícia L. Lemos C. O. T. Barrozo M. A. S. Ribas R. M. Monteiro R. S. Hori C. E. Renewable Energy. 2018;115:208–216. doi: 10.1016/j.renene.2017.08.035. [DOI] [Google Scholar]
- Liu F. J. Li W. Sun Q. Zhu L. F. Meng X. J. Guo Y. H. Xiao F. S. ChemSusChem. 2011;4:1059–1062. doi: 10.1002/cssc.201100166. [DOI] [PubMed] [Google Scholar]
- Guo F. Fang Z. Tian X. F. Long Y. D. Jiang L. Q. Bioresour. Technol. 2013;140:447–450. doi: 10.1016/j.biortech.2013.03.095. [DOI] [PubMed] [Google Scholar]
Associated Data
This section collects any data citations, data availability statements, or supplementary materials included in this article.


