Abstract
Exploiting a rapid and sensitive method for biomarker detection has important implications in the early diagnosis of diseases. Here, we synthesized Mn3O4 microspheres which worked as a nanozyme to exhibit outstanding oxidase-like activity for rapid colorimetric determination of glutathione (GSH). The Mn3O4 microspheres of about 800 nm in size could be prepared through a hydrothermal method, and we found that the as-prepared Mn3O4 microspheres could quickly oxidize 3,3′,5,5′-tetramethylbenzidine (TMB) to its oxidized form (TMBox) in the absence of H2O2. After adding glutathione (GSH), TMBox was able to be changed into to its original form and resulted in the corresponding decrease in absorbance value at 652 nm. The Mn3O4-TMB system had good linearity with GSH concatenation in the range of 5–60 μM, and the limit of detection was 0.889 μM. Furthermore, this assay possessed high selectivity specificity, which made it possible to detect GSH in human serum samples. Thus, the obtained assay based on the oxidase mimic of Mn3O4 would enlarge and exploit the application fields of nanozymes in bio-analysis.
The oxidase-like activity of Mn3O4 was used to detect the GSH level directly and rapidly in the absence of H2O2.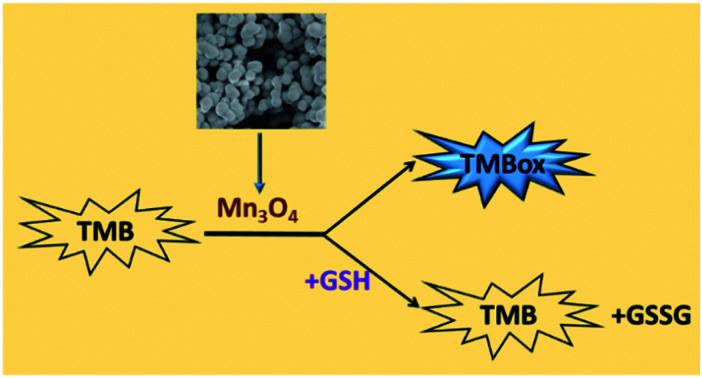
Introduction
Developing a simple and effective sensing assay to detect biomarkers rapidly has attracted word-wide interest in the field of bio-analysis.1,2 Till now, numerous analytical techniques based on colorimetric, fluorescence, electrochemistry and surface enhanced Raman scattering have made great efforts in the detection of different disease biomarkers, including promoting the sensitivity and accuracy, and shortening the time of measurement.3–5 Among these strategies, nanozymes, as catalytic materials with enzyme mimicking activities, show great potential in bio-analysis owing to their tunable catalytic activities.6 Especially, peroxidase-mimicking nanozymes have been widely investigated to design versatile sensing platform biosensors.7,8 For instance, a selective glucose biosensor was constructed by combining peroxidase-like Fe3O4 nanozymes with glucose oxidase.9 This strategy now is generalized to detect other analytes, but this assay is only suitable to the H2O2-producing analytes.10 Taking an example, the colorimetric assay of glucose detection includes two cascade reactions: (1) glucose oxidation in the presence of glucose oxidase, (2) peroxidase-based H2O2 detection. The different optimum reaction conditions for glucose oxidase and nanozymes give rise to two separate steps of reactions rather than one-pot reaction, leading to the complicated analytical processes.11 Moreover, the two cascade reactions usually cause the error transfer, finally reducing the sensitivity and accuracy of detection. Thus, exploiting nanozymes possessing new enzymatic activities, such as oxidase-like activity that does not require unstable H2O2 as a co-substrate, to construct a colorimetric assay based on one-pot reaction will simply the measurement steps, thereby solving the above conundrum.
It is noteworthy that very few nanozymes have oxidase-like activity. The best known examples are Au nanoparticles for glucose oxidation,12,13 and CeO2, V2O5, MnO2 can also oxidize a diverse range of substrates directly.14,15 Oxidases are important since they do not need H2O2 as a co-substrate. Mn3O4 is a versatile nanozyme and reported to have various enzyme-like activities, including catalase,16 superoxide dismutase17 and glutathione peroxidase (GPx).18 It was usually applied for wound healing, in vivo anti-inflammation and cytoprotection. However, the oxidase-like activity of Mn3O4 has not been reported. The catalytic activities of Mn3O4 are attributed to the mixed oxidation states of Mn3+ and Mn2+, and related oxygen vacancies. As CeO2 and V2O5, we speculated that Mn3O4 maybe possessed oxidase-like activity as a promising candidate for developing colorimetric assays.
Herein, we reported a hydrothermal synthesis method to prepare Mn3O4 microspheres, which exhibited outstanding oxidase-like activity to convert colorless TMB rapidly into TMBox (a naked-eye visible chromogenic substrate) in the absence of H2O2. It was found that glutathione (GSH) could selectively suppress the oxidation of TMB, converting blue TMBox to colorless TMB. Based on this phenomenon, the GSH level could be measured by monitoring the decrease of TMBox peak intensity at 652 nm. It is well known that GSH plays a critical role in the biological system as one of the most common intracellular non-protein biothiols.8 Many diseases, such as cancer, liver damage, acquired immunodeficiency syndrome (AIDS), psoriasis, heart problems and leukocyte loss, are closely related to the abnormal level of cellular glutathione.19 Therefore, the accurate detection of GSH in serum is a matter of cardinal significance for disease prevention and diagnosis. Several studies have combined materials, such as carbon quantum dots,20 Ag+21 and MnO2,22 with TMB for colorimetric detection of GSH. We here utilized a one-pot reaction, the oxidase-like activity of Mn3O4, to detect the GSH level in human serum samples directly and rapidly. Unlike previous peroxidase-based biosensors including two cascade reactions, the proposed strategy only needed a one-pot reaction, simplifying the steps of measurement and improving the sensitivity and accuracy.
Experimental
Materials
Manganese formate dehydrate Mn(HCO2)2·2H2O, sodium acetate (NaAc), ethanol (C2H5OH), methanol (CH3OH), acetic acid (HAc), glucose (Glu), sodium chloride (NaCl), potassium chloride (KCl), ascorbic acid (AA), and dopamine (DA) were purchased from Sinopharm Chemical Reagent (Shanghai, China). TMB (3,3′,5,5′-tetramethylbenzidine) was obtained from Sigma-Aldrich (USA). ZnCl2, CaCl2, and MgCl2 were bought from Sangon Biotech (Shanghai, China). l-serine (Ser), glycine (Gly), l-histidine dihydrochloride (His), l-threonine (Thr), tryptophan (Try), l-arginine (Arg), cysteine (Cys) and bovine protein serum (BSA) were acquired from BBI Life Sciences (Shanghai, China). Glutathione (GSH) was purchased from Adamas Reagent (Shanghai, China). IgG was purchased from Solarbio (Beijing, China).
Synthesis of Mn3O4 microspheres
Mn(HCO2)2·2H2O (0.2040 g) was dissolved in methanol (40 mL) with continuous string for 30 min, and then the mixture was transferred to a Teflon autoclave and kept at 180 °C for 12 h. After finishing the reaction, Mn3O4 microspheres were obtained through centrifugation, washing and drying.
Characterization of Mn3O4 microspheres
Scanning electron microscopy (SEM, S-4800II, Hitachi, Tokyo, Japan) was applied to characterize the morphology and structure of Mn3O4 microspheres. The FT-IR spectrum was monitored on a Bruker Tensor 27 FT-IR spectrometer (Germany). The composition and surface chemistry of Mn3O4 microspheres were characterized by X-ray powder diffraction (XRD, D8 Advance, Bruker AXS, Germany) and X-ray photoelectron spectroscopy (XPS, Thermo ESCALAB 250 spectrometer, USA).
Oxidase-like activity of Mn3O4 microspheres and kinetic studies
The major absorbance peaks of TMBox in 0.1 M NaAc-HAc buffer (pH 4.5) appeared at 652 and 370 nm. For the evaluation of oxidase-like activity of Mn3O4 microspheres, chemicals were added into a 1.0 mL NaAc-HAc buffer solution in the order of Mn3O4 (varying amounts) and TMB (final concentration: 0.416 mM). The color change of TMB in the presence of Mn3O4 microspheres was monitored by a UV-vis spectrometer (Hitachi UV2010, Japan). For kinetic parameters, the experiments were carried out in the NaAc-HAc buffer (0.1 M), containing 5.0 μg mL−1 Mn3O4 microspheres and TMB with concentration ranging from 0 to 0.416 mM. The kinetic determination was monitored in a time-scan mode at 652 nm and the Michaelis–Menten constant was obtained through the Lineweaver–Burk plot analyzed by GraphPad.
Colorimetric detection of GSH
The measurement of GSH was performed at room temperature. The final working concentrations of Mn3O4 microspheres and TMB were 10.0 μg mL−1 and 0.416 mM, respectively. After adding different concentrations of GSH in Mn3O4-TMB buffer system, the mixture was incubated for 5 min and then the change of peak intensity (652 nm) was monitored. The calibration curve of GSH was obtained by plotting ΔA at 652 nm as a function of the GSH concentration. Where ΔA = A0 − A, A and A0 corresponded to the absorbance at 652 nm with and without GSH addition, respectively.
Colorimetric assay of GSH in human serum samples was performed as follows. First, the human serum samples from our local hospital (Northern Jiangsu People's Hospital, Jiangsu Province) were centrifuged at 3000 rpm for 10 min. Afterwards, 5.0 μL of serum supernatant, Mn3O4 microspheres (final concentration: 10.0 μg mL−1), and TMB (final concentration: 0.416 mM) were incubated together for 5 min, and then the absorbance at 652 nm was measured.
Statistical analysis
Quantitative data were expressed as the means ± standard deviations.
Results and discussion
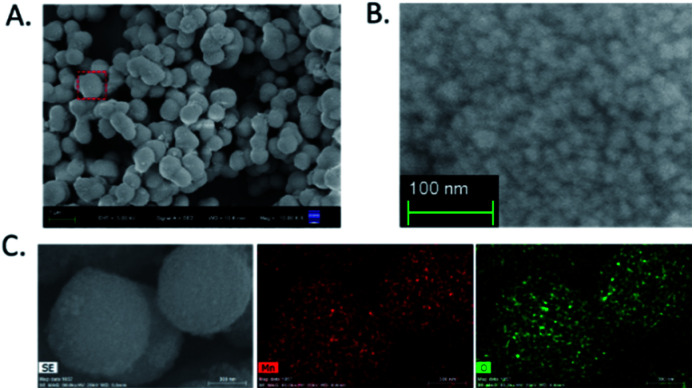
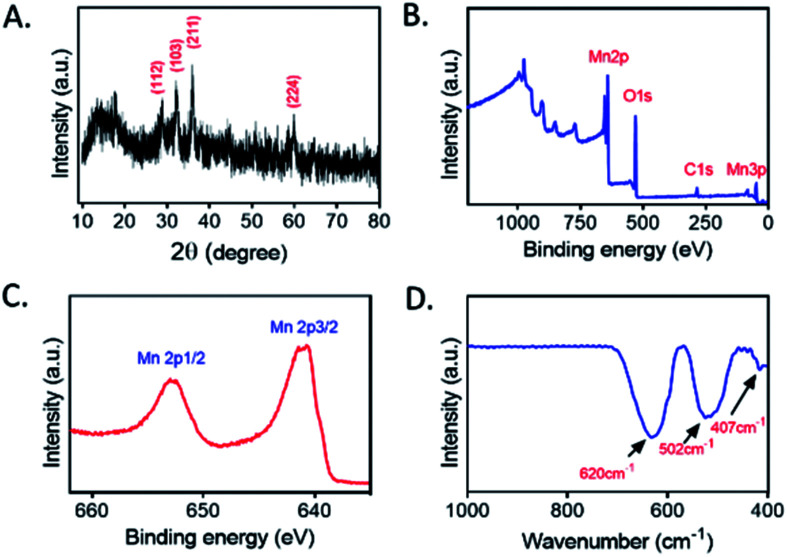
Mn3O4 microspheres were synthesized according to a previously report.20 The morphology, crystalline phase and chemical composition of the obtained Mn3O4 microspheres were analyzed by SEM, XRD and XPS. The SEM image shown in Fig. 1A indicated that the prepared Mn3O4 microspheres were about 800 nm in diameter, and each microsphere was composed of small-sized Mn3O4 nanoparticles (∼10 nm) (Fig. 1B). Elemental mapping of the Mn3O4 microsphere (Fig. 1C) showed that O and Mn elements were homogeneously distributed within a whole microsphere. The main diffraction peaks in XRD spectrum (Fig. 2A) matched to the standard pattern of hausmannite Mn3O4 [JCPDS card no. 24-0734],23,24 confirming their crystalline nature. Furthermore, the surface of Mn3O4 microspheres was analyzed by XPS. As shown in Fig. 2B and C, Mn 2p3/2 and 2p1/2 peaks were located at 641.67 eV and 653.35 eV, respectively. The atom ratio of Mn2+ and Mn3+ was about 1/2, which was consistent with the theoretical value.25 Moreover, the FT-IR spectrum (Fig. 2D) of Mn3O4 microspheres showed three main bands centered at (407, 502 and 620 cm−1), which were attributed to the Mn–O vibrations of the Mn3O4 framework.17 Thus, the Mn3O4 microspheres could be obtained successfully through a hydrothermal synthesis.
Fig. 1. (A) SEM image of Mn3O4 microspheres. (B) High-magnification SEM image of an individual Mn3O4 microsphere. (C) Elemental mapping images of Mn and O in Mn3O4 microspheres.
Fig. 2. (A) XRD patterns of Mn3O4 microspheres. (B) XPS spectrum of Mn3O4 microspheres. (C) Mn 2p peak of Mn3O4 microspheres. (D) FT-IR spectrum of Mn3O4 microspheres.
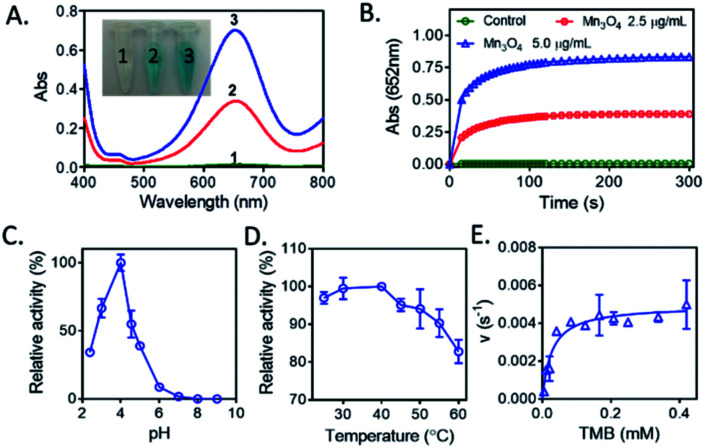
Recently, Mn3O4 materials were reported to have the catalase-like and superoxide dismutase-like activities under neutral conditions for elimination of reactive oxygen species both in vitro and in vivo.26 However, the oxidase-like activity of Mn3O4 has not been reported. We here concentrated on the investigation of the oxidase-like activity possessed by Mn3O4 microspheres, and TMB was used as the substrate of oxidase-like reaction. As presented in Fig. 3A, a deep blue color with maximum absorption peak at 652 nm indicated that Mn3O4 microspheres were able to cause the oxidation of TMB directly. This reaction occurred without the assistance of H2O2. Increasing the concentration of Mn3O4 microspheres was beneficial for the occurrence of this oxidation reaction. The time-dependent absorbance change in Mn3O4-TMB was shown in Fig. 3B, and the oxidation of TMB reached a plateau at ∼2 min at 25 °C, which was much faster than that reported oxidase-like reactions triggered by other nanomaterials for detection of GSH, such as V2O5 (13 min2) and Co, N-doped porous carbon hybrids (20 min).27 So, this quick response between TMB and Mn3O4 laid the foundation of rapid analysis. Similarity to natural enzymes, the catalytic activity of Mn3O4 microspheres was also related to pH (Fig. 3C) and temperature (Fig. 3D). The results showed that the optimal pH and temperature were about 4.0 and 37 °C, respectively. We also measured the maximum initial velocity (Vmax) and Michaelis–Menten constant (Km) of Mn3O4 microspheres (Fig. 3E), the obtained Km value was 0.02715 mM with TMB as the substrate, and the corresponding Vmax value was 126.7 nM s−1. These results demonstrated that Mn3O4 microspheres exhibited the excellent oxidase-like activity.
Fig. 3. (A) The visual color changes and absorbance spectra of TMB. (1) Control, (2) 2.5 μg mL−1 Mn3O4 and (3) 5.0 μg mL−1 Mn3O4. (B) Time-dependent absorbance changes of TMB at 652 nm in the presence of Mn3O4 microspheres. (C) The oxidase-like activity of Mn3O4 microspheres was dependent on pH. TMB: 0.416 mM, Mn3O4: 5.0 μg mL−1. (D) The oxidase mimetic activity of Mn3O4 microspheres was dependent on temperature. TMB: 0.416 mM, Mn3O4: 5.0 μg mL−1. (E) The steady-state kinetic assay of Mn3O4 (5.0 μg mL−1).
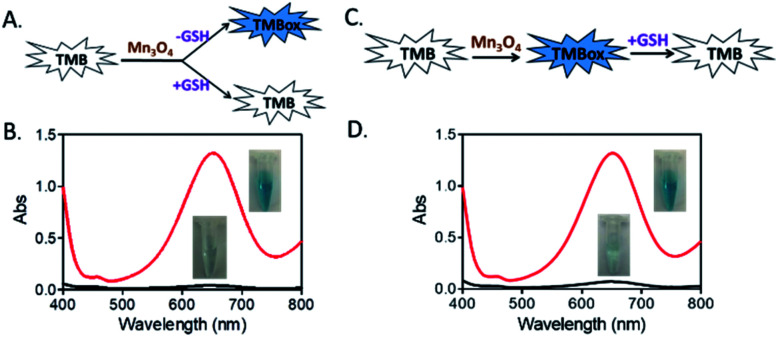
As a most abundant intracellular nonprotein thiolated tripeptide,28,29 GSH plays an important role in regulating oxidative stress for cell function and growth. An abnormal level of GSH related closely to many diseases, such as cancer, Alzheimer's disease and cardiovascular disease.30 Therefore, the sensitive and rapid determination of GSH in biological samples is a matter of cardinal significance. So, we here utilized the oxidase-like activity of Mn3O4 microspheres to detect GSH directly. As displayed in Fig. 4A and B, an obvious blue color was observed in the TMB-Mn3O4 system. However, when TMB, Mn3O4 microspheres and GSH were mixed together at the same time, no color change was found. This result revealed that the presence of GSH inhibited the color reaction of TMB. Moreover, when TMB and Mn3O4 microspheres were first mixed to trigger the color reaction of TMB, a deep blue color would then fade after the addition of GSH into the above system (Fig. 4C and D). This results revealed that the inhibition of the TMB color reaction was resulted in the reduction of the blue TMBox to colorless TMB again by GSH.
Fig. 4. (A) and (B) Absorption spectra and reaction process of the TMB-Mn3O4 system with/without GSH addition at the same time. (C) and (D) Absorption spectra and reaction process of TMB-Mn3O4 system with/without adding GSH into the solution after catalytic reaction. TMB: 5.0 μg mL−1, GSH: 60 μM.
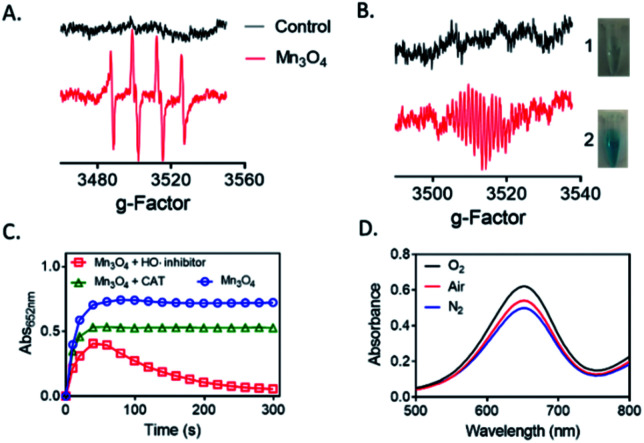
To find the possible mechanism of the oxidase-like activity of Mn3O4 microspheres, we used BMPO-trapped EPR spectra to detect ROS generated in the catalytic reaction. We speculated that oxidase-like activity of Mn3O4 microspheres might be resulted in the catalytic capacity for activation of O2 to generate ROS.31 As shown in Fig. 5A, the BMPO/·OH signal with intensity of 1 : 2 : 2 : 1 were observed, demonstrating the generation of ·OH in Mn3O4 system. We also detected the ESR signal of TMBox in Mn3O4 + TMB + BMPO dispersion, which proved that TMB did happen the oxidation reaction (Fig. 5B). While the GSH was added, the single of TMBox disappeared, corresponding to the results of colorimetric reaction. Thus, we speculated that the electrons provided by Mn3O4 microspheres were captured by O2 in the air to generate H2O2. In the Fenton-like reaction, the metal ion provides an electron to H2O2 and produces HO˙ to further react with the organic compounds. As reported in the previous work,32 the Mn2+ and/or Mn3+ species on the surfaces of Mn3O4 could be converted into Mn4+ species, and the released electrons were trapped by the dissolved O2 in solution to generate H2O2. The H2O2 then created HO˙ radicals to catalyze the oxidation of substrate. In order to further confirm this result, we investigated the impacts of hypotaurine and catalase (CAT), which specifically scavenges HO˙ radicals33 and H2O2, respectively. Fig. 5C indicated that the oxidase-like activity of Mn3O4 microspheres was retarded in the presence of CAT and hypotaurine, verifying that production of intermediates (H2O2 and HO˙). Moreover, the absorbance value at 652 nm of TMB oxidation slight changed in the N2 atmosphere (bubbled with N2 for 30 min), while increased after saturation with O2 (Fig. 5D). This phenomenon also indicated that the dissolved O2 in the reaction system played a key role in TMB oxidation reaction. Thus, GSH, known as antioxidant,34 could exhaust HO˙ produced from Mn3O4–O2 system and suppressed the TMB oxidation reaction. Moreover, GSH is also able to reduce the TMBox to TMB again, causing the color of the whole system fade.
Fig. 5. (A) BMPO trapped EPR spectra over Mn3O4 microspheres after 1 min of reaction. (V = 100 μL, pH = 4.5, Mn3O4 = 100 μg mL−1, BMPO = 10 mM). (B) BMPO trapped EPR spectra over GSH reducing the colored TMBox to colorless TMB after 1 min of reaction. (V = 1 mL, pH = 4.5, Mn3O4 = 10.0 μg mL−1, TMB = 0.416 mM, GSH = 60 μM, BMPO = 10 mM). (C) Effect of HO˙ scavenger (hypotaurine, 10%) and H2O2 scavenger (CAT, 15 μg mL−1) on the oxidase-like activity of Mn3O4. (D) Effect of O2 concentration on the oxidase-like activity of Mn3O4.
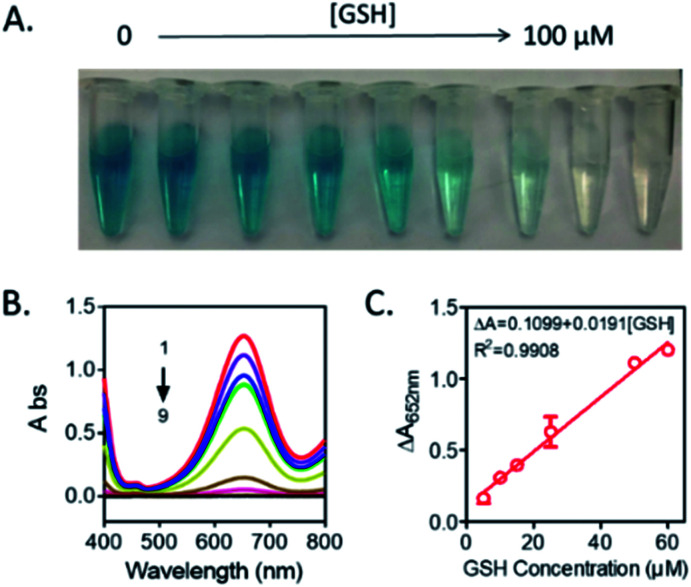
According to the above results, a new bio-analysis assay sensor based on the oxidase-like activity of Mn3O4 microspheres could be proposed for the colorimetric detection of GSH. As displayed in Fig. 6, the absorption peak intensity was decreased with the GSH concentration from 0 to 100 μM, observing the color fading of the solution (Fig. 6A). This phenomena verified the possibility of the colorimetric detection of GSH again. Moreover, it was found that the dependency of the absorbance on the GSH concentration could be well presented by the equation of ΔA = 0.1099 + 0.0191[GSH] (R2 = 0.9908), and the detection limit of GSH was 0.889 μM (S/N = 3). Compared with other reported colorimetric GSH sensors based on TMB (Table 1),35–40 our assay was able to offer comparable performance in terms of limit of detection (LOD) and presented a winder liner range (5–60 μM).
Fig. 6. (A) The photos of the TMB-Mn3O4 system in different concentrations of GSH (from left to right: 0, 5, 10, 15, 25, 50, 60, 80, 100 μM). (B) UV-vis absorption spectra of TMB-Mn3O4 system with various GSH amounts (1–9: 0, 5, 10, 15, 25, 50, 60, 80, 100 μM). (C) The calibration curve of GSH. Reaction condition: 0.416 mM TMB, 10 μg mL−1 Mn3O4 microspheres, pH 4.5 and room temperature.
Comparison of colorimetric detection of glutathione based on TMB.
| Materials | H2O2 (+/−) | Linear range | LOD | Ref. |
|---|---|---|---|---|
| MnO2 nanosheets | − | 1–25 μM | 300 nM | 35 |
| BSA-MnO2 NPs | − | 0.26–26 μM | 100 nM | 22 |
| Co, N-HPC | − | 0.05–30 μM | 36 nM | 27 |
| Gold nanoclusters | + | 2–25 μM | 420 nM | 36 |
| Fe3O4 magnetic nanoparticles | + | 3–30 μM | 3 μM | 37 |
| V2O5 nanozyme | − | 0.01–0.5 μM | 2.4 nM | 2 |
| Carbon quantum dots | + | 0.05–20 μM | 0.016 μM | 38 |
| Ag+ | − | 0.05–8.0 μM | 0.1 μM | 39 |
| Cu1.8S nanoparticles | + | 0.5–10 mM | 0.06 mM | 40 |
| Mn3O4 microspheres | − | 5–60 μM | 0.889 μM | This work |
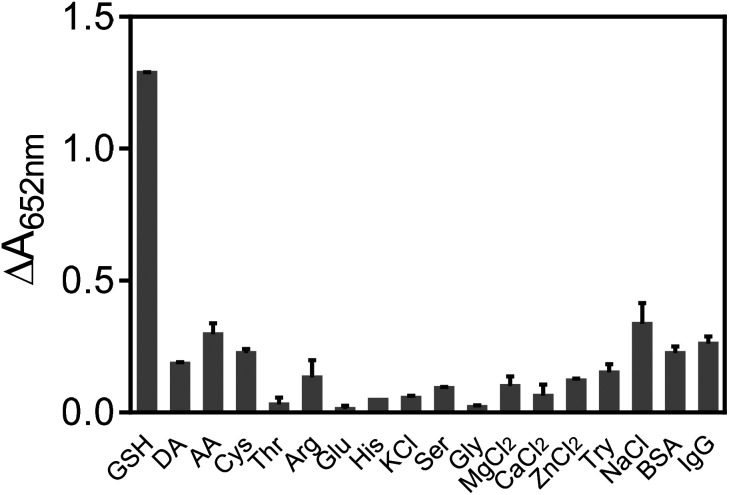
In order to test the specificity of the assay, several common species existed in blood were investigated. As presented in Fig. 7, various amino acids (Cys, Ser, Gly, His, Thr, Try and Arg), biologically relevant metal ions (Na+, Mg2+, Zn2+, Ca2+ and K+), monosaccharides (glucose), ascorbic acid (AA), dopamine (DA), BSA and IgG were checked. The results shown in Fig. 7 indicated that only GSH could induce the obvious inhibition of TMB color reaction, showing the good selectivity of our assay for GSH detection. Furthermore, the practical possibility of the GSH colorimetric method was investigated in human serum samples by the standard addition method, and the recovery studies were also performed, giving recoveries of 94.69–105.41% (Table 2). These results showed that the proposed bio-analysis assay based on the oxidase-like activity of Mn3O4 microspheres had great potential to detect GSH in biological samples accurately and rapidly.
Fig. 7. Selectivity of Mn3O4-TMB system for GSH over other potential interferences. Reaction conditions: 0.416 mM TMB, 10 μg mL−1 Mn3O4 microspheres, pH 4.5 and room temperature. Concentrations of the tested substances: 600 μM, except for 60 μM GSH, 6 μM DA, 6 μM Cys, 20 μM AA, 1 mg mL−1 of BSA, and 1 mg mL−1 IgG.
Recovery test results of GSH in human serum samples.
| Samples | Detected (μM) | Added (μM) | Total found (μM) | Recovery (%) | RSD (%) |
|---|---|---|---|---|---|
| Serum 1 | 1.13 | 1.0 | 2.16 ± 0.13 | 103.07 | 2.24 |
| 5.0 | 5.99 ± 0.25 | 97.37 | 2.56 | ||
| Serum 2 | 4.40 | 1.0 | 5.41 ± 0.18 | 101.39 | 1.92 |
| 5.0 | 9.13 ± 0.15 | 94.69 | 1.19 | ||
| Serum 2 | 1.63 | 1.0 | 2.63 ± 0.17 | 99.72 | 2.76 |
| 5.0 | 6.90 ± 0.20 | 105.41 | 1.96 |
Conclusions
In this study, we constructed a one-pot reaction based on the oxidase-like activity of Mn3O4 microspheres for highly sensitive and selective detection of GSH. This GSH biosensor required neither natural peroxidase nor H2O2 with good repeatability, and could be finished in 5 min, showing the simple and rapid properties. Importantly, this assay also exhibited good reliability for GSH determination in clinical samples.
Conflicts of interest
There are no conflicts to declare.
Supplementary Material
Acknowledgments
This project was funded by the National Natural Science Foundation of China (No. 21703198), the University Natural Science Foundation of Jiangsu Province (16KJD150004). The authors also gratefully acknowledge financial support from the Priority Academic Program Development of Jiangsu Higher Education Institutions and Top-notch Academic Programs Project of Jiangsu Higher Education Institutions.
Notes and references
- Wu J. Wang X. Wang Q. Lou Z. Li S. Zhu Y. Qin L. Wei H. Chem. Soc. Rev. 2019;48:1004. doi: 10.1039/c8cs00457a. [DOI] [PubMed] [Google Scholar]
- Yan X. Prog. Biochem. Biophys. 2018;45:101. [Google Scholar]
- Araki A. Sako Y. J. Chromatogr. 1987;422:43. doi: 10.1016/0378-4347(87)80438-3. [DOI] [PubMed] [Google Scholar]
- He Y. Qi F. Niu X. Zhang W. Zhang X. Pan J. Anal. Chim. Acta. 2018;1021:113. doi: 10.1016/j.aca.2018.02.073. [DOI] [PubMed] [Google Scholar]
- Lin S. Cheng H. Ouyang Q. Wei H. Anal. Methods. 2016;8:3935. doi: 10.1039/C6AY00199H. [DOI] [Google Scholar]
- Lin S. Wei H. Sci. China: Life Sci. 2019;62:710. doi: 10.1007/s11427-019-9518-0. [DOI] [PubMed] [Google Scholar]
- Liu Y. Zheng Y. Ding D. Guo R. Langmuir. 2017;33:13811. doi: 10.1021/acs.langmuir.7b03430. [DOI] [PubMed] [Google Scholar]
- Liu Y. Li H. Guo B. Wei L. Chen B. Zhang Y. Biosens. Bioelectron. 2017;91:734. doi: 10.1016/j.bios.2017.01.020. [DOI] [PubMed] [Google Scholar]
- Liu Y. Yuan M. Qiao L. Guo R. Biosens. Bioelectron. 2014;52:391. doi: 10.1016/j.bios.2013.09.020. [DOI] [PubMed] [Google Scholar]
- Su L. Feng J. Zhou X. Ren C. Li H. Chen X. Anal. Chem. 2012;84:5753. doi: 10.1021/ac300939z. [DOI] [PubMed] [Google Scholar]
- Li R. Zhen M. Guan M. Chen D. Zhang G. Ge J. Gong P. Wang C. Shu C. Biosens. Bioelectron. 2013;47:502. doi: 10.1016/j.bios.2013.03.057. [DOI] [PubMed] [Google Scholar]
- Jv Y. Li B. Cao R. Chem. Commun. 2010;46:8017. doi: 10.1039/C0CC02698K. [DOI] [PubMed] [Google Scholar]
- Majumdar G. Goswami M. Sarma T. K. Paul A. Chattopadhyay A. Langmuir. 2015;21:1663. doi: 10.1021/la047440e. [DOI] [PubMed] [Google Scholar]
- Yin L. Wang Y. Pang G. Koltypin Y. Gedanken A. J. Colloid Interface Sci. 2002;246:78. doi: 10.1006/jcis.2001.8047. [DOI] [PubMed] [Google Scholar]
- Soh M. Kang D. W. Jeong H. G. Kim D. Kim D. Y. Yang W. Baik S. Choi I. Y. Ki S. K. Kwon H. J. Kim T. Kim C. K. Lee S. H. Hyeon T. Angew. Chem., Int. Ed. Engl. 2017;56:11399. doi: 10.1002/anie.201704904. [DOI] [PubMed] [Google Scholar]
- Yao J. Cheng Y. Zhou M. Zhao S. Lin S. Wang X. Wu J. Li S. Wei H. Chem. Sci. 2018;9:2927. doi: 10.1039/C7SC05476A. [DOI] [PMC free article] [PubMed] [Google Scholar]
- Singh N. Savanur M. A. Srivastava S. D'Silva P. Mugesh G. Angew. Chem., Int. Ed. Engl. 2017;56:14455. doi: 10.1002/ange.201708573. [DOI] [PubMed] [Google Scholar]
- Baud O. Greene A. E. Li J. Wang H. Volpe J. J. Rosenberg P. A. J. Neurosci. 2004;24:1531. doi: 10.1523/JNEUROSCI.3989-03.2004. [DOI] [PMC free article] [PubMed] [Google Scholar]
- Zaidi S. A. Shin J. H. Anal. Methods. 2016;8:1745. doi: 10.1039/C5AY03140K. [DOI] [Google Scholar]
- Zhong Q. Chen Y. Su A. Wang Y. Sens. Actuators, B. 2018;273:1098. doi: 10.1016/j.snb.2018.07.026. [DOI] [Google Scholar]
- Ni P. Sun Y. Dai H. Hu J. Jiang S. Wang Y. Li Z. Biosens. Bioelectron. 2015;63:47. doi: 10.1016/j.bios.2014.07.021. [DOI] [PubMed] [Google Scholar]
- Liu X. Wang Q. Zhang Y. Zhang L. Su Y. Lv Y. New J. Chem. 2013;37:2174. doi: 10.1039/C3NJ40897C. [DOI] [Google Scholar]
- Li X. Zhou L. Gao J. Miao H. Zhang H. Xu J. Powder Technol. 2009;190:324. doi: 10.1016/j.powtec.2008.08.010. [DOI] [Google Scholar]
- Li T. Xue B. Wang B. Guo G. Han D. Yan Y. Dong A. J. Am. Chem. Soc. 2017;139:12133. doi: 10.1021/jacs.7b06587. [DOI] [PubMed] [Google Scholar]
- Lee J. W. Hall A. S. Kim J. D. Mallouk T. E. Chem. Mater. 2012;24:1158. doi: 10.1021/cm203697w. [DOI] [Google Scholar]
- Chapple I. L. J. Clin. Periodontol. 2005;24:287. doi: 10.1111/j.1600-051X.1997.tb00760.x. [DOI] [PubMed] [Google Scholar]
- Li S. Wang L. Zhang X. Chai H. Huang Y. Sens. Actuators, B. 2018;264:312. doi: 10.1016/j.snb.2018.03.015. [DOI] [Google Scholar]
- Xu Y. Chen X. Chai R. Xing C. Li H. Yin X. B. Nanoscale. 2016;8:13414. doi: 10.1039/C6NR03129C. [DOI] [PubMed] [Google Scholar]
- Yan X. Song Y. Zhu C. Song J. Du D. Su X. Lin Y. ACS Appl. Mater. Interfaces. 2016;8:21990. doi: 10.1021/acsami.6b05465. [DOI] [PubMed] [Google Scholar]
- Jung H. S. Chen X. Kim J. S. Yoon J. Chem. Soc. Rev. 2013;42:6019. doi: 10.1039/C3CS60024F. [DOI] [PubMed] [Google Scholar]
- He W. Liu Y. Yuan J. Yin J. J. Wu X. Hu X. Zhang K. Liu J. Chen C. Ji Y. Guo Y. Biomaterials. 2011;32:1139. doi: 10.1016/j.biomaterials.2010.09.040. [DOI] [PubMed] [Google Scholar]
- Weng Z. Li J. Weng Y. Feng M. Zhuang Z. Yu Y. J. Mater. Chem. A. 2017;5:15650. doi: 10.1039/C7TA04042C. [DOI] [Google Scholar]
- Gao L. Giglio K. M. Nelson J. L. Sondermann H. Travis A. J. Nanoscale. 2014;6:2588. doi: 10.1039/C3NR05422E. [DOI] [PMC free article] [PubMed] [Google Scholar]
- Halliwell B. Am. J. Med. 1991;91:14S. doi: 10.1016/0002-9343(91)90279-7. [DOI] [PubMed] [Google Scholar]
- Liu J. Meng L. Fei Z. Dyson P. J. Jing X. Liu X. Biosens. Bioelectron. 2017;90:69. doi: 10.1016/j.bios.2016.11.046. [DOI] [PubMed] [Google Scholar]
- Feng J. Huang P. Shi S. Deng K. Wu F. Anal. Chim. Acta. 2017;967:64. doi: 10.1016/j.aca.2017.02.025. [DOI] [PubMed] [Google Scholar]
- Ma Y. Zhang Z. Ren C. Liu G. Chen X. Analyst. 2011;137:485. doi: 10.1039/C1AN15718C. [DOI] [PubMed] [Google Scholar]
- Zhong Q. Chen Y. Su A. Wang Y. Sens. Actuators, B. 2018;273:1098. doi: 10.1016/j.snb.2018.07.026. [DOI] [Google Scholar]
- Ni P. Sun Y. Dai H. Hu J. Jiang S. Wang Y. Li Z. Biosens. Bioelectron. 2015;63:47. doi: 10.1016/j.bios.2014.07.021. [DOI] [PubMed] [Google Scholar]
- Zou H. Yang T. Lan J. Huang C. Anal. Methods. 2017;9:841. doi: 10.1039/C6AY03034C. [DOI] [Google Scholar]


