Abstract
The present study aimed to develop and validate an advanced image stitching algorithm integrated with chemical imaging at the nanometre scale. This was applied to track the swelling, erosion, drug release and changes in surface texture of a swelling-controlled release system. The technique involves the delivery and withdrawal of a liquid droplet from the surface of the tablet alongside capturing multiple images of tablet surface using white light profilometry. The recovered liquid was then subject to chemical analysis for the quantification of drug and HPMC. The multiple images acquired during drug release were stitched together using an algorithm developed to generate a full tablet surface. New methods for swelling analysis (regional point, area and multiple regional analysis techniques) were also successfully developed. The results exhibited the exceptional capability of this technique for providing quantitative information regarding swelling, erosion, drug release and surface topography, hence negating the need for separate investigations. Moreover, it can also be anticipated that this technique may have potential use in other fields where surface dissolution, erosion and swelling have significant impact.
Nanoscale chemical imaging technique for simultaneous quantification of swelling, erosion, drug release and 3D surface topography with full surface scanning.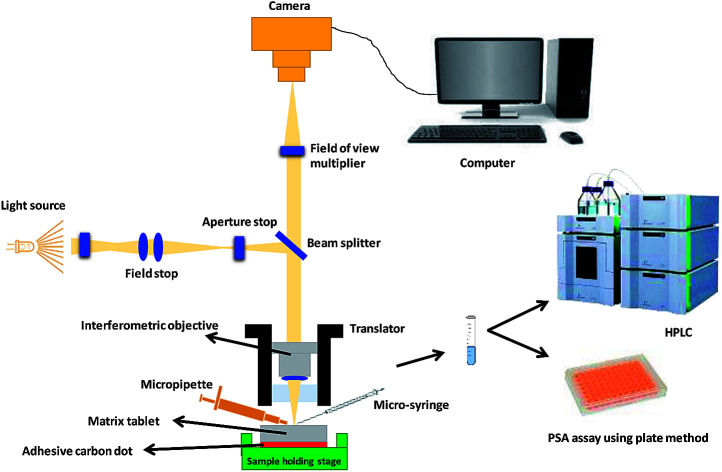
1. Introduction
Surface topography is an important consideration when designing and developing pharmaceutical formulations. The surfaces of solid pharmaceutical formulations, for example tablets, contain a unique distribution of peaks and valleys depending upon the properties of drugs and excipients or the type of processing and manufacturing methods employed.1 In addition, dissolution and drug release kinetic studies are considered vital for assessing formulation quality, functionality, performance, uniformity and stability.2–4 Moreover, during the dissolution process, the surface topography changes upon contact with liquid (dissolution media or biological fluids). One specific example of this is the dissolution process of hydrophilic matrices, which involves simultaneous swelling, erosion and drug release.5 On submersion in liquid, the liquid starts to imbibe into the matrix tablet which results in the disentanglement and relaxation of the polymer chains leading to the swelling of the matrix tablet.6,7 This process also leads to changes in the surface topography over time. Although these processes occur simultaneously, conventional techniques involve separate analysis of swelling, erosion and drug release, and evaluation of surface topography is rarely conducted.
Typically, nanoscale imaging is conducted using white light and variable focus profilometry techniques, confocal and atomic force microscopy (AFM).8–11 However, imaging a large area is a challenge as, with confocal microscopy and profilometric techniques, scanning of the full surface of the pharmaceutical formulation is not possible. Currently, AFM is considered the most powerful and versatile technique for nanoscale imaging and multiple studies have successfully employed this technique, either alone or in combination with another imaging technique, to quantitatively assess surface topography.9,10,12 A study conducted by Saurí et al. (2015), investigated the relationship between surface free energy, surface texture parameters and controlled drug release in hydrophilic matrices.10 Contact angle was used to determine the surface energy and both confocal microscopy and AFM were utilised for the surface characterisation of the hydrophilic matrix tablets. Additionally, images of a selected area of tablet surface (636.61 μm × 477.25 μm) were acquired before and after wetting with water using confocal microscopy. Although this area is larger than that one can scan with AFM, however, it is not large enough to capture the complete tablet surface.10 Similarly, a study by Paredes et al. (2006), monitored the real-time swelling of a polymer (poly(p-phenylene terepthalamide)) using AFM. The captured images displayed the topographical changes in the polymer surface after oxygen plasma treatment. Yet, the size of the scanned area was also extremely limited at only 1 μm × 1 μm.9 Although all the aforementioned techniques are not only powerful but also have the capability to capture images at nanoscale yet in literature, there is not a single study available where imaging the full surface of the sample was reported. Moreover, in the case of tablets usually >5 millimetres, full surface imaging is a very challenging task.
Hence, the current study uses image stitching algorithms integrated with nanoscale chemical imaging to scan the full surface of the pharmaceutical dosage form alongside providing the chemical information. To the best of our knowledge, this is the first report in which the entire surface of a pharmaceutical dosage is scanned with nanometre scale z-resolution, which allows simultaneous quantification of swelling, matrix erosion, drug release and 3D surface texture analysis. The model controlled-release pharmaceutical system used in this study was a blend of a widely used cellulose-based pharmaceutical excipient (hydroxypropyl methylcellulose, HPMC) and a non-selective β-antagonist, propranolol hydrochloride.
2. Experimental section
2.1. Materials
Hydroxypropyl methylcellulose, HPMC, (K4M) and propranolol HCl were acquired from Colorcon, Dartford, UK and Sigma Aldrich Chemical Co., respectively. Sulphuric acid, hydrochloric acid and phenol were purchased from Sigma-Aldrich, UK, and all were of analytical grade.
2.2. Methods
2.2.1. Preparation of powder mixture and matrix tablets
A mixture of HPMC (30% w/w) and propranolol (70% w/w) was prepared by blending the powders in a tubular mixer (Artisan Technology Group®) at 50 rpm for 15 min. Content uniformity tests carried out using ultraviolet spectroscopy confirmed uniform mixing. A Testometric™ M500 – 50 CT (Testometric™ Company Ltd., United Kingdom) apparatus directly connected to a computer was used to compress 300 mg of the powder mixture with a 50 kN load cell equipped with a 13.00 mm Atlas Evacuable Pellet Die (Specac® Limited, UK). Polished flat-faced punches were used, where the lower punch was held stationary while the upper punch moved at a speed of 3 mm min−1 during loading and 1 mm min−1 on unloading. The compacts or tablets were produced at an applied pressure of 150 MPa. After the tablets were ejected, they were stored in an air-tight container over silica gel for 24 h to allow for elastic recovery before further investigation. Relative humidity and temperature during compaction work were in the range of 20 to 35% RH and 25 to 27 °C, respectively.
2.2.2. Experimental set-up
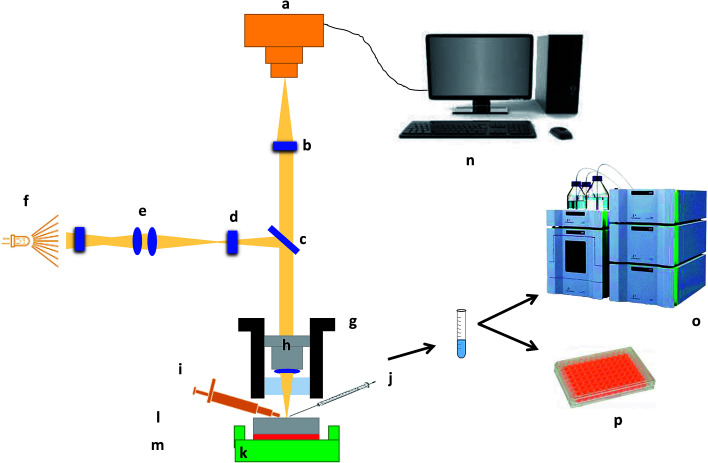
For in situ surface swelling, erosion and drug release studies, each tablet was fixed on a solid 3D printed sample holding stage using a carbon sticky dot and 10 μL of double-distilled water was applied to the surface using a Hamilton syringe 1700 series (Sigma-Aldrich Chemical Co.). After specified times (0, 3 and 6 s), liquid was removed from the matrix tablet surface using the same Hamilton syringe. The collected liquid samples were then normalised to 5 mL using double-distilled water for further chemical analysis. Nanoscale images of the matrix tablet surface were captured using Contour GT Elite K (Bruker Nano-Surfaces, Bruker Ltd, Coventry, UK). A total 35 images were collected in order to image the whole matrix tablet surface and the whole experiment was conducted in a controlled environment (temperature 18–25 °C and RH 25–33%) with an acquisition time of <1 min. The collected liquid samples were analysed by high performance liquid chromatography (HPLC) and phenol sulphuric acid (PSA) assay7 for the quantification of propranolol HCl and HPMC, respectively. Moreover, the residual tablets, post-study, were subjected to chemical analysis for validation purposes. A schematic depicting the whole experiment process is illustrated in Fig. 1.
Fig. 1. Schematic illustration of the experimental and imaging set-up. (a) Camera, (b) field of view multiplier, (c) beam splitter, (d) aperture stop, (e) field stop, (f) light source, (g) translator, (h) interferometric objective, (i) micropipette, (j) micro-syringe, (k) sample holding stage, (l) matrix tablet, (m) adhesive carbon dot, (n) computer, (o) high-performance liquid chromatography (HPLC) and (p) phenol-sulphuric acid assay using plate method.
2.2.3. Image analysis algorithm
A novel image stitching algorithm was used to stitch the collected images to develop a single overall matrix tablet surface using MATLAB® 2017 software (The MathWorks, Inc. USA). Briefly, this process consists of two stages; (a) image stitching and (b) image blending. Firstly the, stitching was performed by generating the relative position of collected images followed by the identification of the correlation point which was performed by sliding the adjacent edges of the image in both directions until a best match of edge features are established. This method entails the choice of an optimal search space as illustrated in Fig. 2a, in which a detailed assessment was performed to identify the best correlation (which was a 20% overlap in the present study). The normalised cross-correlation can be expressed by the following equation (eqn (1));
 |
1 |
where, w(x, y) represents a pixel value of the image. w̄ is the mean value of the overall pixels included in the box area. f(x + i, y + j) represents a pixel value of the composite image inside the box area. f̄(i, j) is the mean value of the of the composite image inside the box area. K, L represents the box dimensions.
Fig. 2. Schematic illustrations showing (a) image stitching and (b) blending of overlapping image intensities.
Secondly, an advanced image blending algorithm was applied to improve the visual quality of the composite image. The process is illustrated in Fig. 2b where an overlap between a new image and the composite image is shown.
2.2.4. Quantitative swelling analysis
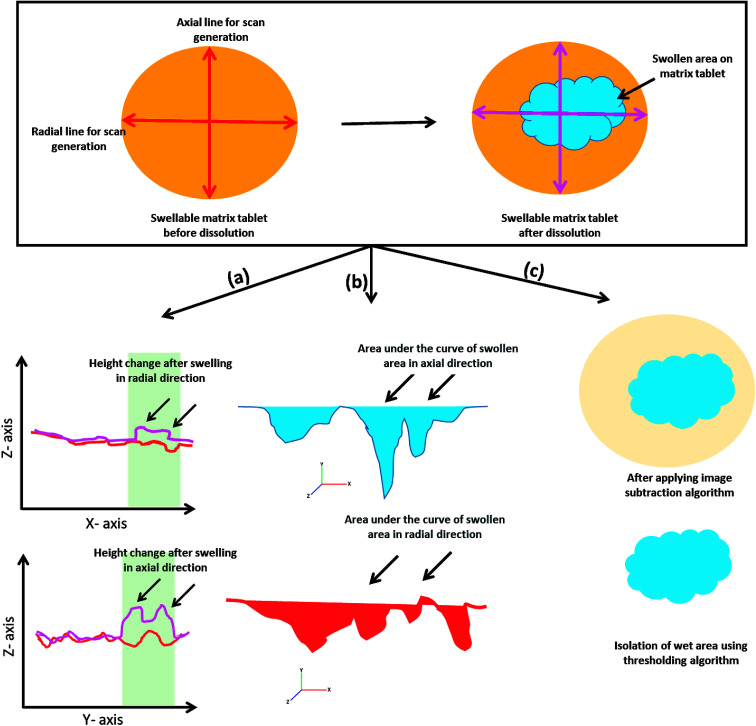
After successful image stitching, swelling analysis was carried out as detailed in Fig. 3. Briefly, a line scan of a ROI (region of interest) was generated using MATLAB® 2017 software (The MathWorks, Inc. USA) and the swelling was quantified by noting the changes in the line profile under the influence of liquid with respect to time. Moreover, the area under the curve of the same profile was also determined and the changes with respect to time was noted. The variations in x-axis and y-axis directions were named as radial and axial swelling, respectively. These processes are referred as regional point (line) and area (area under the curve, AUC) based swelling analysis methods. Additionally, image subtraction with an image thresholding algorithm was also applied and stitched hydrated tablet surface images were subtracted from their parent stitched image captured at time zero. Moreover, the hydrated area on the tablet surface was separated and this was named as multiple regional swelling analysis method.
Fig. 3. Schematic illustration of quantitative swelling analysis algorithms (a) regional point (b) regional area and (c) multiple regional analysis.
2.2.5. 3D quantitative surface texture parametric analysis
3D quantitative surface texture parameters of all the stitched images were determined using MATLAB® 2017 software (The MathWorks, Inc. USA). As this principle was used for the first time, the surface texture parameters of the resulted stitched image of the matrix surface were validated with singly acquired images (n = 5) using conventional white light interferometry (Contour GT Elite K, Bruker Nano Surfaces, Bruker UK Ltd, Coventry, UK) and atomic force microscopy, AFM (Dimension Icon, Bruker Nano Surfaces, Bruker UK Ltd, Coventry, UK). Briefly, the matrix tablet was fixed on a solid substrate using sticky dots and the surface was imaged using Contour GT Elite K or Dimension Icon. The scan size was 1.1 × 1.82 mm2 and 25 × 25 μm2 for white light interferometry and AFM, respectively. SPSS (Statistical Package for the Social Sciences) software version 20 was employed for two-way analysis of variance (ANOVA) with post-hoc test (confidence limit of P < 0.05) to compare findings from the stitched, profilometry and AFM images.
2.2.6. Drug release (propranolol HCl) quantification
A reverse phase C-18 column (Phenomenex) and a mobile phase consisting of acetonitrile: 0.1 M pH 4.5 phosphate buffer (30 : 70% v/v) were used to determine propranolol concentration. Data were analysed using LC-solution software (Shimadzu Corporation, Switzerland). A wavelength of 229 nm was used to detect propranolol in all samples of varying concentration (2.5–80 μg mL−1) with a retention time of approximately 7.1 min. The limit of detection (LOD) and limit of quantification (LOQ) were 0.140 ± 0.07 μg mL−1 and 0.366 ± 0.135 μg mL−1, respectively, and the recovery was 98.55%.
2.2.7. Method for HPMC quantification and overall erosion
To quantify the dissolved HPMC, the procedure previously described was adapted.5,7,13 In the current modified method, 20 μL of 5% v/v phenol was added to 20 μL of the liquid sample containing HPMC in microplate wells followed by mixing (5 min) using a shaking plate mixer. H2SO4 (100 μL) was added to each well and mixed again for 5 min. The solutions were then incubated for 15 min at room temperature (20 to 25 °C) before the UV absorbance was read at 488 nm using a microplate reader and dissolved HPMC was quantified using a standard calibration curve for HPMC. Moreover, overall matrix erosion was calculated by simply summing the drug and HPMC dissolved at a specified time point.
3. Results and discussion
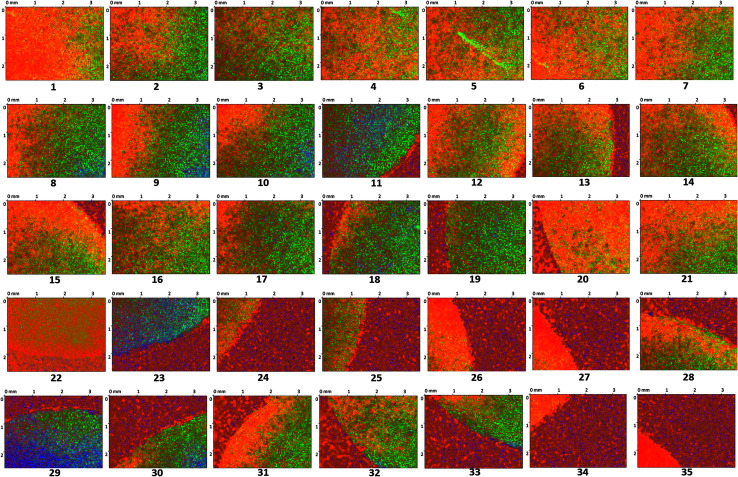
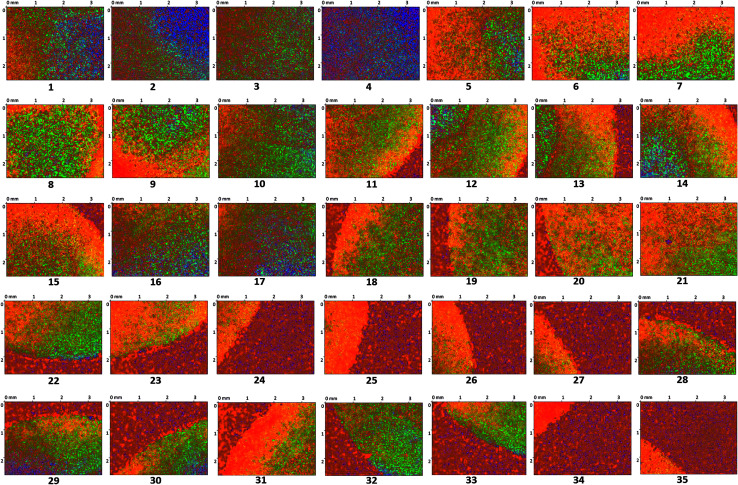
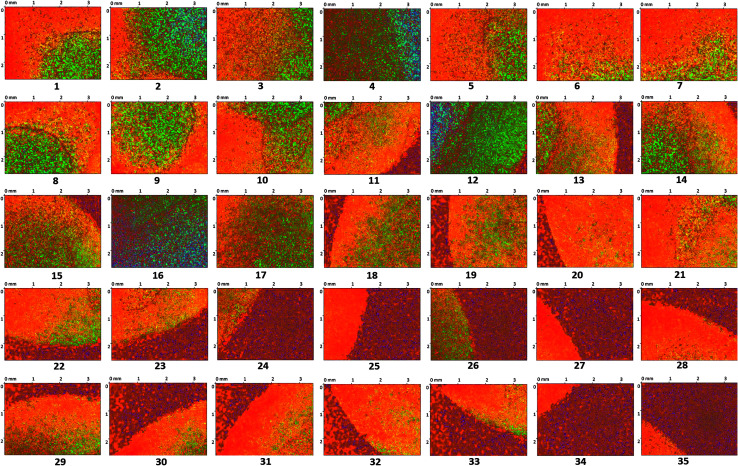
The surface of the dry HPMC tablet was scanned in a spiral fashion beginning from the center of the tablet. This was repeated on the same tablet after 3 and 6 seconds of liquid exposure. Each scan produced 35 images (3.5 × 2.5 mm2 each), which are displayed with respect to time in Fig. 4–6. These images were then arranged and pieced together with a 20% overlap (Fig. 7) and an image stitching algorithm was used to produce an image of the overall tablet surface having a diameter of 13 mm (Fig. 8). This image stitching technique was compared with a single image captured using Contour GT Elite K and AFM (Fig. 9). The surface texture parameters obtained from these analyses are displayed in Table 1 and revealed that all three imaging techniques were comparable and differences were statistically insignificant (P < 0.05). However, the stitching algorithm integrated technique using the Contour GT Elite K (white light profilometer) demonstrated a clear advantage over the other techniques of being able to image the whole surface of the tablet, whereas the single image techniques using AFM and Contour GT Elite K were only able to capture a small surface area (25 × 25 μm and 1.1 × 1.82 mm2, respectively) (Fig. 9).
Fig. 4. 2D surface texture images (1–35) of the matrix tablet surface at time zero.
Fig. 5. 2D surface texture images (1–35) of the matrix tablet surface after 3 seconds.
Fig. 6. 2D surface texture images (1–35) of the matrix tablet surface after 6 seconds.
Fig. 7. The stitched images of matrix tablet surface at time points (a) 0 s, (b) 3 s and (c) 6 s after addition of liquid.
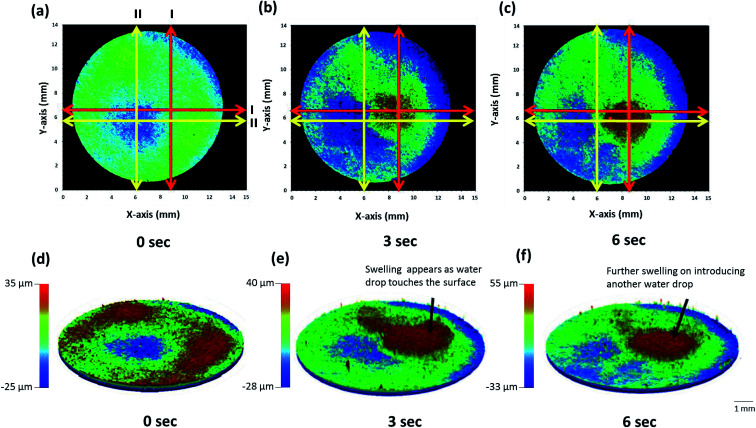
Fig. 8. 2D (a–c) and 3D (d–f) stitched images of whole matrix tablet surface with respect to time showing surface swelling and dissolution.
Fig. 9. 3D surface texture images of HPMC matrix tablet (a) single image captured using Contour GT Elite K (b) stitched image developed using multiple images captured using Contour GT Elite K and (c) single image captured using AFM.
Comparative 3D quantitative surface texture parameters of HPMC matrices (n = 5, standard deviations are in parenthesis).
| Surface texture parameter | Contour GT Elite K (single image) | Contour GT Elite K (whole surface) | Dimension icon (AFM) |
|---|---|---|---|
| Sa (μm) | 3.22 (0.20) | 3.35 (0.18) | 3.11 (0.15) |
| Sq (μm) | 4.09 (0.11) | 4.23 (0.19) | 3.93 (0.17) |
| Sz (μm) | 93.22 (9.29) | 106.34 (11.29) | 99.34 (6.99) |
| Sp (μm) | 44.11 (5.88) | 51.86 (4.11) | 51.12 (3.89) |
| Sv (μm) | 49.11 (6.15) | 54.48 (5.13) | 48.22 (4.22) |
| Sku (μm) | 2.89 (0.88) | 3.044 (0.50) | 3.09 (0.15) |
| Ssk (μm) | −0.177 (−0.08) | −0.189 (−0.07) | −0.195 (−0.09) |
| Sds (μm−2) | 80.22 (8.11) | 84.2 (6.88) | 81.39 (9.21) |
| Sal (μm) | 84.55 (3.88) | 91.20 (2.54) | 87.89 (3.18) |
| Str | 0.86 (0.09) | 0.880 (0.07) | 0.86 (0.06) |
| Vm (μm3 μm−2) | 0.188 (0.05) | 0.192 (0.06) | 0.189 (0.04) |
| Vv (μm3 μm−2) | 3.77 (0.51) | 3.82 (0.44) | 3.74 (0.59) |
| Vvv (μm3 μm−2) | 0.189 (0.08) | 0.195 (0.06) | 0.186 (0.07) |
| Vvc (μm3 μm−2) | 3.01 (0.12) | 3.15 (0.20) | 2.98 (0.23) |
| Vmc (μm3 μm−2) | 1.75 (0.22) | 1.84 (0.18) | 1.77 (0.15) |
| Vvc + Vmc (μm3 μm−2) | 4.76 (0.28) | 4.99 (0.29) | 4.75 (0.30) |
| Sdr | 0.492 (0.05) | 0.512 (0.09) | 0.500 (0.05) |
| Sdq | 0.992 (0.10) | 1.02 (0.11) | 0.994 (0.09) |
Upon application of a water droplet, the surface of the tablet was altered and swelling of the tablet surface was clearly visible in the 2D and 3D images (Fig. 8). The dry tablet presented multiple small peaks distributed evenly across the tablet surface as displayed by the green area in Fig. 8a and the red area in Fig. 8d. After the addition of a water droplet for 3 seconds, the liquid was imbibed into the matrix tablet leading to swelling of the tablet surface. This process is visible in the image displayed in Fig. 8b in which the location where the water droplet was applied had developed a red color indicating the presence of substantial peaks due to swelling and some minor swelling in the surrounding area shown by the green color. Additionally, localized swelling in the position of the water droplet can be seen in the 3D image (Fig. 8e). The application of a water droplet for 6 seconds led to additional swelling in the same region shown by a larger red and green area in Fig. 8c compared with Fig. 8b, and an increase in peak heights displayed in Fig. 8f. This qualitative analysis of the swelling behavior of the matrix tablet highlights the main advantage of the image stitching algorithm used in this study. By capturing the surface topography of the whole tablet surface with very minimal delay (<1 min) in the capturing of each image, this algorithm provides quantitative data regarding the distribution and heights of peaks and valleys across the whole tablet surface. Additionally, it was also able to display real-time changes in the surface topography of the same tablet during the swelling process after the addition of a water droplet.
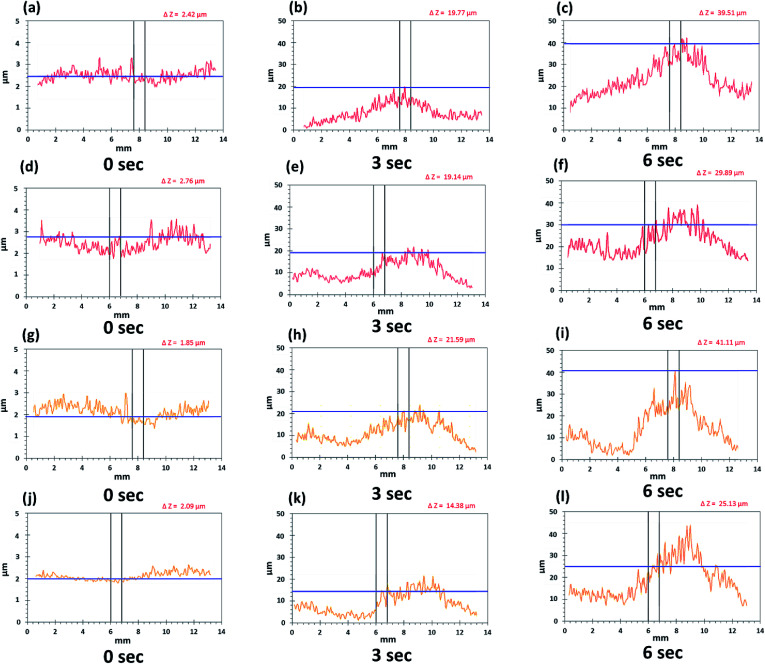
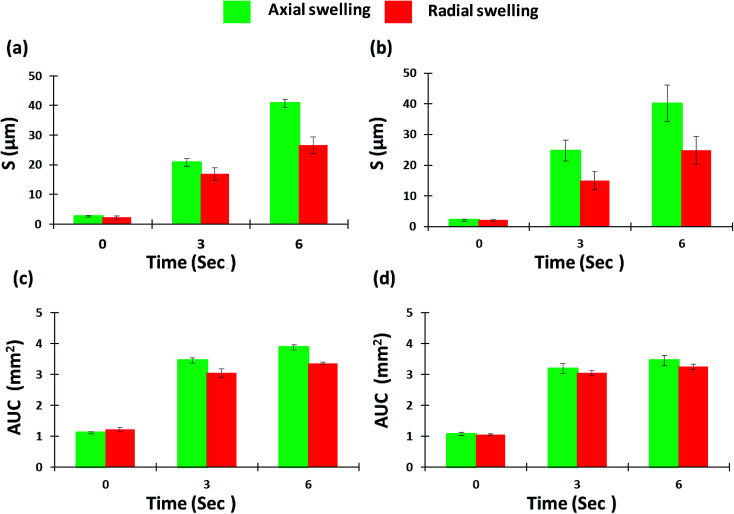
By providing images of the whole tablet surface, multiple regions of the same tablet can be analyzed simultaneously to also provide more accurate and reproducible quantitative data. Moreover, the same points and areas can be selected and re-analyzed to assess the changes in surface topography during swelling. These features were emphasized during regional point and regional area swelling analyses of the tablet surface which resulted in the line scan profiles displayed in Fig. 10. These analyses were conducted at two different regional points and areas as displayed by the yellow and red arrows in Fig. 8a–c. The color of the line in the line scan profiles corresponds to the color of the analyzed region. Furthermore, the data obtained from these analyses, including peak height (μm) for regional point analysis and area under the curve (AUC (mm2)) for regional area analysis, were used to produce the bar charts presented in Fig. 11 displaying the axial and radial matrix tablet surface swelling analysis results. The results of these analyses clearly demonstrated the swelling behavior of the matrix tablet after exposure to water. This was revealed by a significant increase in the AUC (mm2) from 0 seconds to 3 seconds in both the axial and radial direction. A further increase was seen from 3 seconds to 6 seconds, although this was not considerable (Fig. 11c and d). A more substantial and linear increase was seen in the peak height of the regional points. From all the analyzed regional points, the lowest peak height was 1.85 ± 0.27 μm. After exposure to water for 3 seconds, the peak height of the same point increased to 21.59 ± 1.88 μm and after exposure for a further 6 seconds, the peak height increased to 41.11 ± 2.89 μm (Fig. 10g–i).
Fig. 10. Line scan profiles of whole matrix tablet surface in axial (a–c, line I and g–i, line II) and radial direction (d–f, line I and j–l, line II).
Fig. 11. Axial and radial matrix tablet surface swelling based on (a, red line and b, yellow line) regional point and (c, red line and d, yellow line) regional area.
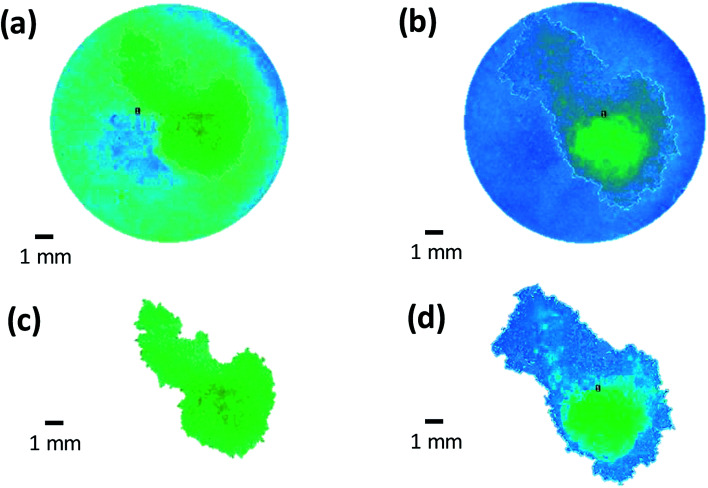
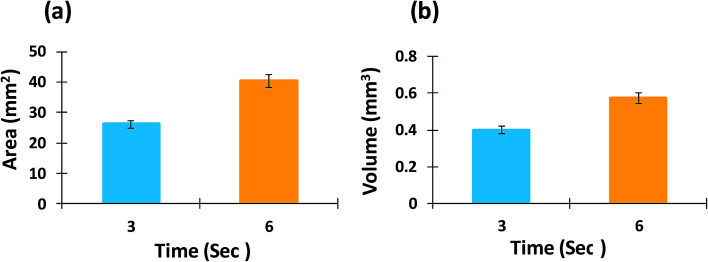
Multiple regional analysis of surface swelling of the matrix tablet was also conducted using image subtraction and image thresholding algorithms (Fig. 12). Using this technique, the entire hydrated area was successful isolated and the area and volume of the swollen surface of the tablet was measured and is displayed in Fig. 13. These results were able to provide further quantitative information regarding the swelling process of the matrix tablet and displayed an increase in the area and volume of the swollen surface area of the tablet from 3 seconds to 6 seconds.
Fig. 12. Multiple regional analysis of surface swelling of matrix tablet using (a and b) image subtraction (c and d) image thresholding algorithm.
Fig. 13. (a) Area and (b) volume measurement of swollen surface of matrix tablet using multiple regional analysis.
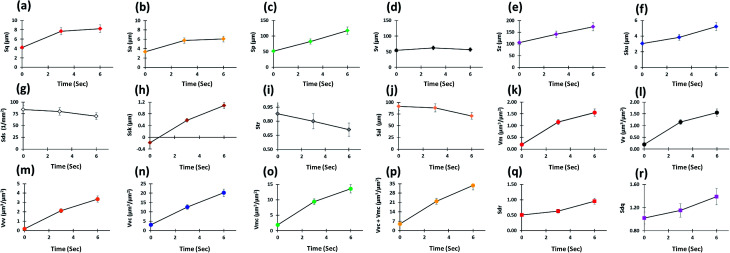
Multiple surface texture parameters were also calculated including amplitude, spacing, volume, and hybrid parameters as presented in Fig. 14. In general, these parameters displayed an increase in overall peak heights on the tablet surface as the contact time (sec) with water increased although the maximum height of valleys remained similar over time, as well as a shift in peak height distribution from a normal distribution (Sku = 3) to a spiked distribution (Sku > 3), indicating an increase in the predominance of inordinately high peaks (Fig. 14a–f). Moreover, a clear increase in void volume, as displayed by the volume parameters, was seen over time (Fig. 14k–p). These parameters represent numerous factors relating to the volume of space contained by the surface from a plane at a height corresponding to a specific material ratio. This demonstrated the increase in tablet swelling as the contact time with water was increased (Fig. 14k–p). Also, as the values of sdq and sdr of a completely level surface are 0, increases in the hybrid parameters showed an increase in the number and/or gradient of slopes present on the tablet surface (Fig. 14q and r) as expected due to the swellable nature of the matrix tablet. However, the density of peaks (summit density) did not increase and showed a small decrease over time (Fig. 14g). This may be due to existing peaks merging as the tablet surface swells. This pattern may also be caused by the formation of a gel layer, which causes the surface to become smoother while increasing the peak height.
Fig. 14. In situ 3D surface texture analysis with respect to time (a–g) amplitude, (h and i) spacing, (j–p) volume and (q and r) hybrid parameters.
As well as conducting surface topography analysis, drug release, polymer dissolution, and overall erosion profiles from the surface of the matrix tablet were also obtained from the same tablet (Fig. 15). Polymer present at the outermost surface of the hydrophilic matrix tablet is diluted by the water droplet over time to a point where the polymeric network starts to dissolve. This leads to disentanglement of the polymeric chain and causes the matrix system to dissolve from the surface.5 The mechanism and rate of drug release is controlled by swelling, matrix erosion and/or diffusion of drug through the gel layer.7 As these are dynamic processes and occur concurrently, the techniques used in this study allowed these parameters to be quantified simultaneously. The concentration of polymer in the removed sample at each time point was quantified using a modified phenol-sulphuric acid (PSA) assay. This technique used a microplate containing multiple wells for samples which provided numerous advantages to this study. As multiple samples could be placed and treated in the same microplate, this allowed faster analysis of samples and a reduction in the amount of material required; providing time saving and economic benefits. As expected, these data displayed an increase in these parameters as dissolution time increased. A slight increase in the rate of HPMC dissolution was seen between 3 seconds and 6 seconds compared with 0 seconds to 3 seconds (Fig. 15b). This may be link to the time require for wetting, polymer hydration and onset of disentanglement (Fig. 14a–g).
Fig. 15. (a) Drug release, (b) HPMC dissolution and (c) overall erosion profiles from the surface of matrix tablet.
4. Conclusions
Using the principles of white light profilometry, an advanced imaging algorithm with integrated chemical imaging was developed, validated and successfully employed to analyse the surface topography of a swellable pharmaceutical formulation at a nanometre scale. With integration of an image stitching algorithm, this technique was able to achieve imaging of the complete tablet surface (13 mm). Furthermore, the swollen area was isolated using image subtraction and image thresholding algorithms and further quantitative data were obtained. It is anticipated that simultaneous swelling, drug release, polymer dissolution and overall erosion analysis of matrix tablets using this technique will provide researchers with further understanding of these dynamic processes at a nanometre level. Additionally, the use of this novel technique will prove to be a powerful method for analysing the structure of a wide range of materials in different diverse fields where surface dissolution, erosion and swelling have significant impact.
5. Author's contribution
Study concept and design: Muhammad Usman Ghori. Acquisition of data: Jorabar Singh Nirwan, Muhammad Usman Ghori. Analysis and interpretation of data: Jorabar Singh Nirwan, Muhammad Usman Ghori. Writing: Jorabar Singh Nirwan, Barbara R. Conway, Muhammad Usman Ghori. Project administration: Muhammad Usman Ghori. Supervision: Muhammad Usman Ghori.
Conflicts of interest
There are no conflicts to declare.
Supplementary Material
Acknowledgments
Authors would like to thanks Dr Vishal Panchal for helping in experiments, data analysis and reviewing and Dr Boudjelida Boumedienne for his generous support and permission for using the Contour GT Elite K profilometer at Bruker Nano Surfaces, Banner Lane, Coventry UK. Moreover, the authors also thankful to Colorcon, UK and University of Huddersfield, UK for providing HPMC samples and financial assistance, respectively.
References
- Bhushan B., Modern Tribology Handbook, Two Volume Set, ed. B. Bhushan, CRC Press, Brazil, 2000, pp. 74–144 [Google Scholar]
- Parojčić J. Đurić Z. Jovanović M. Ibrić S. Drug Delivery. 2004;11:59–65. doi: 10.1080/10717540490265379. [DOI] [PubMed] [Google Scholar]
- Maggi L. Segale L. Torre M. Ochoa Machiste E. Conte U. Biomaterials. 2002;23:1113–1119. doi: 10.1016/S0142-9612(01)00223-X. [DOI] [PubMed] [Google Scholar]
- Colombo P. Bettini R. Peppas N. J. Controlled Release. 1999;61:83–91. doi: 10.1016/S0168-3659(99)00104-2. [DOI] [PubMed] [Google Scholar]
- Ghori M. U. Conway B. R. Am. J. Pharmacol. Sci. 2015;3(5):103–109. [Google Scholar]
- Munday D. L. Cox P. J. Int. J. Pharm. 2000;203(1–2):179–192. doi: 10.1016/S0378-5173(00)00444-0. [DOI] [PubMed] [Google Scholar]
- Ghori M. U. Ginting G. Smith A. M. Conway B. R. Int. J. Pharm. 2014;465:405–412. doi: 10.1016/j.ijpharm.2014.02.028. [DOI] [PubMed] [Google Scholar]
- Narayan P. Hancock B. C. Mater. Sci. Eng., A. 2003;355(1–2):24–36. doi: 10.1016/S0921-5093(03)00059-5. [DOI] [Google Scholar]
- Parades J. Villar-Rodil S. Tamargo-Martínez K. Martínez-Alonso A. Tascón J. Langmuir. 2006;22:4728–4733. doi: 10.1021/la052428n. [DOI] [PubMed] [Google Scholar]
- Saurí J. Suñé-Negre J. Díaz-Marcos J. Vilana J. Millán D. Ticó J. Miñarro M. Pérez-Lozano P. García-Montoya E. Int. J. Pharm. 2015;478:328–340. doi: 10.1016/j.ijpharm.2014.11.054. [DOI] [PubMed] [Google Scholar]
- Yarce C. Echeverri J. Palacio M. Rivera C. Salamanca C. Pharmaceuticals. 2017;10:15. doi: 10.3390/ph10010015. [DOI] [PMC free article] [PubMed] [Google Scholar]
- Bolean M. Borin I. Simão A. Bottini M. Bagatolli L. Hoylaerts M. Millán J. Ciancaglini P. Biochim. Biophys. Acta, Biomembr. 2017;1859:1911–1920. doi: 10.1016/j.bbamem.2017.05.010. [DOI] [PMC free article] [PubMed] [Google Scholar]
- Ghori M. U. Grover L. M. Asare-Addo K. Smith A. M. Conway B. R. Pharm. Dev. Technol. 2018;23(2):183–197. doi: 10.1080/10837450.2017.1389958. [DOI] [PubMed] [Google Scholar]


