Abstract
In this work, drug-loaded polymer microparticles were prepared by a supercritical solution impregnation (SSI) process with nitrendipine as the model drug and PLLA–PEG–PLLA as the drug carrier. The morphology, size, distribution and functional groups of the drug-loaded microparticles were characterized by scanning electron microscopy (SEM), laser particle size analyzer and fourier transform infrared analysis (FTIR). The effects of pressure, temperature and cosolvent concentration on the drug loading and release property of the microparticles prepared with and without cosolvent were investigated. The in vitro drug release kinetics of drug-loaded microparticles was studied with five models. The results indicated that the morphology of the drug-loaded polymer microparticles was not influenced by the SSI process. And the addition of ethanol cosolvent could significantly improve the drug loading of the microparticles. The most satisfied drug loading and the release properties of the microparticles were achieved under 55 °C, 13 MPa and cosolvent ethanol concentration of 3%. The drug could be released for more than 140 h. The analysis of the drug release kinetics showed that the experimental data fitted with Ritger–Peppas model were optimal. According to the release exponent value, the in vitro release process of the nitrendipine-loaded microparticles was controlled by Fickian diffusion, which can provides a theoretical basis for drug release of this type of experiment.
In this work, drug-loaded polymer microparticles were prepared by a supercritical solution impregnation (SSI) process with nitrendipine as the model drug and PLLA–PEG–PLLA as the drug carrier.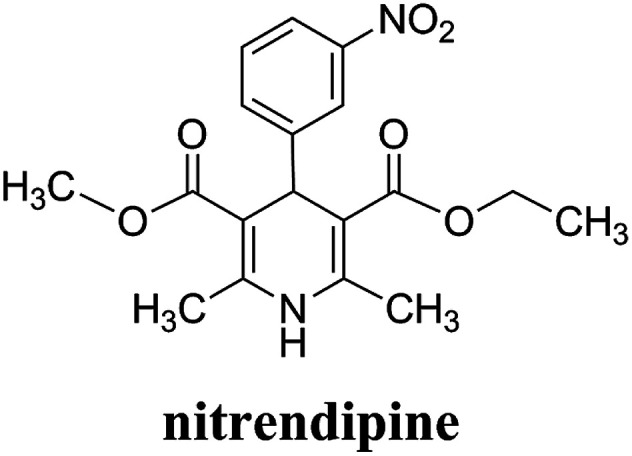
1. Introduction
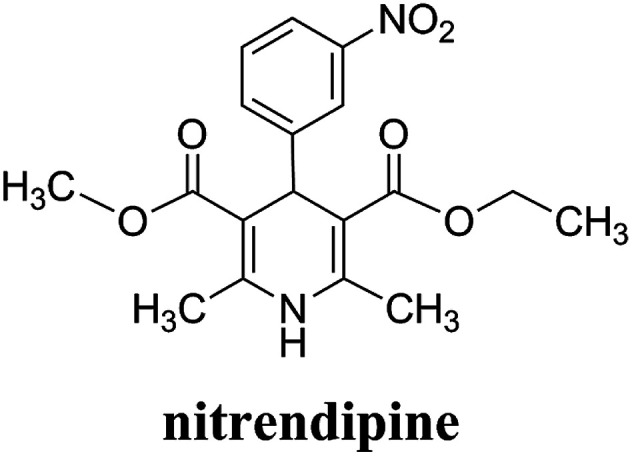
Nitrendipine (NTR) is a calcium channel blocker belonging to the dihydropyridine class of compounds, and it can relax blood vessels and decrease the heart's pumping strength.1 It has similar effects on blood pressure and heart rate as nifedipine, and can also significantly reduce myocardial oxygen consumption and ameliorate myocardial ischemia at the same time. Fig. 1 shows the molecular structure of nitrendipine. However, nimodipine is a poorly water-soluble drug. The solubility of the drug at room temperature in the water is only 2.2 μg ml−1, and the utilization rate of the conventional preparation of the drug is very low. The preparations of the general sale display low oral bioavailability and large drug concentration fluctuation, so that the frequent administration is needed. After the drug was encapsulated with biodegradable polymer particles, the drug in the drug-loaded polymer microparticles could be released slowly with the degradation and swelling of the polymer at the specified site, which ensure the continuous therapeutic effect of the drug, reduce the frequency of drug administration, and improve the utilization rate of the drug.
Fig. 1. Chemical structure of nitrendipine.
With the rapid development of life sciences in recent years, the control-released drug delivery system in the field of modern pharmaceutics has become more and more important and urgent.2 The system based on biodegradable microparticles has been received much attention, especially the biodegradable drug-loaded polymer microparticles have attracted growing interest because of their potential application in medicine and pharmacy due to the advantages of sustained release, high bioavailability and low side effects. When nitrendipine is prepared into sustained-release formulations, its dose and frequency of administration, as well as side effects could be reduced.
The traditional processes for preparing the biodegradable drug-loaded polymer microparticles generally suffer either from high processing temperatures, which can deteriorate thermosensitive drugs, or from the use of organic solvents, which must be removed through numerous purification steps to meet FDA's requirements. In order to tackle these two recurrent drawbacks, the supercritical CO2 (ScCO2) process has been developed and got more and more attention.3–5 ScCO2 is inexpensive and environment friendly, and has low critical coordinates, which allows to process thermosensitive drugs and makes the products separated from CO2 by simply depressurization, so that the cost for the products purification can be reduced.6–8
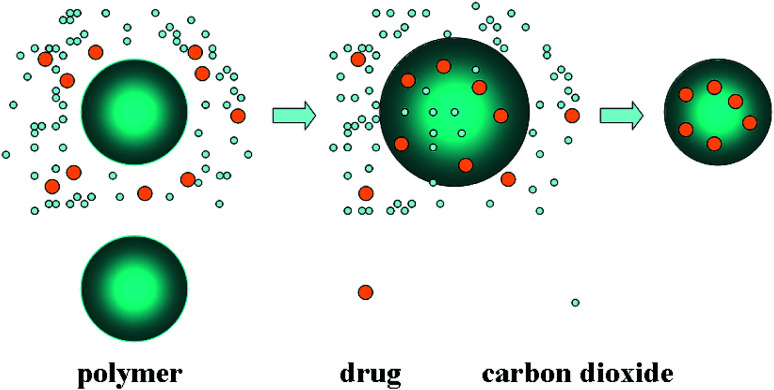
In recent years, supercritical fluid has been proved to be an alternative green process for pharmacy and pharmaceutics.9,10 Drugs could also be impregnated into polymer matrices by dissolving them in supercritical fluid (usually ScCO2), in which the binary mixture of drug and ScCO2 could facilitate the mass transfer in the drug loading process. After depressurization, the drug was entrapped in matrices, and finally homogeneous drug-loaded polymer composite would be obtained.11 This process, known as supercritical solution impregnation (SSI), has been reported to be successfully implemented in fabricating several polymer-based drug-loaded formulations. Fig. 2 is the schematic diagram of SSI process. The SSI technology has several advantages over traditional methods. One of them is that the drug loading can easily controlled by adjusting the operating conditions to change the distribution coefficient between the polymer phase and supercritical fluid phase. In addition, it is suitable for both the preparation of water-soluble and lipid-soluble drug-loaded microparticles. The morphology of drug-loaded microparticles could be determined by the morphology of polymer matrix, and the SSI process has no effect on it, so that the morphology and drug loading can be very well controlled separately.
Fig. 2. Schematic diagram of immersion drug process.
Due to the advantages of SSI process, many researchers had carried out a lot of work in this field by using the process of SSI to prepare the drug-loaded polymer microparticles. Meanwhile, the drug release properties of drug-loaded microparticles were also extensively studied. Bao et al.12 prepared avermectin-loaded porous hollow silica microparticles by using SSI process. The effects of various cosolvents on the drug loading were investigated. It was found that more drug could be loaded into the microparticles if a cosolvent with stronger polarity was used, which was mainly due to the effect of the cosolvent on the interaction between the solute and the solvent molecules.13 And the drug loading was also affected by the cosolvent viscosity, because it was not conducive to the diffusion of the drug into the polymer matrix when the viscosity of cosolvent was relatively large. In addition, an appropriate amount of cosolvent was required to achieve the maximum drug loading. Giufrida et al.14 studied the synthesis of microparticles based on poly(3-hydroxybutyrate-co-3-hydroxyvalerate) (PHBV) polymer that were impregnated with progesterone. The PHBV microparticles were obtained by ScCO2 anti-solvent expansion. ScCO2 was also used at a high pressure (25 MPa) and moderate temperature (323 K) for the impregnation of progesterone into the PHBV microparticles at different impregnation times. In vitro release tests showed that the half-time of progesterone release in a hydro-alcoholic medium, for the samples produced with impregnation times of 2–32 h, was 3–5 h. Costaa et al.15 impregnated successfully acetazolamide and timolol maleate into silicone-based hydrogel contact lenses by SSI process. The effects of temperature, pressure, impregnation time, release rate, cosolvent type and other factors on the impregnation efficiencies and the properties of the contact lenses were studied. Glass transition temperature, oxygen permeability, contact angle, apparent morphological changes and in vitro drug release kinetics were studied in detail. The results demonstrated the feasibility of preparing acetazolamide and timolol maleate impregnated contact lenses using CO2 + EtOH and CO2 + H2O solvent mixtures. Ji et al.16 prepared successfully the stable formulations of poorly water-soluble anticancer drugs such as camptothecin and griseofulvin into a chitosan matrix by SSI process. The amount of drug impregnated was measured by UV spectrophotometry and gravimetric techniques. Pore characteristics and the crystallinity of the drugs in the impregnated chitosan were measured. The results measured showed that both camptothecin and griseofulvin were in amorphous forms after processed. The dissolution rate of griseofulvin processed was increased due to the hydrophilic properties of chitosan and its interaction with the drug. Üzer et al.17 prepared the sustained and controlled release drugs composite with PMMA as the carrier under 8–15 MPa and 35–45 °C by SSI process. The effects of temperature and pressure on the swelling and permeability of system were studied. Swelling experiments resulted in 9–25% volume expansion in ScCO2. The effect of pressure and temperature on the extent of volume increase was directly related to the solvent density, for both swelling and impregnation. The extent of swelling and the amount of solute impregnated increased with the increase of pressure and temperature. López-Periago research group18 prepared triflusal-loaded PMMA composite with PMMA as the carrier by SSI process. The additives were impregnated into nonporous polymeric substrates. Chemical and H-bonding interactions between the matrix and the infused drug were evaluated together with the impregnated drug stability. The results showed that the samples impregnated had an excellent potential for the preparation of pharmaceutical formulations. The delivery profiles obtained were consistent with keeping stable levels of the drug dissolved over a long period of time, reducing the number of administrations and avoiding the initial sharp increase in drug concentration. Unagolla et al.19 prepared chitosan–alginate polyelectrolyte microparticles containing the antibiotic, vancomycin chloride by using the ionotropic gelation (coacervation) technique. In vitro release and drug transport mechanisms were studied. According to the in vitro release data, alginate only and chitosan only microparticles showed burst release and prolonged release respectively. Chitosan–alginate lyophilized microparticles showed the best-controlled release of vancomycin with the average release of 22 μg per day for 14 days. The best fit was observed with Peppas–Sahlin model, indicating that the drug transport mechanism was controlled by both Fickian diffusion and Case II relaxations.
In this work, the drug-loaded polymer microparticles were prepared by supercritical solution impregnation (SSI) process with hydrophobic nitrendipine (NTR) as model drug and PLLA–PEG–PLLA as the amphiphilic polymer matrix. The morphology, microparticle size and distribution and functional groups of drug-loaded microparticles were characterized respectively. The effects of operating conditions such as temperature and pressure on the drug loading efficiency and the physical properties of the drug-loaded microparticles prepared with and without cosolvent were investigated. The drug loading and release property of the microparticles prepared with and without cosolvent were estimated. In vitro drug release kinetics of drug-loaded microparticles was studied with five models. The fitting results of Ritger and Peppas model were the best, and the drug release type belonged to Fickian diffusion, which can provides a theoretical basis for drug release of this type of experiment.
2. Experimental
2.1. Materials
Nitrendipine (CAS 39562-70-4, 99%) was purchased from Alpenglow Chemical Industrial Co.,Ltd (Jinan, China). PLLA–PEG–PLLA (90PLLA : 10PEG wt%, 40 kDa) was synthesized by our research team. Carbon dioxide (99.9%) was purchased from the Credit Co. (Dalian, China). Ethanol (99.5%) was obtained from Tianjin Damao Chemical Reagent Factory (Tianjin, China). Phosphate buffer saline (PBS) particles (pH 6.86) used as the drug release medium were obtained from Shanghai Hongbei Chemical Reagent Factory (Shanghai, China). All the materials were used as received.
2.2. Microparticles characterization
The structure of drug-loaded microparticles was determined by a fourier transform infrared (FT-IR) spectrometer (Nicolet 560, America). Scanning electron microscopy (SEM; QUANTA-450, FEI, America) was used for the observation of the morphology of nitrendipine-loaded PLLA–PEG–PLLA microparticles. The size distribution of nitrendipine-loaded PLLA–PEG–PLLA microparticles was determined by using the laser particle size analyzer (LPSA, BT-9300H, Dandong Bettersize Instruments co., Ltd, Dandong, China).
2.3. Fabrication of drug-loaded microparticles
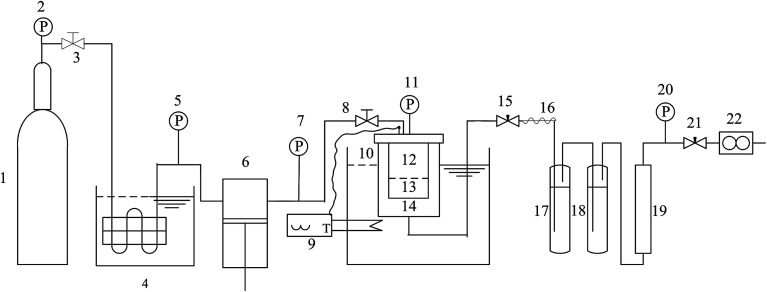
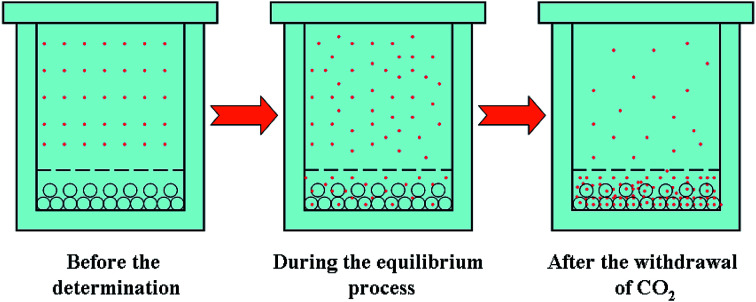
The experimental apparatus for SSI process is shown in Fig. 3. It mainly consisted of four parts: CO2 supply and pressurization system, the equilibrium autoclave system, temperature control system and depressurized system. Among the four systems, the equilibrium autoclave system was the most important part. The equilibrium autoclave with a volume of 500 ml was consisted of a polymer-loaded vessel and drug-loaded vessel. A 5-layer-sintered wire mesh (SWM) with the precision of 20 μm was located at the bottom of drug-loading vessel to separate the drug particles, polymer particles and gas–solid mixtures effectively. The measurement errors of the experimental apparatus for the temperature and the pressure were ±0.1 K and ±0.1 MPa respectively. Fig. 4 is the principle schematic drawing that illustrates the SSI process.
Fig. 3. Schematic drawing of the experimental apparatus for SSI process. 1-CO2 cylinder; 2, 5, 7, 11, 20-pressure gauge; 3, 8-stop valves; 4-cooler; 6-plunger pump; 9-temperature controller; 10-thermoelement; 12-drug-loading vessel; 13-polymer-loading vessel; 14-high pressure vessel; 15, 21-fine tuning valve; 16-heater band; 17-primary absorber; 18-two stage absorber; 19-silica gel desiccator; 22-mass flowmeter.
Fig. 4. Schematic drawing for illustrating the SSI process.
Firstly, the polymer microparticles (0.05–0.08 g) were loaded in the polymer-loaded vessel, and the packed nitrendipine drug (1 g, excess) mixed with glass beads and glass cotton were regularly tiled in drug-loaded vessel, which could effectively guarantee the smooth passing of CO2. While in the presence of cosolvent, a certain quantity of cosolvent would be placed in the bottom of this equilibrium autoclave in advance. After the autoclave with drug and polymer was sealed well and preheated to a certain temperature, the cooled CO2 was pumped into the equilibrium autoclave by a plunger metering pump. The inlet valve should keep open until the temperature and pressure had reached to the set condition. Then the drug microparticles could establish the dissolution equilibrium between ScCO2 and polymer over enough time (2 h). Finally, the fine tuning valve was opened, and the autoclave was depressurized slowly. The microparticles of drug impregnated in the polymer-loaded vessel were collected carefully and the wet microparticles (when the cosolvent was used) should be dried in a vacuum drying box.
2.4. Determination of drug content in the microparticles
The content of nitrendipine in the drug-loaded microparticles were detected by UV-visible spectroscopy (UNICO, model UV-2100, USA), using phosphate buffer solution (PBS) as the release medium. Nitrendipine (10 mg) was dissolved in 0.1 mol l−1 PBS (pH 6.86) and diluted to 500 ml. 2.0, 3.0, 4.0, 5.0 and 6.0 ml solution were used and diluted to 10 ml, respectively. The absorbance frequency was measured at 236 nm by UV-vis spectra and a standard curve was painted.
2.5. In vitro release kinetics of drug
The drug loading of the samples was measured by UV spectrophotometry, and the in vitro release properties of the drug were observed by the dialysis using a shaking incubator (SHZ-82; FeiPu Experimental Instrument Factory, Changzhou, China) under 37 °C and atmospheric pressure.
To study the nitrendipine release mechanism from the different of the cosolvent concentration, five kinetic models were considered to fit the experimental data. These models included that the zero order drug delivery model (mt/m∞ = kt), the first order drug delivery model (mt/m∞ = 1 − exp(−kt)), Higuchi model20 (mt/m∞ = kt1/2), Peppas–Sahlin model21 (mt/m∞ = k1tn + k2t2n) and Ritger–Peppas model22 (mt/m∞ = k1tn). In these equations, mt/m∞ is the percentage of drug release at time t, k is the kinetic constant and n is the diffusion exponent.
3. Results and discussion
3.1. Morphology and size distribution of drug-loaded microparticles
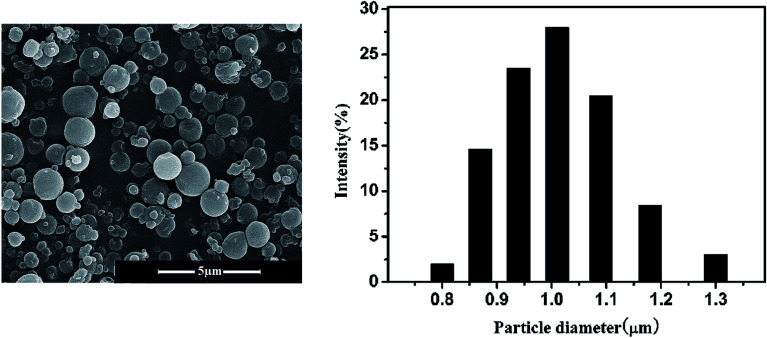
Fig. 5 shows the SEM photographs and the particle size distribution of the nitrendipine-loaded microparticles prepared by SSI process. The preparation conditions were 55 °C, 13 MPa and the cosolvent ethanol fraction of 3% (mol). By comparing with the electron microscopy and particle size of the polymer black particles prepared by supercritical antisolvent process (SAS),23 it can be seen that the morphology and particle size of the drug-loaded microparticles by the SSI process were almost unchanged, which meant that the SSI process could be applied to prepare the drug-loaded microparticles and maintains the original morphology of microparticles. SAS and SSI process could be conducted respectively, which was beneficial to control the particle size and drug loading. And the addition of the cosolvent did not affect the basic morphology and particle size of the microparticles. Form Fig. 5, it can be seen that the size distribution of the drug-loaded microspheres was relatively uniform and the particle diameter was approximately 1 μm. It was closed to the result of the electron microscope observed.
Fig. 5. SEM image and PSD of drug-loaded microparticles prepared by SSI process.
3.2. Structure of drug-loaded microparticles
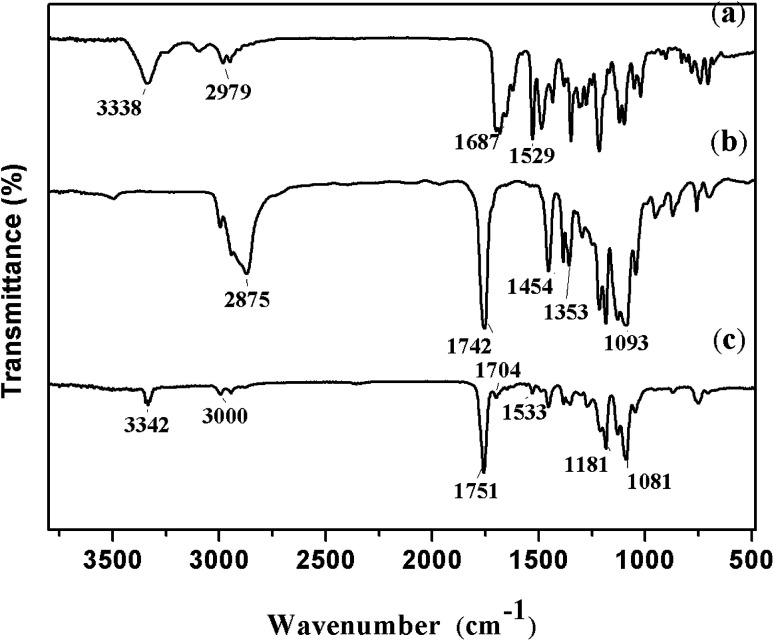
The FTIR spectra of nitrendipine, blank polymer microparticles and nitrendipine-loaded polymer microparticles are shown in Fig. 6. In the spectrum of nitrendipine (Fig. 6a), the characteristic peaks at 1687 cm−1 and 1529 cm−1 were attributed to stretching vibration of C O and C–N groups. They shifted to 1704 cm−1 and 1533 cm−1 in the spectrum of nitrendipine-loaded microparticles (Fig. 6c). And the peak at 3338 cm−1 (Fig. 6a) corresponded to N–H stretching vibrations of nifedipine, and it was consistent with the position of the peaks in Fig. 6c. The above evidences indicated substantially that the drug was been loaded into the polymer microparticles. From Fig. 6b, it can be seen that the characteristic peaks at 2876 cm−1, 1742 cm−1 and 1186–1093 cm−1 were attributed to stretching vibration of C–H, C O and C–O–C groups, respectively, and the peaks were basically consistent with the position of the peaks in Fig. 6c, which showed that the chemical structure of microparticles carrier after the drug-loaded was basically unchanged.
Fig. 6. FTIR spectras of nitrendipine-loaded microparticles: (a) nitrendipine, (b) polymer blank microparticles and (c) nitrendipine-loaded microparticles.
3.3. Drug loading without cosolvent
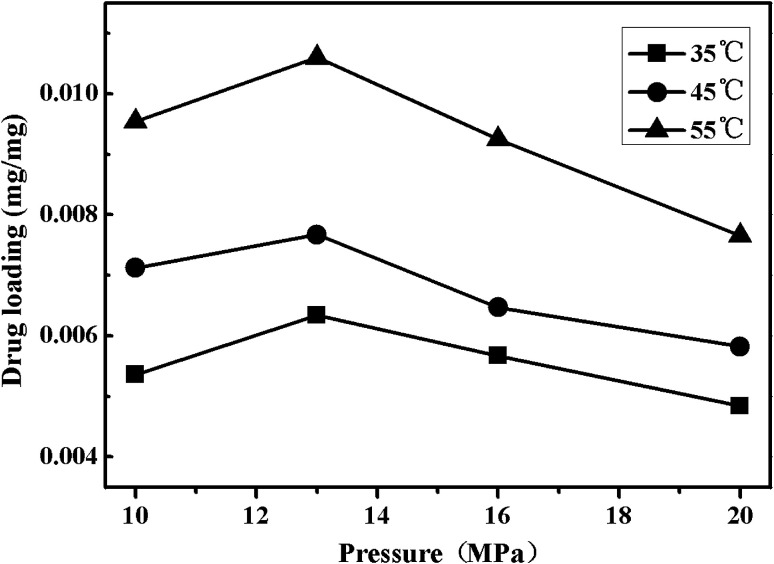
Fig. 7 shows the effects of the temperature and pressure on drug loading of nitrendipine in polymer matrix. As displayed in Fig. 7, the drug loading increased with the increase of temperature. This could be explained from two aspects. First, the swelling of polymers was in favor of the nitrendipin penetration into polymer matrix and the more swelling degree, the more permeation quantity of the drug. Moreover, the swelling degree of the polymer in ScCO2 increased with the increase of temperature, so the increase of temperature under given conditions was beneficial for the increase of drug loading.24 And the drug molecules could show the relatively stronger diffusion ability with the increase of temperature,25 so more drug molecules could be loaded into the polymer matrix, which would eventually lead to the increase of drug loading.
Fig. 7. Effects of pressure on drug loading under different temperatures.
The effect of pressure on drug loading of nitrendipine was more complicated. It can be seen clearly form Fig. 7 that with the increase of pressure under isotherm conditions, the drug loading of microparticles appeared to increase at first and then decrease gradually after reaching its peak value (at about 13 MPa). This was because that both the swelling of polymers and the solubility of drugs in ScCO2 had effects on drug loading. At first, the two factors both showed a tendency of increase with the increase of the pressure, which could enhance the partition coefficient of the drug in polymer phase, so the drug loading increased with the increase of the pressure. When the pressure reached to a certain degree, the changes of polymers swelling was not obvious, while the solubility of drugs in ScCO2 was continuously increase with the pressure, which led to a decrease of partition coefficient of the drug in polymer phase.26,27
3.4. Accumulated drug release rates without cosolvent
Generally, drug loading of the polymeric microparticles contained three parts: firstly, the drug in the high pressure vessel was crystallized out and adsorbed on the surface of the polymeric matrix in the process of depressurization; secondly, the drug located in polymer was formed into microcrystalline during the process of depressurization; thirdly, the drug molecules permeated into the polymer matrix were adsorbed on the surface of the polymer molecules by the intermolecular forces. In the process of drug release, the first part was often represented by sudden-release, while the other two parts were represented by sustained-release, which resulted two different releasing patterns: the molecule diffusion pattern and the sustained-release pattern.28
3.4.1. Effect of pressure on accumulated drug release rates
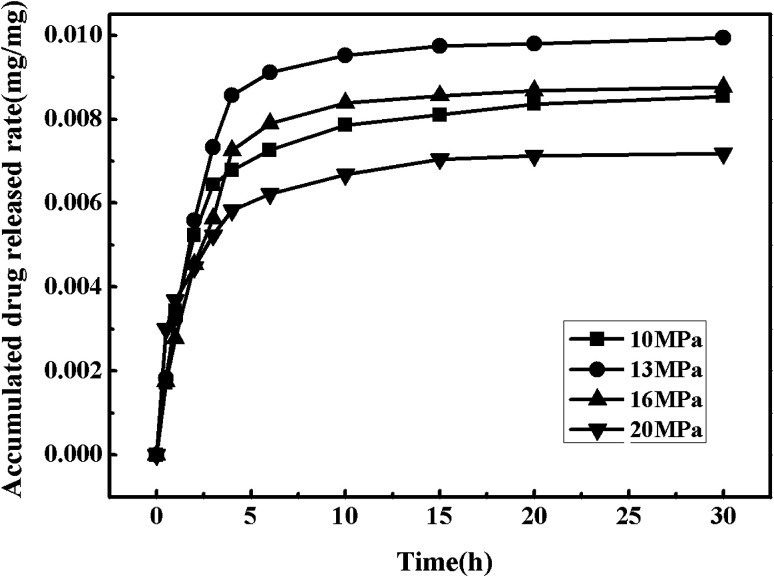
Fig. 8 shows the drug release curves of the drug-loaded microparticles prepared under the temperature of 55 °C and various pressures (10 MPa, 13 MPa, 16 MPa and 20 MPa). The drug release rate reached to about 20% after an hour, which mainly showed the phenomenon of sudden release, and the phenomenon tended to be more obvious for the drug-loaded microparticles which were prepared at 20 MPa. This relatively short time of drug release was probably caused by the weak interactions between polymer molecules and drug molecules which could eventually lead to the loose binding forces. After about 30 h, the drug release rate was basically unchanged and the drug release rate all reached over 90%.
Fig. 8. Drug release curves of the drug-loaded microparticles under different pressure.
3.4.2. Effect of temperature on accumulated drug release rates
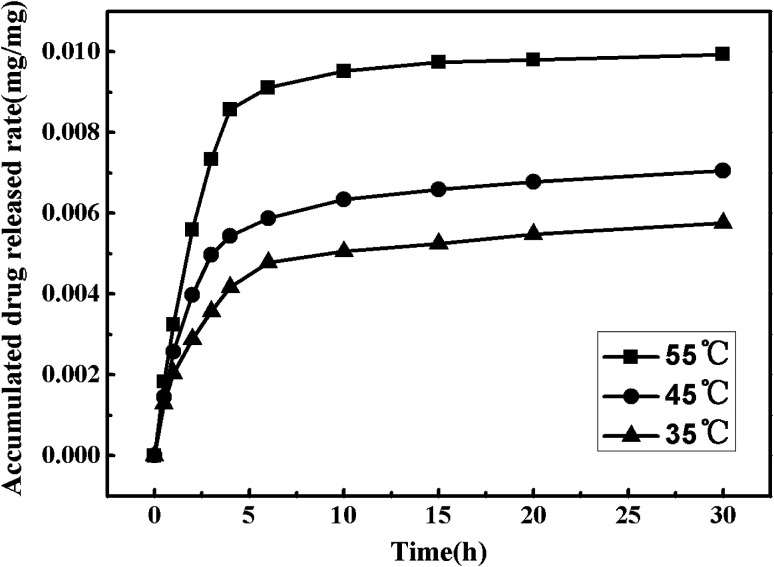
In order to explore the effects of the temperature on the nitrendipine accumulated drug release rates without cosolvent, the pressure was fixed at 13 MPa and the temperature was set at 35 °C, 45 °C and 55 °C respectively. Fig. 9 shows the drug release curves of the drug-loaded microparticles prepared under different conditions. It can be seen that the nitrendipine release rate showed an increasing trend with increase of temperature. When the temperature increased to 55 °C, the drug showed a good release performance with a relatively large drug loading, while the microparticles prepared without cosolvent all showed poor drug loading and release performance, which severely limited their biomedical applications.
Fig. 9. Drug release curves of the drug-loaded microparticles under different temperature.
3.5. Drug loading with cosolvent
Nitrendipine belongs to polar material, while ScCO2 is a nonpolar solvent, so there is a weak interaction between the solute and solvent, which results in a relatively low solubility of nitrendipine in ScCO2 and low drug loading. Therefore, it is necessary to improve the drug solubility, and thus improve its productivity and quality. Generally, through the addition of small amounts of polar cosolvents to nonpolar ScCO2, a higher polarity mixed supercritical solvent is created, and the solubility of polar solutes in the mixed solvent is higher than that in pure nonpolar ScCO2.27,29,30 This is mainly because the addition of polar cosolvents could arouse specific interactions such as hydrogen bonding between the solute and cosolvent molecules, resulting in larger enhancement of solubility.31 In this work, ethanol was chosen as cosolvent because of its low cost, nontoxicity and polarity.
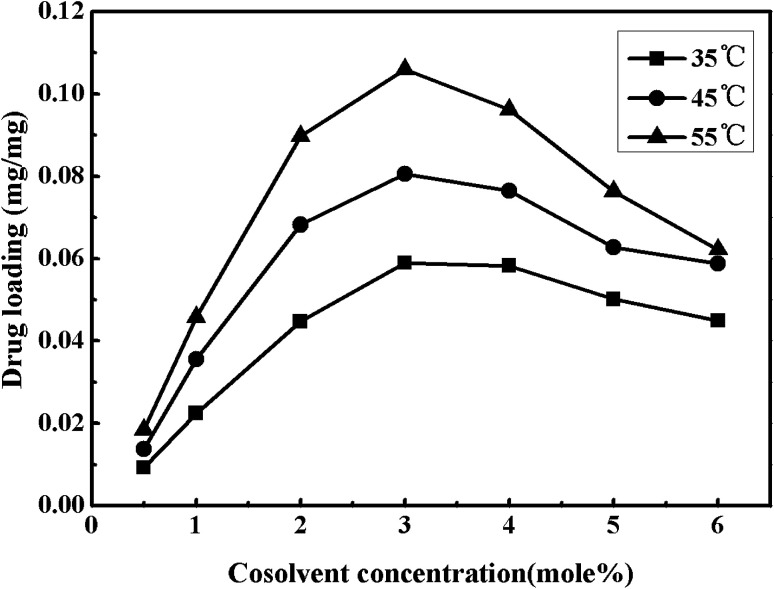
Fig. 10 shows the cosolvent concentration effects on impregnation efficiency of nitrendipine in polymer microparticles prepared under a fixed pressure of 13 MPa and the different temperatures (35–55 °C). As seen in Fig. 10, the drug loading increased first and then decreased with the increase of cosolvent concentration, and when the cosolvent concentration was 3% (mol), the drug loading reached a maximum (0.105 mg mg−1). This trend was also found in the impregnation efficiency of nitrendipine in polymer matrix with the change of nitrendipine solubility in mixed SCF. With the increase of cosolvent concentration from 0.5% up to 3%, the addition of cosolvent could effectively improve the drug solubility. Consequently, there would be a relatively large partition coefficient in polymer phase and ScCO2 phase, and the efficiency of impregnation was improved eventually.32 However, the drug loading did not proportionally increase with the sustained increase of the cosolvent concentration. On the contrary, it decreased with the increase of cosolvent concentration from 4% to 6%. The most likely reason was that the continuously increasing cosolvent concentration could result in the enhancement of intermolecular forces between drug molecules and mixed ScCO2, and decrease the amount of drug molecules into polymer phase. From above discussions, it could be concluded that the drug loading was not only influenced by the solubility of the drug in ScCO2, but also by the partition coefficients of the drug in the polymeric phase and the fluid phase.33,34
Fig. 10. Effects of cosolvent concentration on drug loading under different temperatures.
3.6. Accumulated drug release rates with cosolvent
3.6.1. Effect of cosolvent concentration on accumulated drug release rates
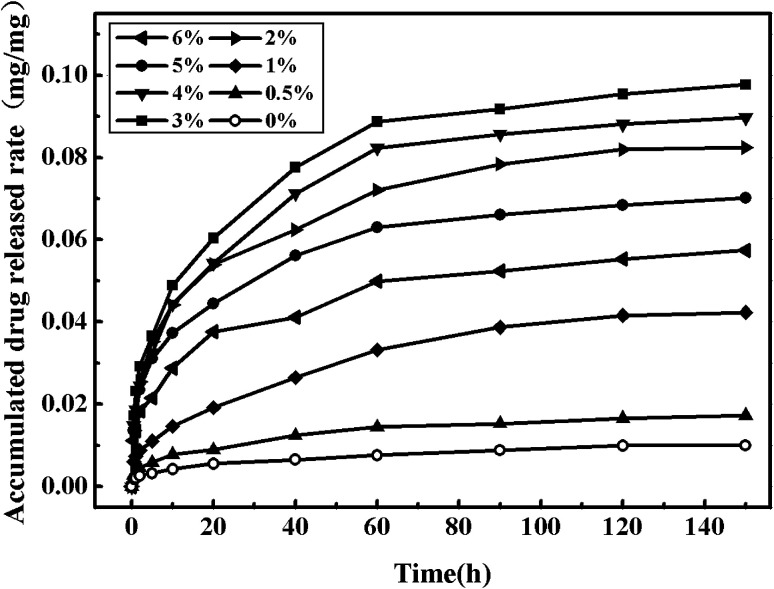
Fig. 11 shows the nitrendipine release curves from polymer microparticles under 55 °C and 13 MPa with different cosolvent concentrations. It can be seen that the addition of ethanol cosolvent could significantly improve the drug loading, as well as the release time. Actually, the preparation process of drug-loaded microparticles with or without cosolvent had a significant effect on drug release rates from the in vitro release experiments. The microparticles without cosolvent showed much higher initial release rates than the one with cosolvent, resulting in that the accumulated drug release rates of the microparticles without cosolvent had passed 50% after 2 h during the in vitro release experiments, while the condition could be well managed when the cosolvent was added. Compared with the accumulated drug release rates of drug-loaded microparticles prepared without cosolvent, the accumulated drug release rates of the microparticles with cosolvent had been basically unchanged after 150 h, which was much longer than the release time without cosolvent. The main reason was that the addition of cosolvent ethanol could increase the interaction between the drug and the polymer, which made the drug release rates slow down. It can be seen from Fig. 11 that by adding the cosolvent of 3%, the accumulated drug release rates was the maximal.
Fig. 11. Drug release curves of the drug-loaded microparticles under different cosolvent concentration.
3.6.2. Effect of pressure on accumulated drug release rates
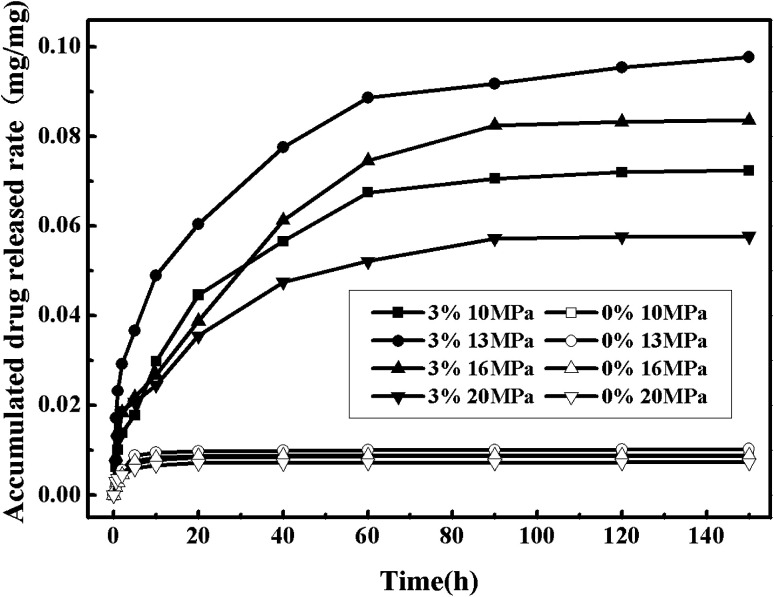
Fig. 12 shows the nitrendipine release curves from polymer microparticles under different pressures (the other conditions being fixed at the temperature of 55 °C and the cosolvent concentration of 3%). It can be seen that the accumulated drug release rates changed more evidently with the increase of pressure in the case with the cosolvent than that without cosolvent. The pressure had two contrary effects on the accumulated drug release rates. On one hand, it was favorable for the impregnation process that the drug loading and the accumulated drug release rates both increased with the increase of pressure within a certain range. This was because that the polymer swelling could increase with the increasing of pressure, which allowed more drugs to diffuse into the polymer matrix. In addition, the increase of pressure resulted in the increase of the solute solubility, and it would be expected that some reasonable amount of drug could be loaded into polymer matrix. However, on the other hand, the constantly rising pressure had a certain impact on the accumulated drug release rates, which could be observed in Fig. 12 and well explained with partition coefficient. The polarity of ScCO2 could be effectively adjusted by adding cosolvent, resulting in a higher solubility of drug in mixed ScCO2, and when interaction between drug and ScCO2 phase was stronger than interaction between drug and polymer phase, there would be more drugs choosing to stay in ScCO2,35 so a proper pressure was another critical factor to the drug release rates. The most suitable pressure for this experiment was 13 MPa.
Fig. 12. Drug release curves of the drug-loaded microparticles under different cosolvent concentration and different pressure.
3.6.3. Effect of temperature on accumulated drug release rates
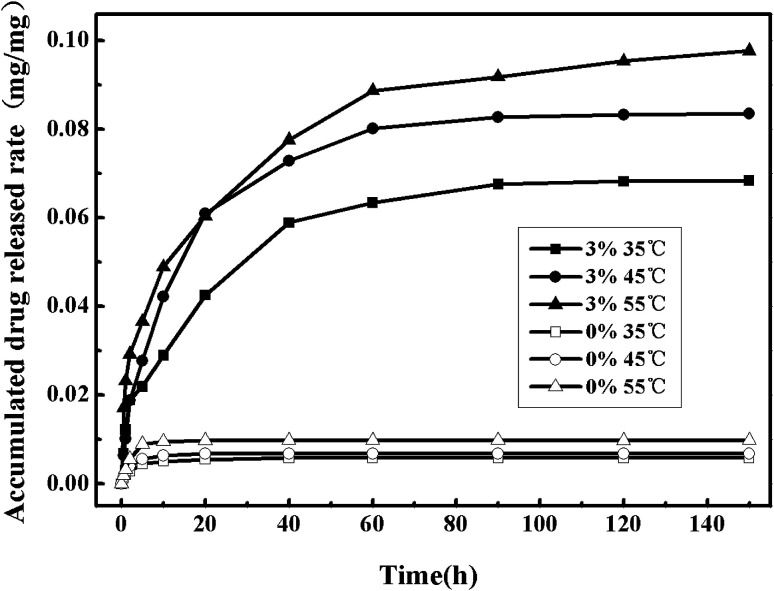
Fig. 13 shows the nitrendipine release curves from polymer microparticles under different temperatures (the other conditions being fixed at the pressure of 13 MPa and the cosolvent concentration of 3%). It can be seen that when ethanol cosolvent was not added, it did not appear to have much difference of the accumulated drug release rates under different temperatures, and in the case with cosolvent there was a significantly higher accumulated drug release rates than that without cosolvent. Similarly to the effect of temperature on drug release rates in the case without cosolvent, the accumulated drug release rates increased with the increase of temperature. However, in order to keep the drug stability, the operation temperature should not select too high.36
Fig. 13. Drug release curves of the drug-loaded microparticles under different cosolvent concentration and different temperature.
3.7. Drug release kinetics of drug-loaded microparticles
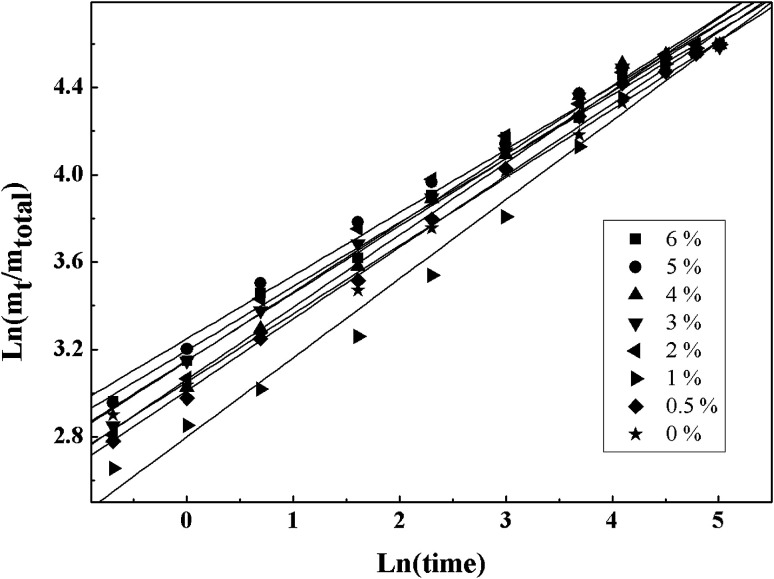
The parameters values obtained by fitting experimental data from the different of the cosolvent concentration with five different kinetics models are shown in Table 1. According to Table 1, it can be found that Ritger–Peppas model was the best fitting model for the experimental data of each sample type by comparing the correlation coefficient (R2). Higuchi model was a relatively simple model and often used in swellable polymer systems. The difference between the Ritger–Peppas model and the Higuchi model was the exponent (n), so the application scope of the Higuchi model was not as extensive as that of the Ritger–Peppas model. Peppas–Sahlin model took into account the effects of Fickian diffusion (item 1) and Case II transport (item 2) at the same time. From Table 1k2 was much smaller than k1, which meant that the release was mainly controlled by Fickian diffusion. The fitting errors of zero-order model and first-order model were larger because both were mainly applicable to the reservoir type drug delivery system.
Results of fitting the experimental data with five kinetic models.
| C/mol% | Zero-order | First-order | Higuchi | Peppas–Sahlin | Ritger and Peppas | ||||||||
|---|---|---|---|---|---|---|---|---|---|---|---|---|---|
| k | R 2 | k | R 2 | k | R 2 | n | k 1 | k 2 | R 2 | n | k | R 2 | |
| 6 | 0.38 | 0.79 | 0.20 | 0.81 | 0.11 | 0.52 | 0.35 | 0.33 | −0.03 | 0.94 | 0.29 | 24.4 | 0.99 |
| 5 | 0.40 | 0.75 | 0.23 | 0.81 | 0.12 | 0.43 | 0.36 | 0.35 | −0.03 | 0.95 | 0.29 | 25.7 | 0.98 |
| 4 | 0.36 | 0.77 | 0.15 | 0.87 | 0.12 | 0.63 | 0.41 | 0.29 | −0.02 | 0.97 | 0.33 | 21.4 | 0.99 |
| 3 | 0.38 | 0.75 | 0.12 | 0.86 | 0.12 | 0.55 | 0.39 | 0.32 | −0.03 | 0.96 | 0.31 | 23.3 | 0.99 |
| 2 | 0.39 | 0.75 | 0.22 | 0.85 | 0.12 | 0.52 | 0.37 | 0.34 | −0.03 | 0.96 | 0.32 | 23.3 | 0.98 |
| 1 | 0.12 | 0.88 | 0.07 | 0.87 | 0.11 | 0.86 | 0.42 | 0.20 | −0.01 | 0.96 | 0.36 | 16.4 | 0.98 |
| 0.5 | 0.32 | 0.83 | 0.12 | 0.84 | 0.11 | 0.71 | 0.38 | 0.27 | −0.02 | 0.96 | 0.33 | 20.3 | 0.99 |
| 0 | 0.32 | 0.87 | 0.12 | 0.81 | 0.11 | 0.73 | 0.35 | 0.28 | −0.02 | 0.95 | 0.31 | 21.1 | 0.99 |
The Ritger–Peppas model was usually applied to the matrix type drug delivery system in which the mechanisms of sustained release were often relatively complicated (such as diffusion, swelling and corrosion).37 For the delivery system of the monodisperse spherical microparticles, when the diffusion exponent (n) was equal to 0.43, the drug release mechanism was the Fickian diffusion. When the diffusion exponent (n) was equal to 0.85, the drug release mechanism was completely Case II transport. When value of n was between 0.43 and 0.85, anomalous (non-Fickian) transport was observed for a monodisperse system. However, for a polydispersed spherical system, the values were 0.30 and 0.45, respectively.38
Fig. 9 illustrates the line regressions results fitted with the Ritger–Peppas model by using the least-squares method. As shown in Fig. 14, R2 obtained from the fitting experimental data with this model were all greater than 0.98 under the experiment conditions and the diffusion exponent (n) were all around 0.30. Because the test samples belonged to a polydispersed system, the release type was considered as Fickian release behavior.
Fig. 14. Linear regressions of fitting the experimental data with Ritger–Peppas model.
4. Conclusions
In this work, the drug-loaded polymer microparticles were prepared by supercritical solution impregnation (SSI) process with nitrendipine as model drug and PLLA–PEG–PLLA as the polymer matrix. The drug loading and release rate of the microparticles prepared with and without cosolvent were studied. The results indicated that the addition of ethanol cosolvent could significantly improve the drug loading of microparticles, in addition, the drug loading of microparticles appeared to increase at first and then decrease gradually after reaching its peak value with the increase of cosolvent concentration. When ethanol with the mole fraction of 3% was added into ScCO2, the drug loading reached a maximum (0.105 mg mg−1). When a poorly water-soluble nitrendipine was impregnated into the amphipathic polymer matrix in ScCO2, the drug loading and the release rate of the drug-loaded polymer microparticles increased significantly under the function of cosolvent. The release kinetics of drug-loaded polymer microparticles was studied. Five release models were used to fit the experimental data with the different cosolvent concentration. The fitting results of Ritger and Peppas model were the best, and the drug release type belonged to Fickian diffusion.
Conflicts of interest
There are no conflicts to declare.
Supplementary Material
Acknowledgments
The authors acknowledge the funding provided by the Natural Science foundation of China (Project 21676038).
References
- Weinstein R. D. Hanlon W. H. Donohue J. P. Simeone M. Rozich A. Muske K. R. J. Chem. Eng. Data. 2007;52:256–260. doi: 10.1021/je0603729. [DOI] [Google Scholar]
- Yuan Y. Choi K. Choi S. Kim J. RSC Adv. 2018;8:19791–19803. doi: 10.1039/C8RA01467A. [DOI] [PMC free article] [PubMed] [Google Scholar]
- Guamán-Balcázar M. C. Montes A. Pereyra C. Martínez de la Ossa E. J. Supercrit. Fluids. 2019;143:294–304. doi: 10.1016/j.supflu.2018.09.007. [DOI] [Google Scholar]
- Cabezas L. I. Fernández V. Mazarro R. J. Supercrit. Fluids. 2012;63:155–160. doi: 10.1016/j.supflu.2011.12.002. [DOI] [Google Scholar]
- Marizza P. Keller S. S. Müllertz A. Boisena A. J. Controlled Release. 2014;173:1–9. doi: 10.1016/j.jconrel.2013.09.022. [DOI] [PubMed] [Google Scholar]
- Badens E. Masmoudi Y. Mouahid A. Crampon C. J. Supercrit. Fluids. 2018;134:274–283. doi: 10.1016/j.supflu.2017.12.038. [DOI] [Google Scholar]
- Perko T. Ravber M. Knez Z. Skerget M. J. Supercrit. Fluids. 2015;103:48–54. doi: 10.1016/j.supflu.2015.04.023. [DOI] [Google Scholar]
- Marcelo G. Ferreira I. C. Viveiros R. Casimiro T. Int. J. Pharm. 2018;542:125–131. doi: 10.1016/j.ijpharm.2018.03.010. [DOI] [PubMed] [Google Scholar]
- Aquinoa R. P. Auriemmaa G. Mencherinia T. Russoa P. Portaa A. Int. J. Pharm. 2013;440:188–194. doi: 10.1016/j.ijpharm.2012.07.074. [DOI] [PubMed] [Google Scholar]
- Braga M. E. M. Pato M. T. V. Silva H. S. R. Ferreira E. I. Gil M. H. Duarte C. M. M. Sousa H. C. J. Supercrit. Fluids. 2008;44:245–257. doi: 10.1016/j.supflu.2007.10.002. [DOI] [Google Scholar]
- Belizón M. Fernández-Ponce M. T. Casas L. Mantell C. Martínez de la Ossa-Fernández E. J. J. CO2 Util. 2018;25:56–67. doi: 10.1016/j.jcou.2018.03.005. [DOI] [Google Scholar]
- Bao C. L. Li X. G. Wei L. X. Chen J. F. J. Beijing Univ. Chem. Technol. 2011;38:1–5. [Google Scholar]
- Li Z. Z. Xu S. A. Wen L. X. J. Controlled Release. 2006;111:81–88. doi: 10.1016/j.jconrel.2005.10.020. [DOI] [PubMed] [Google Scholar]
- Giufrida W. M. Voll F. A. Feihrmann A. C. et al. . Can. J. Chem. Eng. 2016;94:1336–1341. doi: 10.1002/cjce.22511. [DOI] [Google Scholar]
- Costaa V. P. Bragaa M. E. M. Duarte C. M. M. J. Supercrit. Fluids. 2010;53:165–173. doi: 10.1016/j.supflu.2010.02.007. [DOI] [Google Scholar]
- Ji C. D. Barrett A. Int. J. Pharm. 2010;391:187–196. doi: 10.1016/j.ijpharm.2010.03.006. [DOI] [PubMed] [Google Scholar]
- Üzer S. Akman U. Hortaçsu Ö. J. Supercrit. Fluids. 2006;38:119–128. doi: 10.1016/j.supflu.2005.11.005. [DOI] [Google Scholar]
- López-Periago A. Argemí A. Andanson J. M. J. Supercrit. Fluids. 2009;48:56–63. doi: 10.1016/j.supflu.2008.09.015. [DOI] [Google Scholar]
- Unagolla J. M. Jayasuriya A. C. Eur. J. Pharm. Sci. 2018;114:199–209. doi: 10.1016/j.ejps.2017.12.012. [DOI] [PMC free article] [PubMed] [Google Scholar]
- Dredán J. Antal I. Rácz I. Int. J. Pharm. 1996;145:61–64. doi: 10.1016/S0378-5173(96)04725-4. [DOI] [Google Scholar]
- Peppas N. A. Sahlin J. J. Int. J. Pharm. 1989;57:169–172. doi: 10.1016/0378-5173(89)90306-2. [DOI] [Google Scholar]
- Ritger P. L. Peppas N. A. J. Controlled Release. 1987;5:23–36. doi: 10.1016/0168-3659(87)90034-4. [DOI] [Google Scholar]
- Zhan S. P. Cui L. Y. Zhao Q. C. Wang W. J. Chen S. H. Ding S. Q. Part. Sci. Technol. 2013;32:61–69. doi: 10.1080/02726351.2013.804014. [DOI] [Google Scholar]
- Costaa V. P. Bragaa M. E. M. Duarteb C. M. M. Lorenzoc C. A. Concheiroc A. Gil M. H. Sousa H. C. J. Supercrit. Fluids. 2010;53:165–173. doi: 10.1016/j.supflu.2010.02.007. [DOI] [Google Scholar]
- Guan B. Liu Z. Han B. Yan H. J. Supercrit. Fluids. 1999;14:213–218. doi: 10.1016/S0896-8446(98)00121-1. [DOI] [Google Scholar]
- Duarte A. R. C. Simplicio A. L. Vega-González A. Subra-Paternault P. Coimbra P. Gil M. H. de Sousa H. C. Duarte C. M. M. J. Supercrit. Fluids. 2007;42:373–377. doi: 10.1016/j.supflu.2007.01.007. [DOI] [Google Scholar]
- Zhan S. P. Cui L. Y. Zhao Q. C. Chen L. Wang J. C. Chen S. H. Ding S. Q. J. Solution Chem. 2015;44:1–15. doi: 10.1007/s10953-014-0262-4. [DOI] [Google Scholar]
- Guney O. Akgerman A. S. AIChE J. 2002;48:856–866. doi: 10.1002/aic.690480419. [DOI] [Google Scholar]
- Kopcak U. Mohamed R. S. J. Supercrit. Fluids. 2006;34:209–214. doi: 10.1016/j.supflu.2004.11.016. [DOI] [Google Scholar]
- Li J. L. Jin J. S. Zhang Z. T. Wang Y. B. Fluid Phase Equilib. 2011;307:11–15. doi: 10.1016/j.fluid.2011.04.021. [DOI] [Google Scholar]
- Ting S. S. Tomasko D. L. Foster N. R. Acnaughton S. J. Ind. Eng. Chem. Res. 1993;32:1471–1481. doi: 10.1021/ie00019a022. [DOI] [Google Scholar]
- Paolo A. Kikic I. Cortesi A. Fogar A. Moneghini M. J. Supercrit. Fluids. 2003;27:309–315. doi: 10.1016/S0896-8446(02)00267-X. [DOI] [Google Scholar]
- Costaa V. P. Bragaa M. E. M. Duarteb C. M. M. Lorenzoc C. A. Concheiroc A. Gil M. H. Sousa H. C. J. Supercrit. Fluids. 2010;53:165–173. doi: 10.1016/j.supflu.2010.02.007. [DOI] [Google Scholar]
- Kikic I. J. Supercrit. Fluids. 2009;47:458–465. doi: 10.1016/j.supflu.2008.10.016. [DOI] [Google Scholar]
- Duarte A. R. C. Simplicio A. L. Gonzalez A. V. Paternault P. S. Coimbra P. Gil M. H. Sousa H. C. Duarte C. M. M. J. Supercrit. Fluids. 2007;42:373–377. doi: 10.1016/j.supflu.2007.01.007. [DOI] [Google Scholar]
- Yu J. P. Guan Y. X. Yao S. J. Zhu Z. Q. Ind. Eng. Chem. Res. 2011;50:13813–13818. doi: 10.1021/ie201294u. [DOI] [Google Scholar]
- Peppas N. A. Brannon-Peppas L. J. Food Eng. 1994;22:189–210. doi: 10.1016/0260-8774(94)90030-2. [DOI] [Google Scholar]
- Ritger P. L. Peppas N. A. J. Controlled Release. 1987;5:37–42. doi: 10.1016/0168-3659(87)90035-6. [DOI] [Google Scholar]


