

Abstract
Monosomy 7 and del(7q) are among the most common cytogenetic abnormalities in myeloid malignancies, yet their underlying pathogenesis remains unclear. Using an array-based CRISPR screen and orthogonal machine learning approach, we identify potential chromosome 7 tumor suppressor genes (TSGs). We selected candidate TSGs via datamining of genome-scale studies, individually CRISPR-edited 108 candidates, and measured the subsequent impact on the proliferation and erythroid differentiation of primary, human CD34+ hematopoietic stem and progenitor cells (HSPCs). An unexpected 39% of genes increased proliferation when edited, and were significantly enriched in commonly deleted regions. The only two genes that both increased proliferation and decreased erythroid differentiation when edited were the CUX1 transcription factor and ACHE, encoding acetylcholinesterase, both located in the 7q22.1 commonly deleted region. We demonstrate a novel role for ACHE in regulating erythropoiesis through acetylcholine receptor signaling. The defects stemming from loss of ACHE were corrected by a muscarinic receptor inhibitor, implicating muscarinic antagonists as potential treatments for −7/del(7q)-associated anemia. While chromosome-level deletions were historically thought to harbor a single TSG, the significant enrichment of TSGs within commonly deleted regions suggests a contiguous gene syndrome, wherein combinatorial loss of multiple neighboring genes drives disease.
Letter to the Editor
Monosomy 7 and del(7q) are adverse-risk cytogenetic abnormalities prevalent in myeloid malignancies in both pediatric and adult acute myeloid leukemia (AML) and myelodysplastic syndrome (MDS)1. −7 and del(7q) are detected in clonal hematopoiesis and can be initiating events in transformation2,3. Despite its clear clinical import, the underlying mechanism by which −7/del(7q) promotes transformation is incompletely understood. It has been postulated that critical tumor suppressor genes (TSGs) are encoded on chromosome 7, however identifying these genes has been challenging. Approaches have included mapping commonly deleted regions (CDRs), which helped identify CUX14, and searching for second-hit mutations, which pinpointed EZH25. Large-scale cancer re-sequencing has shown that, with the exception of EZH2 and CUX1, recurrent somatic mutations in chromosome 7 genes are rare. Here we implement in silico and in vitro screening as an alternative means to systematically uncover latent chromosome 7 TSGs.
To identify potential chromosome 7 TSGs in an unbiased manner, we mined genome-wide proliferation screens using CRISPR, gene-trap, and cDNA libraries performed in hematopoietic and non-hematopoietic cells. Thresholds for inclusion were set based on increased growth/selection for essential gene screens (CRISPRko, CRISPRi, and gene-trap) or decreased growth/selection in overexpression screens (CRISPRa and cDNA libraries). Overlap between multiple studies was prioritized, but thresholds were not stringent to cast a wide net for inclusion in further testing. We also included TSGs predicted from pan-cancer analyses of mutational patterns across thousands of primary patient cancers and TSGs from the Cancer Gene Census list. From these 12 datasets, we identified 96 coding genes with evidence of TSG activity that are also expressed in human HSPCs (Supplemental Table 1). For completeness, we also included all HSPC-expressed coding genes within the CDRs of 7q (q21.3, q22.1, q34, and q35-36), resulting in a total of 161 genes (Figure 1A).
Figure 1. Arrayed CRISPR-Cas9 screen and machine learning classification identify multiple chromosome 7 genes with myeloid tumor suppressor activity, concentrated within 7q CDRs.
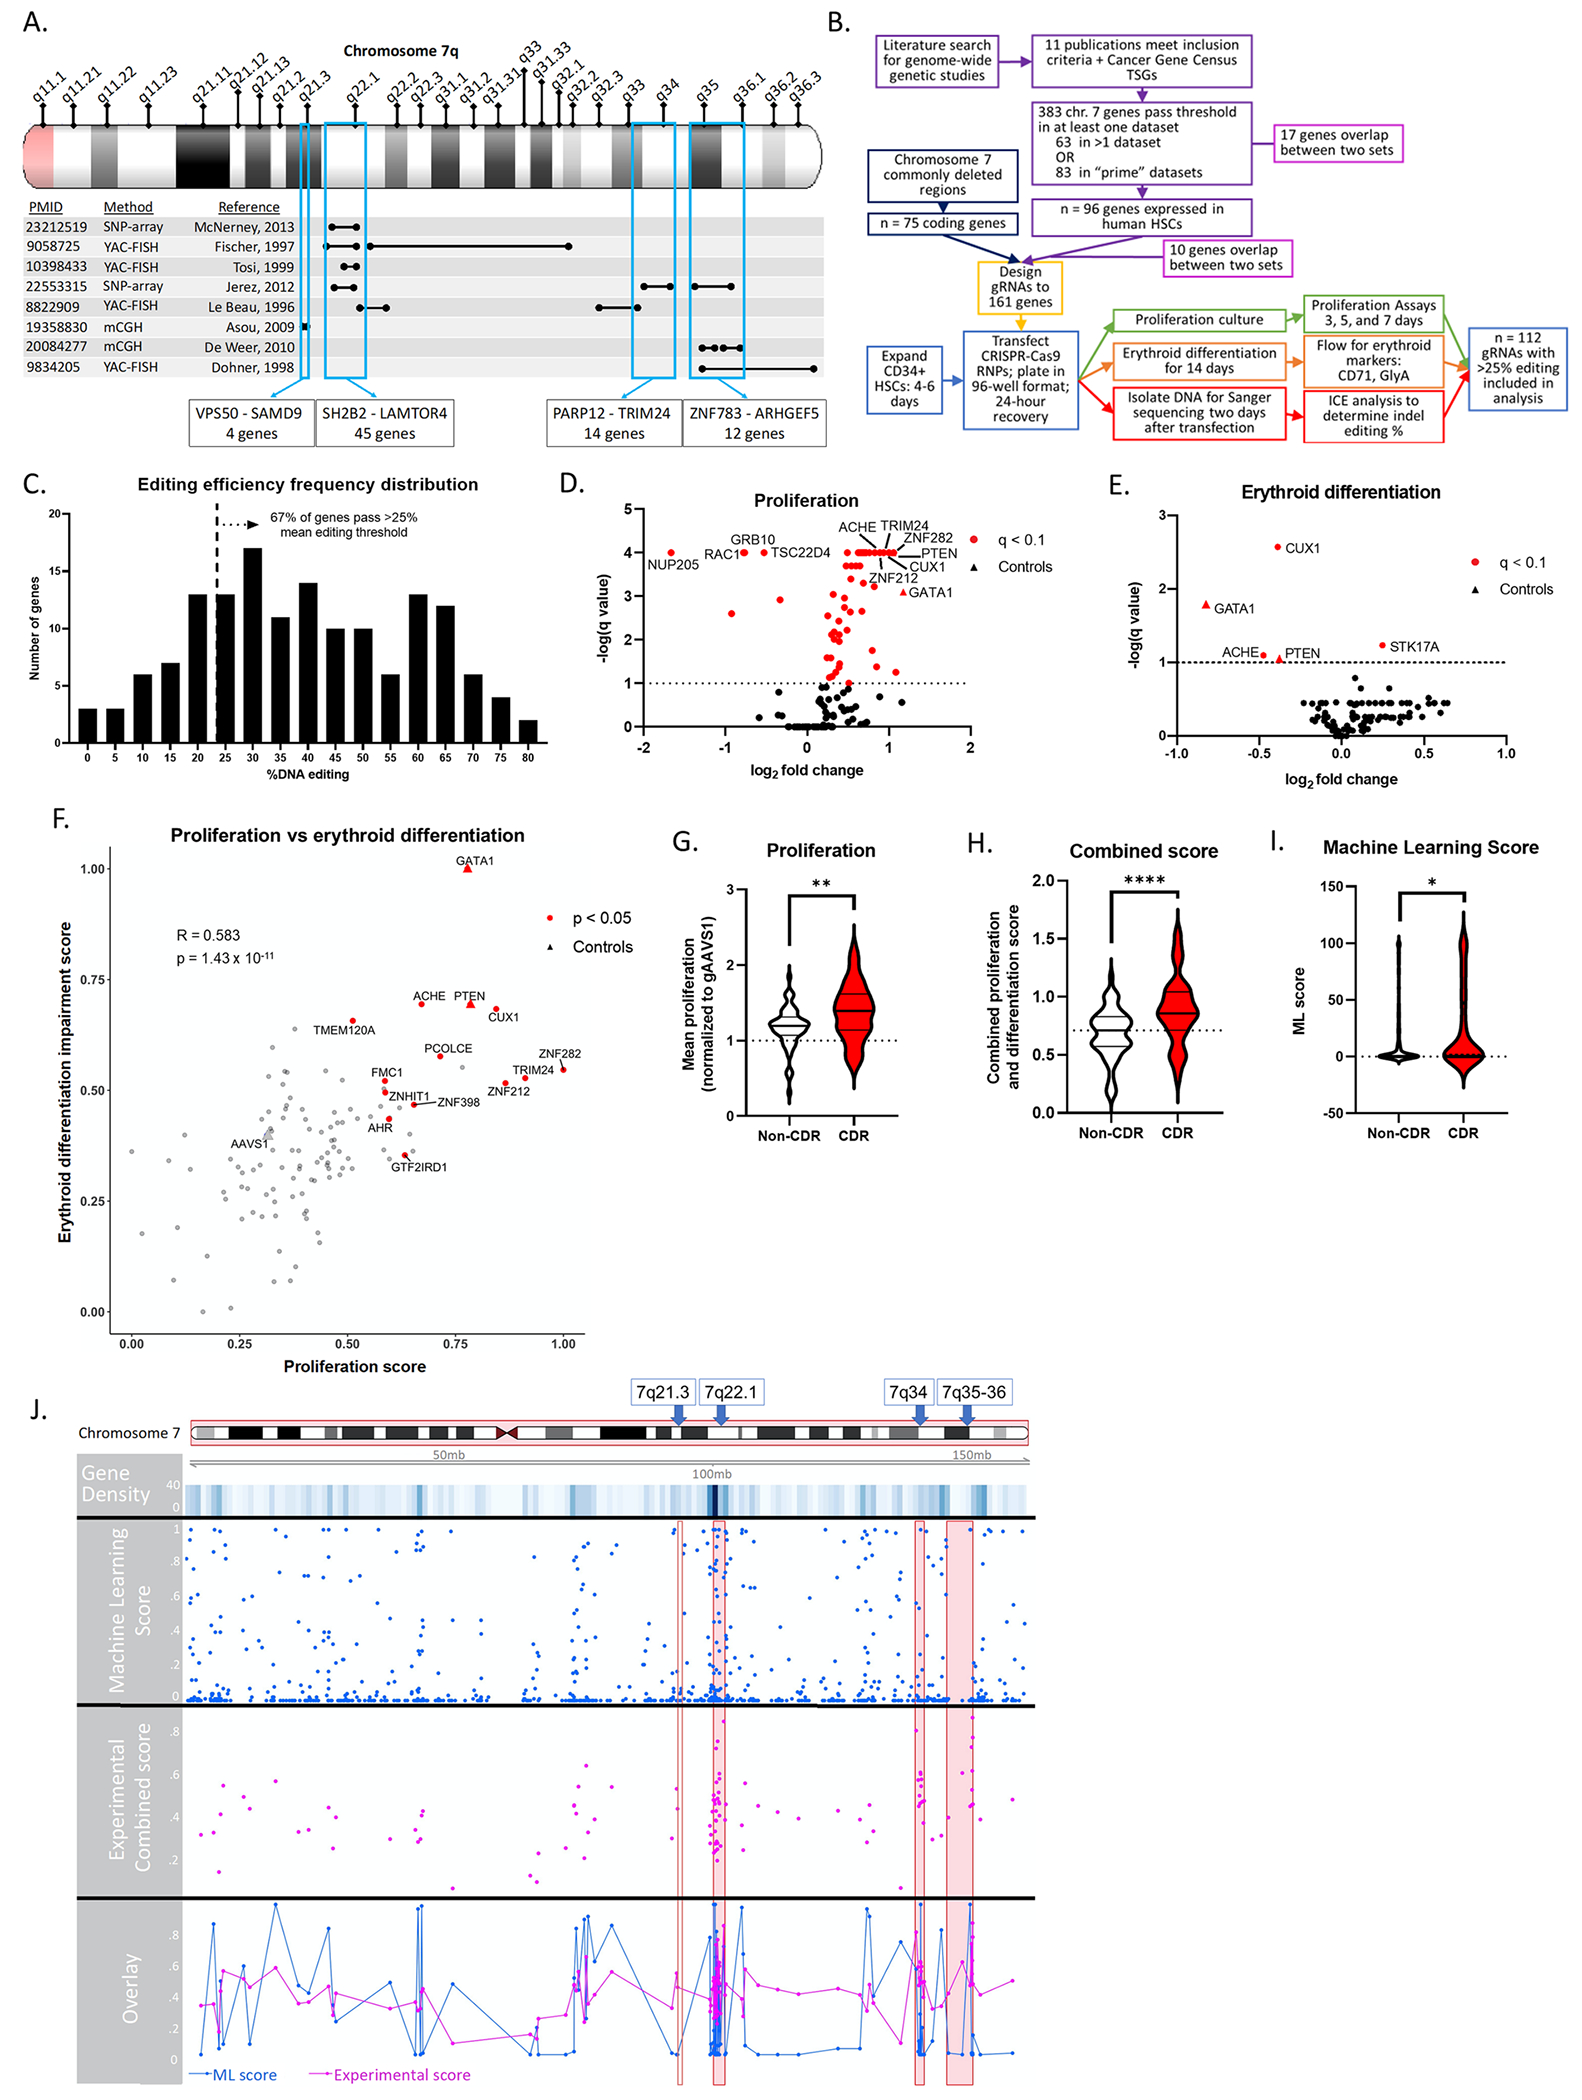
(A) Graphic depicting the selection of previously defined CDRs in chromosome 7q. Black bars indicate regions identified by each publication; blue boxes are the regions included in this study. YAC-FISH = Yeast artificial chromosome – fluorescence in situ hybridization; SNP-array = single nucleotide polymorphism array; mCGH = microarray comparative genomic hybridization. (B) Flow chart describing the arrayed CRISPR-Cas9 screen experimental design. “Prime” datasets were defined as those with complete statistical data available and performed in AML cell lines. (C) Mean editing percentages of each gene targeted by a single gRNA across replicates, shown as a frequency distribution. Dotted line indicates 25% threshold required for inclusion in analysis, with 67% of gRNAs included. (D,E) Volcano plots depicting log2 fold change (to gAAVS1 control) and −log q value of day 5 proliferation assays (D; n=7) and day 14 erythroid differentiation assays (E; n=8). Each dot is the mean value of a gene across replicates; controls denoted by a triangle; red indicates statistical significance determined by Dunnett multiple comparisons test for proliferation and multiple t-tests for erythroid differentiation, q < 0.1. (F) Proliferation and erythroid differentiation values were scaled to fall between 0 and 1, and the erythroid sign inverted so that a higher score is associated with increased proliferation and decreased erythroid differentiation. Each dot is the mean value of a gene across replicates; controls denoted by a triangle; red indicates statistical significance determined by Mann-Whitney-Wilcoxon test on summed proliferation and erythroid differentiation impairment scores, p<0.05, FDR<0.12. Correlation statistics calculated with Pearson R value and student t-test p-value. (G) Proliferation normalized to gAAVS1 or (H) combined score of genes within commonly deleted regions of 7q compared to those outside. Significance determined by student t-test, *p<0.05, **p<0.01, ***p<0.001. n=59 non-CDR genes; n = 53 CDR genes. (I) Machine learning score of genes within (n=74) or outside of CDRs (n=825). Significance determined by Mann-Whitney-Wilcoxon test, *p<0.05. (J) Genomic track of all chromosome 7 genes. Rows depict gene density, machine learning score, combined proliferation and erythroid differentiation score, and overlay of machine learning and experimental scores. Red boxes indicate CDRs.
We next functionally tested the impact of editing the candidate genes in primary, human CD34+ hematopoietic stem and progenitor cells (HSPCs). We reasoned that deletion of putative TSGs would increase HSPC proliferation and/or impair erythroid differentiation, both features of acute myeloid leukemia and myelodysplastic syndrome, respectively6. We chose an array-based CRISPR screen in lieu of a pooled approach for increased power to detect these features 7(Figure 1B). We transfected Cas9-gRNA ribonucleoprotein complexes into CD34+ HSPCs in a 96-well format, with one gRNA per gene per well. Two parallel screens were performed: i) cells were cultured in maintenance media to assess HSPC proliferation; and ii) cells were cultured in EPO-containing media to promote erythroid differentiation (see Supplemental Methods). AAVS1 gRNA was used as a negative control, gPTEN was included as a positive control for increased proliferation, and gGATA1 was used as a control for decreased differentiation (Supplemental Figure 1). Each gRNA was tested in 3-4 biological replicates with 108 guides (excluding controls) passing a threshold of >25% mean editing across all replicates, with a final mean editing efficiency of 47.9% (Figure 1C). We chose this threshold with the assumption that knockout of a TSG causes edited cell outgrowth, which was borne out (Supplemental Figure 2). We selected day 5 for proliferation measurements as that time point showed the greatest separation of genes without a plateau due to well overgrowth (Supplemental Figure 3). Overall, replicates in both the proliferation and differentiation assay were well correlated (Supplemental Figures 4, 5, and 6).
Thirty-nine percent (42/108) of target genes significantly increased proliferation when edited (Figure 1D). Only two genes, CUX1 and ACHE, had a significant impairment of erythroid differentiation (Figure 1E). This indicates that CUX1 and ACHE may play a major role in differentiation defects in −7/del(7q)-associated myeloid malignancies. Across all genes, accelerated proliferation correlated with impaired erythropoiesis, consistent with the known link between these two processes (Figure 1F). Using a combined proliferation and erythroid impairment metric (see Methods), twelve target genes scored significantly different from gAAVS1 (p<0.05; FDR<0.12, red circles, Figure 1F). Nine of the twelve genes are within the CDRs and six encode DNA binding proteins; several of these have known roles in the regulation of proliferation while others are less well characterized (further discussed in Supplemental note).
Across all genes, the effect on proliferation was non-random, with a significant bias towards increased proliferation (Supplemental Figure 7). This is perhaps a consequence of, and affirms, our inclusion criteria (Figure 1A). The effect size for genes within CDRs was significantly more pronounced, as measured by either proliferation alone (Figure 1G) or through the combined score (Figure 1H). This result is remarkable because while the other genes in the screen were pre-selected for by their performance in other CRISPR screens, all CDR genes were included, regardless of previous evidence of TSG activity. That the CDR regions are significantly enriched for TSGs implies that the deletion of these regions in myeloid malignancies contributes to disease progression through the combined loss of several contributing genes.
We next sought to validate and extend our finding of increased TSGs within CDRs through an orthogonal approach assessing all chromosome 7 coding-genes. In recent years, machine learning has proved a powerful tool in uncovering biological associations hidden in large datasets8. We implemented a random forest classification model using eight cancer genome-wide screens and one mutational signature dataset spanning 24 different cell lines to assign a TSG score for each gene (Supplemental Figures 8 and 9). We created training and testing data sets from all protein coding genes outside of chromosome 7 using the bootstrap method and used canonical TSGs curated from Cancer Gene Census as the ground truth for our training process. The performance of the classification system was strong, yielding an average AUC of 0.777[0.747 – 0.806, 95% CI]). We then ran the classifier on chromosome 7 genes, and many highly scoring genes overlapped with genes that scored significantly experimentally, such as CUX1, LUC7L29, and TRIM2410 (Supplemental Figure 10). The overlap of the experimental and classifier results did not reach significance (hypergeometric test p=0.12). Conceivably, this may reflect a limitation of the classifier and/or some hits in the classifier may exhibit tumor suppressor activity by other measurements, such as apoptosis, metastasis, or DNA repair. Nonetheless, using the classifier scores, genes within CDRs are again significantly enriched for TSGs (Figure 1I,J). This result from disparate datasets, across tumor types, mirrors our experimental results., To our knowledge, the successful application of machine learning with genomic and CRISPR screen data to identify TSGs has not been previously reported. Furthermore, our result buttresses the concept of CDRs manifesting as a contiguous gene syndrome.
As CUX1 and ACHE were the only genes with significant experimental effects on both proliferation and differentiation (by non-combined metrics), we chose these candidates for further investigation. We validated our findings with independent gRNAs targeting CUX1 and ACHE. All gRNAs decreased protein levels (Figure 2A,D) and recapitulated the proliferation and erythroid differentiation phenotypes seen in the screen (Figure 2B,C and G,H). These CUX1 results are consistent with the HSPC proliferation and anemia we observed in CUX1-knockdown mice11. ACHE is located with CUX1 in the 7q22.1 CDR and encodes extracellular membrane-associated acetylcholinesterase, also known as the Cartwright blood group. In neuromuscular junctions, acetylcholinesterase degrades acetylcholine to abrogate acetylcholine receptor signaling12, however the hematopoietic function of ACHE is unknown. We tested the effect of the muscarinic acetycholine receptor inhibitor, oxyphenonium bromide, and found that it had the opposite effect of loss of ACHE, causing decreased proliferation and increased erythroid differentiation (Figure 2E,F). Importantly, oxyphenonium bromide treatment in gACHE cells restored proliferation and differentiation to the same level as the gAAVS1 control (Figure 2G,H). This is congruent with a model wherein loss of ACHE in HSPCs causes increased muscarinic acetylcholine receptor signaling, leading to increased proliferation and impaired erythroid differentiation, contributing to the myeloid expansion and anemia seen in −7/del7q myeloid malignancies (Figure 2I). As multiple muscarinic antagonists are FDA-approved or in clinical trials, this may be a feasible treatment avenue for anemia associated with −7/del(7q) myeloid disease.
Figure 2. CUX1 and ACHE are potential TSGs in the 7q22.1 CDR and ACHE loss can be rescued by a muscarinic acetylcholine inhibitor.
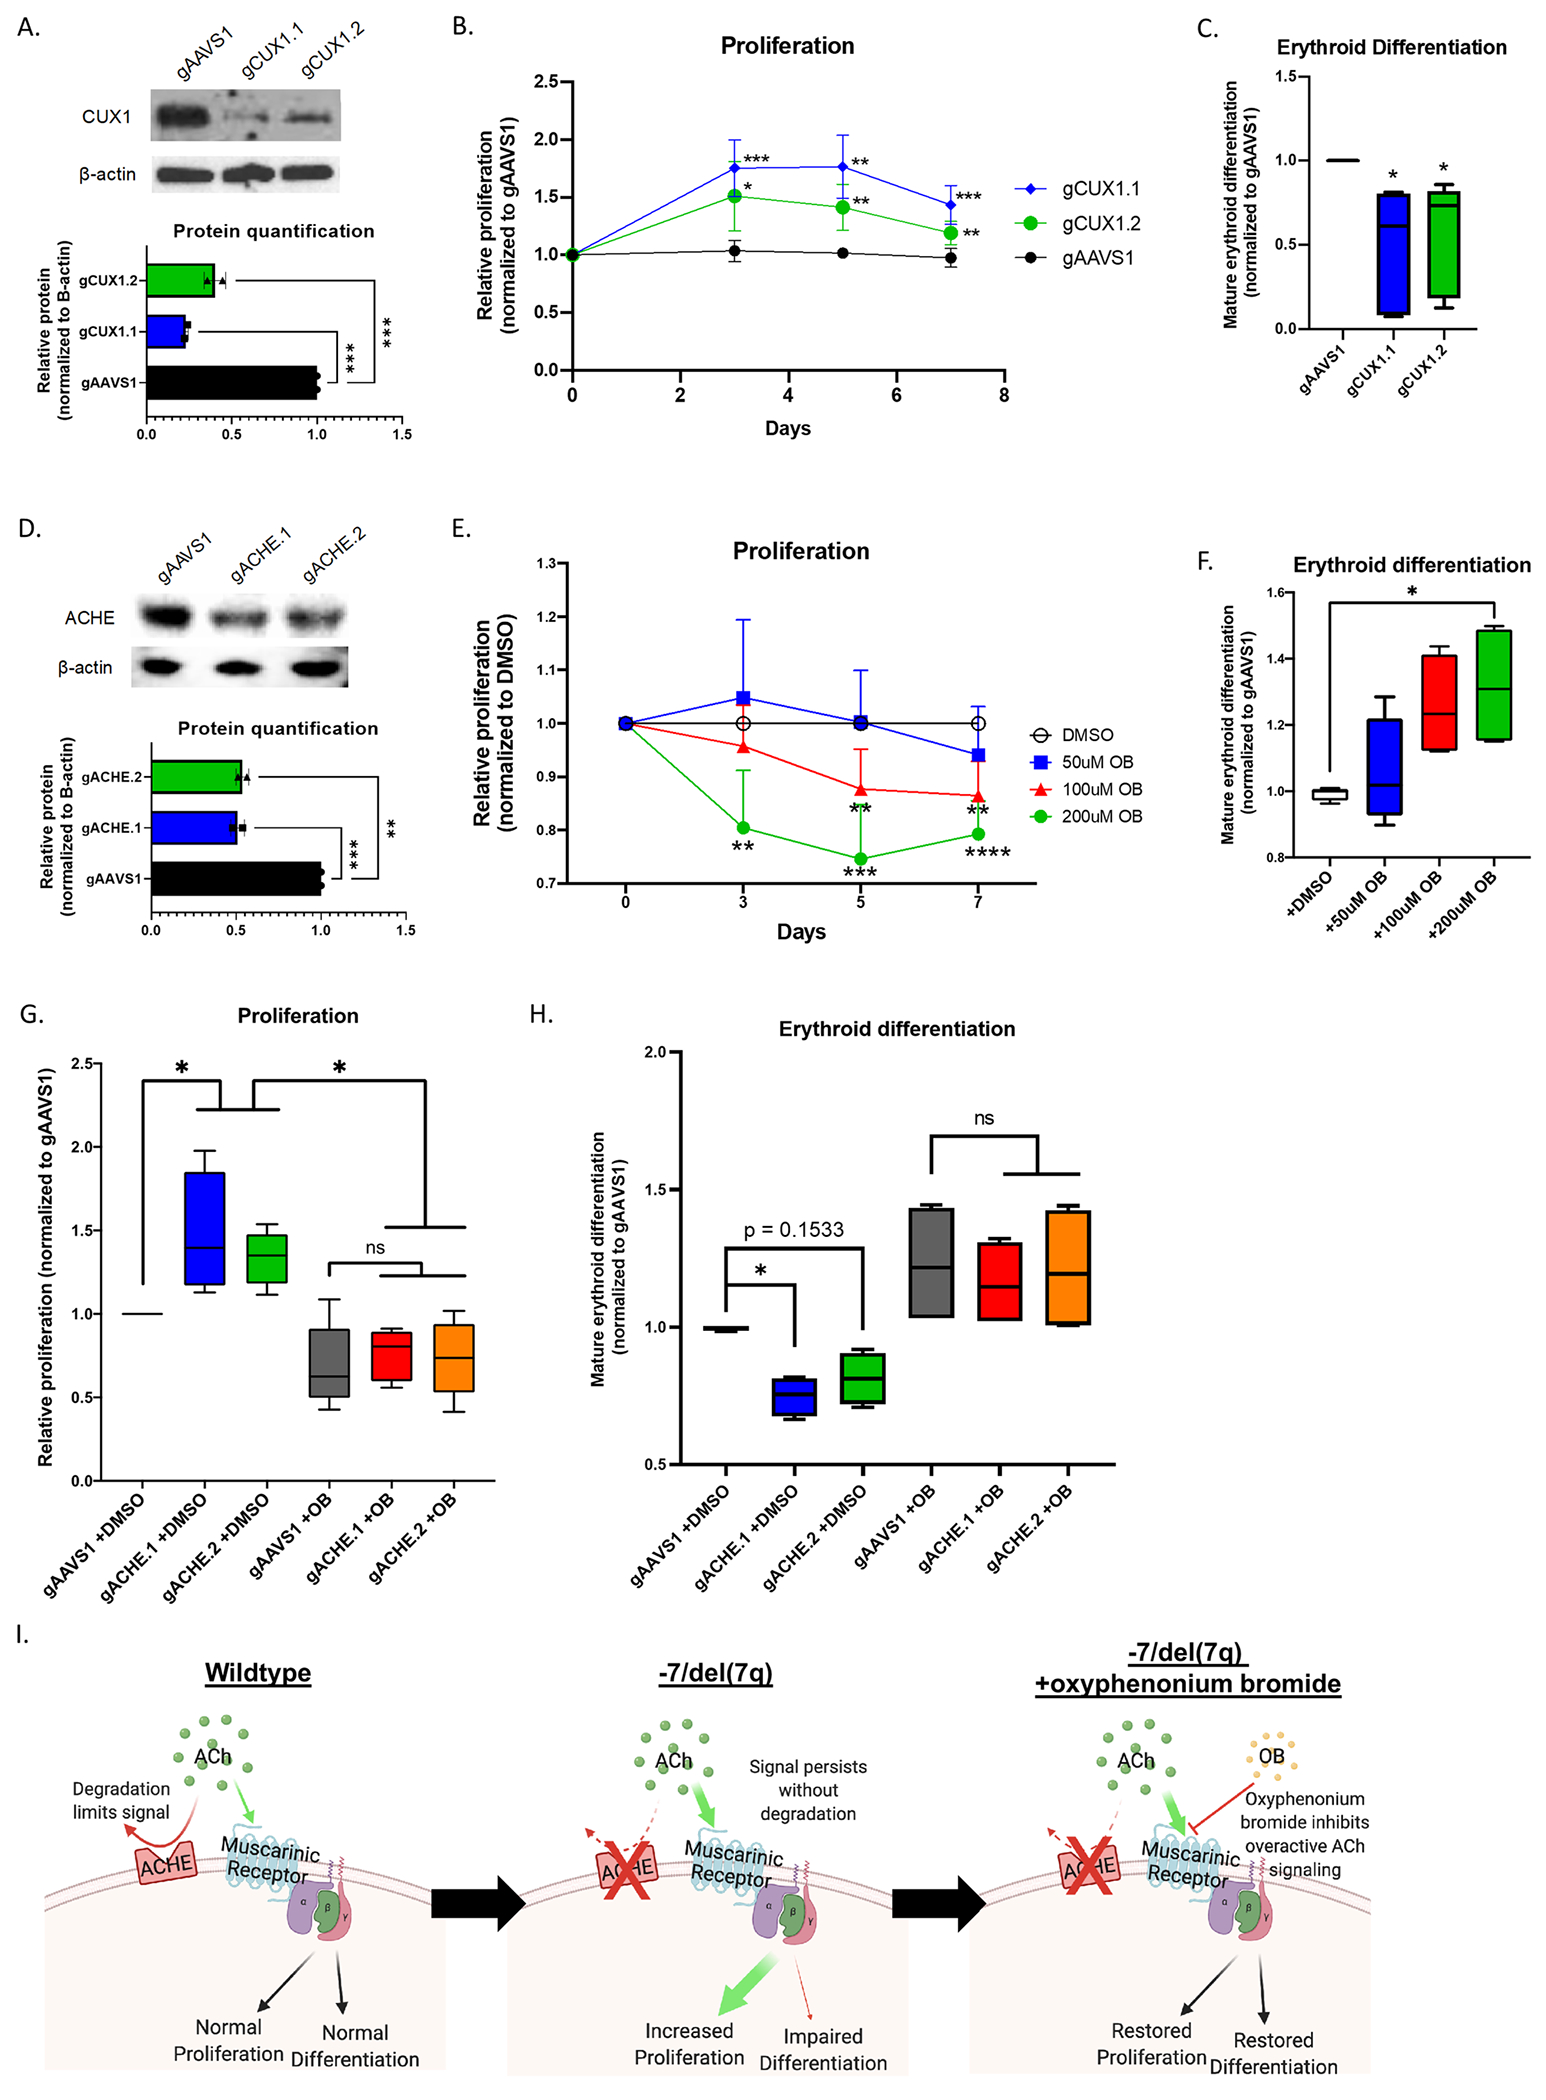
(A) Representative western blot of p200 CUX1 protein knockdown in human CD34+ cells 3 days after transfection with two different gRNAs. β-actin loading control. Relative protein quantified by densitometry, significance determined by one-way ANOVA and Dunnett’s multiple comparisons test, n=2. *p<0.05, **p<0.01, ***p<0.001._ (B) Proliferation time course normalized to gAAVS1. Significance determined by 2-way repeated measures ANOVA with Geisser-Greenhouse correction and Dunnett’s multiple comparisons test, n = 6. *p<0.05, **p<0.01, ***p<0.001. (C) gAAVS1 normalized mature/total erythroid differentiation ratio, determined by flow for CD71 and GlyA markers after 14 days in culture. Significance determined by paired t-test, n = 5. (D) Representative western blot of ACHE protein knockdown 3 days after transfection with two different gRNAs. β-actin loading control. Relative protein quantified by densitometry, significance determined by one-way ANOVA and Dunnett’s multiple comparisons test, n=2. *p<0.05, **p<0.01, ***p<0.001. (E) Proliferation time course after treatment with mAChR inhibitor oxyphenonium bromide, normalized to DMSO vehicle control. Significance determined by 2-way repeated measures ANOVA with Geisser-Greenhouse correction and Dunnett’s multiple comparisons test, n = 4. *p<0.05, **p<0.01, ***p<0.001. (F) gAAVS1 normalized mature/total erythroid differentiation ratio after 14 days in culture. Significance determined by One-way ANOVA and Dunnett’s multiple comparisons test, n = 4. (G) 5-day proliferation and (H) 14-day mature/total erythroid differentiation ratio normalized to gAAVS1 with ACHE gRNAs and/or 200uM oxyphenonium bromide. Significance determined by One-way ANOVA and Tukey’s multiple comparisons test, n = 4. (I) Graphic depicting the proposed model for the impact of ACHE loss in CD34+ cells. When ACHE is present on the cell surface, ACh signaling through mAChRs is limited in duration and/or magnitude. Without ACHE, the ACh signal persists and leads to increased proliferation and impaired erythroid differentiation. Treatment with the OB inhibitor blocks aberrant ACh signal and restores CD34+ cell to a normal level of proliferation and erythroid differentiation. *p<0.05; **p<0.01; ***p<0.001; ****p<0.0001; ns = not significant; ACHE = acetylcholinesterase; ACh = acetylcholine; mAChR = muscarinic acetylcholine receptor; OB = oxyphenonium bromide.
Overall, our study identifies several potential chromosome 7 TSGs and demonstrates that TSG activity is enriched within the 7q CDRs. While CUX1 and ACHE exert the strongest TSG phenotypes, combinatorial loss of multiple genes may characterize a contiguous gene syndrome in the leukemogenesis of monosomy 7.
A limitation of our study is that 33% of the tested genes have been excluded from our analysis due to either inefficient transfection or gRNA editing in some cases. Some of these genes have been reported to display TSG activity, including EZH25 and KMT2C13, which also score highly by our machine learning classifier, and KMT2E14 and SAMD915. Thus, we cannot rule out a role for the excluded genes. SAMD9L15 was included in our analysis, but did not score highly as TSGs in the CRISPR screen or by machine learning. Due to the shorter duration of the proliferation assay, rare proteins with particularly long half-lives may present as false negatives. Another limitation is that gRNAs generate both heterozygous and homozygous editing; further experiments determining the haploinsufficient nature of these putative TSGs is warranted.
Overall, we demonstrate that datamining and machine learning with existing genome-wide datasets is a high-yield approach to dissecting the pathogenesis of recurrent, chromosome arm-level aneuploidies in cancer.
Supplementary Material
Acknowledgements:
The authors are grateful for the services and assistance provided by University of Chicago core facilities supported by the Cancer Center Support Grant (P30 CA014599). In particular, the authors thank William Buikema and the DNA Sequencing and Genotyping Facility Core for special assistance and services (RRID:SCR_019196). We also acknowledge support from the Cytometry and Antibody Technology Core (RRID: SCR_017760) and the Center for Research Informatics Bioinformatics Core.
This work was funded in part by NIH/NHLBI R01 HL142782, NIH/NCI R01 CA231880, American Cancer Society Research Scholar Award 132457-RSG-18-171-01-LIB, American Society of Hematology Junior Faculty Scholar Award, the Brinson Foundation, and The University of Chicago Cancer Research Foundation Women’s Board. The authors gratefully acknowledge the support of Robin and Matthew Patinkin.
Footnotes
Conflict-of-interest disclosure: The authors declare no competing financial interests.
References
- 1.Inaba T, Honda H, Matsui H. The enigma of monosomy 7. Blood. 2018;131(26):2891–2898. doi: 10.1182/blood-2017-12-822262 [DOI] [PubMed] [Google Scholar]
- 2.Takahashi K, Wang F, Kantarjian H, Song X, Patel K, Neelapu S, et al. Copy number alterations detected as clonal hematopoiesis of indeterminate potential. Blood Adv. 2017. Jun 19; 1(15): 1031–1036. doi: 10.1182/bloodadvances.2017007922. [DOI] [PMC free article] [PubMed] [Google Scholar]
- 3.Dimitriou M, Woll PS, Mortera-Blanco T, Karimi M, Wedge DC, Doolittle H, et al. Perturbed hematopoietic stem and progenitor cell hierarchy in myelodysplastic syndromes patients with monosomy 7 as the sole cytogenetic abnormality. Oncotarget. 2016. Nov 8;7(45):72685–72698. doi: 10.18632/oncotarget.12234. [DOI] [PMC free article] [PubMed] [Google Scholar]
- 4.McNerney ME, Brown CD, Wang X, Bartom ET, Karmakar S, Bandlamudi C, et al. CUX1 is a haploinsufficient tumor suppressor gene on chromosome 7 frequently inactivated in acute myeloid leukemia. Blood. 2013;121(6):975–983. doi: 10.1182/blood-2012-04-426965 [DOI] [PMC free article] [PubMed] [Google Scholar]
- 5.Ernst T, Chase AJ, Score J, Hidalgo-Curtis CE, Bryant C, Jones AV, et al. Inactivating mutations of the histone methyltransferase gene EZH2 in myeloid disorders. Nat Genet. 2010;42(8):722–726. doi: 10.1038/ng.621 [DOI] [PubMed] [Google Scholar]
- 6.Ebert BL, Pretz J, Bosco J, Chang CY, Tamayo P, Galili N, et al. Identification of RPS14 as a 5q-syndrome gene by RNA interference screen. Nature. 2008;451(7176):335–339. doi: 10.1038/nature06494 [DOI] [PMC free article] [PubMed] [Google Scholar]
- 7.Shalem O, Sanjana NE, Zhang F. High-throughput functional genomics using CRISPR-Cas9. Nat Rev Genet. 2015;16(5):299–311. doi: 10.1038/nrg3899 [DOI] [PMC free article] [PubMed] [Google Scholar]
- 8.Camacho DM, Collins KM, Powers RK, Costello JC, Collins JJ. Next-Generation Machine Learning for Biological Networks. Cell. 2018;173(7):1581–1592. doi: 10.1016/j.cell.2018.05.015 [DOI] [PubMed] [Google Scholar]
- 9.Makishima H, Visconte V, Sakaguchi H, Jankowska AM, Abu Kar S, Jerez A, et al. Mutations in the spliceosome machinery, a novel and ubiquitous pathway in leukemogenesis. Blood. 2012;119(14):3203–3210. doi: 10.1182/blood-2011-12-399774 [DOI] [PMC free article] [PubMed] [Google Scholar]
- 10.Tisserand J, Khetchoumian K, Thibault C, Dembélé D, Chambon P, Losson R. Tripartite motif 24 (Trim24/Tif1α) tumor suppressor protein is a novel negative regulator of interferon (IFN)/signal transducers and activators of transcription (STAT) signaling pathway acting through retinoic acid receptor α (Rarα) inhibition. J Biol Chem.2011. ;286(38):33369–33379. doi: 10.1074/jbc.M111.225680 [DOI] [PMC free article] [PubMed] [Google Scholar]
- 11.An N, Khan S, Imgruet MK, Gurbuxani SK, Konecki SN, Burgess MR, et al. Gene dosage effect of CUX1 in a murine model disrupts HSC homeostasis and controls the severity and mortality of MDS. Blood. 2018;131(24):2682–2697. doi: 10.1182/blood-2017-10-810028 [DOI] [PMC free article] [PubMed] [Google Scholar]
- 12.Taylor P, Radić Z. The cholinesterases: from genes to proteins. Annu Rev Pharmacol Toxicol. 1994;34:281–320. doi: 10.1146/annurev.pa.34.040194.001433 [DOI] [PubMed] [Google Scholar]
- 13.Chen C, Liu Y, Rappaport AR, Kitzing T, Schultz N, Zhao Z, et al. MLL3 is a haploinsufficient 7q tumor suppressor in acute myeloid leukemia. Cancer Cell. 2014;25(5):652–665. doi: 10.1016/j.ccr.2014.03.016 [DOI] [PMC free article] [PubMed] [Google Scholar]
- 14.Zhang Y, Wong J, Klinger M, Tran MT, Shannon KM, Killeen N. MLL5 contributes to hematopoietic stem cell fitness and homeostasis. Blood. 2009;113(7): 1455–1463. doi: 10.1182/blood-2008-05-159905 [DOI] [PMC free article] [PubMed] [Google Scholar]
- 15.Davidsson J, Puschmann A, Tedgård U, Bryder D, Nilsson L, Cammenga J SAMD9 and SAMD9L in inherited predisposition to ataxia, pancytopenia, and myeloid malignancies. Leukemia 32, 1106–1115(2018). doi: 10.1038/s41375-018-0074-4 [DOI] [PMC free article] [PubMed] [Google Scholar]
Associated Data
This section collects any data citations, data availability statements, or supplementary materials included in this article.