

Abstract
Background:
Primary ciliary dyskinesia (PCD) is a motile ciliopathy characterized by oto-sino-pulmonary infections in childhood. Inheritance is commonly autosomal recessive, with extensive locus and allelic heterogeneity. The prevalence is uncertain. Most genetic studies have been performed in North America or Europe. The aim of the study was to estimate the world-wide prevalence and ethnic heterogeneity of PCD.
Methods:
We calculated the allele frequency of disease-causing variants in 29 PCD genes associated with autosomal recessive inheritance among 182,681 unique individuals to estimate the prevalence of PCD in seven major ethnicities. We began by aggregating variants that had been interpreted by Invitae, a genetics laboratory with PCD expertise. We then determined the allele frequency of each variant, (pathogenic, likely pathogenic or variant of uncertain significance [VUS]) in gnomAD, a next-generation sequencing database that aggregates exome and genome sequencing information from multiple projects and stratifies allele counts by ethnicity. Using the Hardy-Weinberg equilibrium (HWE) equation, we were able to calculate a lower-end prevalence of PCD for each ethnicity by including only pathogenic and likely pathogenic variants (PLP); and upper-end prevalence by also including variants of uncertain significance (VUS). This approach was similar to previous work on Li-Fraumeni (TP53 variants) prevalence: we were not diagnosing PCD, but rather estimating prevalence based on known variants.
Findings:
The estimated prevalence of PCD, as calculated by the expected frequency of biallelic variants, was higher in individuals of African ancestry than in most other populations. Within each ethnicity, the genes most commonly implicated in PCD differed; these contrasted with those previously considered most common. Though certainly an underestimate, the overall minimum PCD prevalence is at least one in 7554.
Interpretation:
PCD is more common than has been recognized, particularly in individuals of African ancestry. We identified gene distributions that differ from those in previous European and North American studies. These results could have an international impact on case identification. Our analytic approach can be expanded as more PCD loci are identified, and could be adapted to study the prevalence of other inherited diseases.
Funding:
Corresponding author was supported by NHLBI (1 P01 HL128192). The funder was not involved in study design.
Introduction
Primary ciliary dyskinesia (PCD) is a motile ciliopathy associated with recurrent oto-sino-pulmonary infections in childhood, laterality defects, and infertility1,2. It is a debilitating, inherited condition associated with likely increased morbidity and mortality. Genetically, it is characterized by locus heterogeneity. There are over 40 disease-causing genes described to date. PCD is also characterized by allelic heterogeneity: many pathogenic variants have been identified in each gene.
An American Thoracic Society(ATS) and European Respiratory Society (ERS) clinical practice guideline1,3 provides a framework for PCD diagnostic criteria. In the ATS guidelines, if at least 2 of 4 key clinical features are present (unexplained neonatal respiratory distress, year-round daily cough beginning before 6 months of age, year-round daily nasal congestion beginning before 6 months of age, or organ laterality defect), multiple tests can establish the diagnosis. The ERS guidelines3 are similar, though there are important differences in the diagnostic algorithm and the weight given to different tests.
PCD is most commonly autosomal recessive, though X-linked and autosomal dominant inheritance have been described4. In a large rare disease consortium with over 200 patients with clinically confirmed PCD, sequencing of 21 genes associated with PCD established a molecular diagnosis in approximately 65% of individuals. The autosomal recessive genes from this paper5, with the exception of HYDIN and genes excluded as discussed in the methods, represent the majority of PCD genes included in the current study (see methods for details). Because we are predominantly evaluating genes known at the time of this paper, we have adapted this estimate.
The general prevalence of PCD is often reported to be from 1 in 11,000 to 1 in 16,0006,7. However, these prevalence estimates predate the identification of PCD-causing genes and have critical limitations. In 19506, Torgersen reported on situs inversus in Norway using “mass x-ray photography” of Norwegian individuals over age 15-years-old, and on selected cases identified in health departments. He concluded that 0.011 percent of the Norwegian population had situs inversus, but this study addressed the prevalence of situs inversus, not PCD. Three years earlier8, he had published that approximately 1 in 8,000 Norwegians had “transposition of viscera.” In 1972, Katsuhara et al.7 identified that 4 of 16,566 individuals had situs inversus within the Atomic Bomb Casualty Commission-Japanese National Institute of Health Adult Health Study. One of these individuals with situs inversus also had bronchiectasis. It has been suggested that 1 in 16,566 individuals is a suitable estimate of PCD prevalence in Japan. However, neither of these studies were structured to identify bronchiectasis in individuals without situs inversus. Both studies included predominantly adults, representing a selection bias in a disorder with likely diminished survival. Lastly, these studies were performed in isolated ethnicities, and the ability to generalize to individuals of other ethnicities is not known. More recently, Kuehni and colleages9 issued questionnaires to European centres caring for children with PCD and determined that reported cases per million children were 111 in Cyprus, 47 in Switzerland, 46 in Denmark, and considerably lower in some other countries. However, the global prevalence and carrier frequency of PCD remain unclear and require investigation.
North American and European genetic studies have suggested that biallelic variants in five genes are most commonly implicated in PCD as follows4: DNAH5 accounting for 15–29%10–13, DNAH11 accounting for 6–9%13,14, DNAI1 accounting for 2–10%12,13,15,16, CCDC39 accounting for 4–9%13,17, and CCDC40 accounting for 3–4%13,17. However, our understanding of the genetic etiology of PCD in other populations is rudimentary. For example, very recent data suggest that HYDIN variants may be present in PCD patients in whom a previous genetic diagnosis was obscure18, although the relative attribution of HYDIN to PCD is expected to be less than 1%. Others have described genes and variants that more commonly cause PCD in specific populations19–24.
Here, using variant frequency data from a large public sequence database along with the Hardy-Weinberg equilibrium, we have estimated the global prevalence of PCD and identified the leading pathogenic variants and PCD-causing genes across a broad range of ethnicities, similar to approaches evaluating the prevalence of other Mendelian diseases25–27. We are not diagnosing PCD in this study; rather, we are querying the population frequency of disease-causing variants. We leveraged the rigorous Sherloc variant classifications28 performed at a diagnostic laboratory, Invitae; these were based on variant interpretation guidelines from the American College of Medical Genetics and Genomics Laboratory Quality Assurance Committee and the Association for Molecular Pathology (ACMG/AMP)29 and is a refinement of the ACMG/AMP guidelines30 We then queried gnomAD31 for allele frequencies among different ethnicities for both pathogenic and likely pathogenic (PLP) variants as well as variants of uncertain significance (VUS). These variants are present online at Mendeley (https://data.mendeley.com/datasets/nc3zm6v6cg/1). Variants are shown in three spreadsheets: copy number variants, other variants interpreted at Invitae, and gnomAD presumed loss of function variants. We hypothesized that such an approach would allow for establishment of a minimum prevalence and carrier frequency among different ethnicities when excluding VUS. By including VUS, we hypothesized that an upper limit of prevalence (though almost certainly an overestimate) could be determined.
Methods
Data Collection
Variant classifications and annotations were provided by Invitae, which has substantial data from individuals regarding variants in genes known to be associated with PCD (variants analyzed in this study are present in Mendeley (https://data.mendeley.com/datasets/nc3zm6v6cg/1). These include both individuals tested for PCD, as well as individuals who underwent genetic testing for other clinical indications in which PCD genes were included on the sequencing platform. Given improvements in the gene content over time, not all individuals were tested for the same number of PCD genes (Table 1). For some genes, Invitae data were available from over 40,000 individuals who had genetic testing. Variants were classified as pathogenic, likely pathogenic, uncertain significance, likely benign, and benign according to the Sherloc variant interpretation framework28, which is based on variant interpretation guidelines from the ACMG Laboratory Quality Assurance Committee and the AMP (ACMG/AMP)29,30. Likely benign and benign variants were not included in this analysis. Variant classifications used in this study are presented as they were reported in January 2018. Although data were available, OFD1, RPGR, DNAH1, DNAH8, and NME8 were not included in the analysis. OFD1,RPGR, and DNAH1 were excluded because the presence of allelic conditions makes the use of disease-causing variants in this study difficult (a pathogenic variant may not necessarily be associated with PCD). DNAH8 and NME8 were excluded because of a paucity of unequivocal evidence supporting an association with PCD. At the time of our analysis, HYDIN was not included on the Invitae panel. We reviewed de-identified data under an institutional review board–approved protocol (Western Institutional Review Board #20161796), which includes a waiver of consent.
Table 1.
For each gene studied the following information is provided: National Center for Biotechnology Information (NCBI) reference sequence, the number of coding nucleotides present, and the number of individuals for whom genetic data were available at Invitae. Note that over time, the NCBI reference sequence used by Invitae changed for some genes.
| Table 1: Number of individuals tested at Invitae with data available for each gene | |||
|---|---|---|---|
| Gene | NCBI Reference Sequence | # of Coding Nucleotides | Individuals Tested at Invitae |
| ODAD2 (ARMC4) | NM_018076.2 | 3135 | 14591 |
| CFAP298 (C21orf59; C21orf48) | NM_021254.2 | 873 | 14591 |
| CCDC103 | NM_213607.2 | 729 | 14591 |
| ODAD1 (CCDC114) | NM_144577.3 | 2013 | 14591 |
| ODAD3 (CCDC151) | NM_145045.4 | 1788 | 14591 |
| CCDC39 | NM_181426.1 | 2826 | 41225 |
| CCDC40 | NM_017950.3 | 3429 | 41225 |
| CCDC65 | NM_033124.4 | 1455 | 14591 |
| CCNO (CCNU) | NM_021147.4 | 1053 | 14591 |
| DNAAF1 (LRRC50) | NM_178452.4 | 2178 | 41225 |
| DNAAF2 (C14orf104) | NM_018139.2 | 2514 | 41225 |
| DNAAF3 (C19orf51, CILD2) | NM_001256714.1 | 1827 | 14591 |
| DNAAF5 (HEATR2) | NM_017802.3 | 2568 | 14591 |
| DNAH11 | NM_001277115.1 | 13551 | 41225 |
| DNAH5 | NM_001369.2 | 13875 | 41225 |
| DNAI1 | NM_012144.3 | 2100 | 41225 |
| DNAI2 | NM_023036.4 | 1818 | 41225 |
| DNAL1 (C14orf168) | NM_031427.3 | 573 | 41218 |
| DRC1 (C2orf39; CCDC164) | NM_145038.3 | 2223 | 14591 |
| DNAAF4 (DYX1C1) | NM_130810.3 | 1263 | 14591 |
| GAS8 (GAS11) | NM_001481.2 | 1437 | 348 |
| DNAAF11 (LRRC6) | NM_012472.4 | 1401 | 348 |
| MCIDAS (MCIN) | NM_001190787.1 | 1158 | 14591 |
| RSPH1 (TSGA2) | NM_080860.3 | 930 | 14591 |
| RSPH3 (RSHL2) | NM_031924.4 | 1683 | 348 |
| RSPH4A (RSHL3) | NM_001010892.2 | 2151 | 23677 |
| RSPH9 (MRPS18AL1; C6orf206) | NM_152732.4 | 831 | 23677 |
| SPAG1 | NM_172218.2 | 2781 | 14591 |
| ZMYND10 | NM_015896.2 | 1323 | 14591 |
We first identified all pathogenic/likely pathogenic (PLP) variants, with a rigorous variant classification approach based on published ACMG/AMP guidelines. We then used this catalogue to calculate a prevalence based on a calculated carrier frequency of these PLP variants. We are a priori classifying rare, presumed LoF variants observed in unaffected databases (gnomAD or unaffected individuals with data at Invitae) as PLP without observations in our patient cohort. This is consistent with ACMG guidelines and Sherloc methods, where an expected truncating (stop, frameshift, exon deletion) or certain splicing variants, if sufficiently rare in the general population, can be classified as PLP a priori. We are using the allele frequencies to determine the overall carrier frequency and, by HWE, prevalence. As noted above, we have estimated that 35% of PCD genes were missed because they were poorly defined or not discovered at the time of our analysis5. This may be a conservative adjustment, resulting in a slight under-estimate of PCD prevalence.
GnomAD31 represents the compilation of next-generation sequencing data from multiple projects and provides allele frequencies stratified by ethnicity for variants of interest. GnomAD version 2.0.2 was queried for allele frequencies of each variant curated at Invitae for each of the reported ethnicities. GnomAD data include exome sequencing and genome sequencing for the following numbers of individuals: 12487 African/African American (8128 exomes and 4359 genomes), 17720 Latino (17296 exomes and 424 genomes), 5185 Ashkenazi Jewish (5040 exomes and 145 genomes), 12562 Finnish (10824 exomes and 1738 genomes), 64603 non-Finnish European (56885 exomes and 7718 genomes), 9977 East Asian (9197 exomes and 780 genomes), 15308 South Asian (entirely exome sequencing with no genomes included), and 3614 other ethnicities (3070 exomes and 544 genomes). For some variants reported by Invitae, there were no gnomAD data (such as, for instance, copy number variants). Invitae data within a control cohort were used to calculate an allele frequency for these variants, but because Invitae data lacked definitive ethnicity of individuals, these variants are only included in the “overall” cohort. Likewise, some variants in gnomAD were not seen in the Invitae dataset. GnomAD presumed loss of function (pLoF) variants were included in this analysis even if absent in the Invitae data, and were presumed to be pathogenic or likely pathogenic. pLoF variants in gnomAD are classified on the basis of variant type (nonsense, splicy site variant, etc.) GnomAD pLoF variants were excluded if the allele frequency was higher than expected compared to pathogenic / likely pathogenic variants interpreted at Invitae to decrease the likelihood that a pLoF variant was included in the analysis if not truly disease - causing. Note that the gnomAD pLoF variants did not undergo the same rigorous variant interpretation as variants interpreted at Invitae.
For variants interpreted at Invitae, allele frequencies were obtained from gnomAD stratified by ethnicity. Additionally, some variants interpreted at Invitae were absent from gnomAD (or present only in the “Other” ethnicity classification but not seen in any of the seven major ethnicities) but had been seen in individuals with testing at Invitae for indications other than PCD (such as cancer and cardiovascular disease). Internal data at Invitae among this cohort of individuals with testing unrelated to PCD symptoms could be used to calculate an allele frequency. However, because ancestry data were unavailable for individuals with genetic testing at Invitae, variants absent from gnomAD (or not seen in any of the major ethnicities in gnomAD) were only included in the “overall” frequency calculations, and could not be included in calculations for individual ethnicities. Variants that were classified by Invitae and absent from gnomAD (or not present in any of the seven major ethnicities) were excluded from this analysis if they were only observed at Invitae in patients whose referring clinicians had requested results from the PCD panel of genes, since these individuals are highly suspicious for having PCD and expected to be enriched for pathogenic and likely pathogenic variants.
Data Analysis
For each variant for which there are gnomAD data, the “Popmax frequency” is the allele frequency seen in the ethnicity for which that variant is most prevalent. The Popmax frequency was used for two purposes. First, it was used to identify “common” variants (carrier frequencies exceeding 1 in 500 individuals) in a specific ethnicity (Table 2). Second, it was used to exclude very common VUS that are unlikely to be disease-causing. VUS were excluded from analysis if the Popmax frequency is greater than the frequency of the most common pathogenic/likely pathogenic variant (PLP) in the same gene (ascertained by Popmax allele frequency from gnomAD among the PLP variants curated at Invitae). For variants in the Invitae dataset that are not present in gnomAD major ethnicities, VUS were excluded if the allele frequency calculated from Invitae data was greater than the Popmax allele frequency of the most common PLP variant in the same gene (again ascertained by Popmax allele frequency in gnomAD among PLP variants curated at Invitae). After excluding VUS, 9975 variants (7295 of which were present in gnomAD and 2680 which were not seen in the seven major ethnicities in gnomAD) were analyzed (Figure 1).
Table 2.
Twelve pathogenic or likely pathogenic variants were identified with a carrier frequency > 1 in 500 among individuals in the ethnicity in which the variant is most common. Data presented were retrieved in January 2018.
| Table 2: Pathogenic / likely pathogenic variants exceeding carrier frequency of 1 in 500 in the Popmax | |||||||
|---|---|---|---|---|---|---|---|
| Gene | Popmax | Allele Count | Allele Number | HGVS Variant Nomenclature (cDNA) | Protein effect | dbSNP | Popmax Carrier Frequency |
| DNAAF4 (DYX1C1) | Latino | 50 | 20232 | c.523delA | p.Ile175Phefs*21 | rs751610886 | 1 in 203 |
| DNAAF1 (LRRC50) | Ashkenazi Jewish | 24 | 10152 | c.1698+1G>A | p.? | rs139519641 | 1 in 212 |
| DNAI1 | African / African American | 33 | 14382 | c.388+2T>G | p.? | rs780734984 | 1 in 218 |
| CCDC39 | African / African American | 18 | 8728 | c.1167+1261A>G | Aberrant splicing suggested$ | rs577069249 | 1 in 243 |
| CFAP298 (C21orf59; C21orf48)) | Ashkenazi Jewish | 17 | 10152 | c.735C>G | p.Tyr245* | rs202094637 | 1 in 299@ |
| CCNO (CCNU) | Ashkenazi Jewish | 12 | 8202 | c.638T>C | p.Leu213Pro | rs775051461 | 1 in 342 |
| DNAI1 | Ashkenazi Jewish | 11 | 9850 | c.1490G>A | p.Gly497Asp (Aberrant splicing suggested)& | rs376252276 | 1 in 448@ |
| DNAAF5 (HEATR2) | Eastern European | 19 | 18600 | c.58+1G>A | p.? | rs180962217 | 1 in 490^ |
| ODAD2 (ARMC4) | South Asian | 9 | 4808 | c.1678C>T | p.Arg560* | rs532731258 | 1 in 268^ |
| ODAD1 (CCDC114) | Latino | 1 | 848 | c.1411G>T | p.Glu471* | rs1372202969 | 1 in 425^# |
| ZMYND10 | Ashkenazi Jewish | 1 | 290 | c.599+1G>A | p.? | rs111836157 | 1 in 146^# |
| DNAI2 | Latino | 1 | 838 | c.562C>T | p.Gln188* | rs1194460219 | 1 in 420# |
Four of these variants were not identified by data at Invitae but were in the gnomAD presumed loss of function variants.
Three variants have an allele count of 1 and an allele number less than 1000, and the allele frequency should be interpreted cautiously.
One variant in CCDC39 (rs577069249) has been suggested to cause a splice defect40.
A variant in DNAI1 (rs376252276) is in the last base of an exon and has been suggested to cause a splice defect15. The carrier frequency of two variants has been reported previously in the Ashkenazi Jewish population41: a CFAP298 (C21orf59) (rs202094637) variant was reported as having a carrier frequency of 0.48% in the Ashkenazi Jewish population, and a DNAI1 (rs376252276) variant was reported as having a carrier frequency of 0.28% in the Ashkenazi Jewish population. The four variants observed in gnomAD but not at Invitae likely reflect the fact that the genes with these variants were sequenced in approximately 16-fold fewer individuals at Invitae than gnomAD. Furthermore, the allele count for three of the variants were enriched in Eastern European, South Asian, and Latino ethnicities, which are likely ethnicities under-represented within the Invitae population.
Figure 1: VUS (variants interpreted by Invitae as variant of uncertain significance), PLP (variants interpreted by Invitae as either pathogenic or likely pathogenic), pLoF (gnomAD presumed loss-of-function variant).
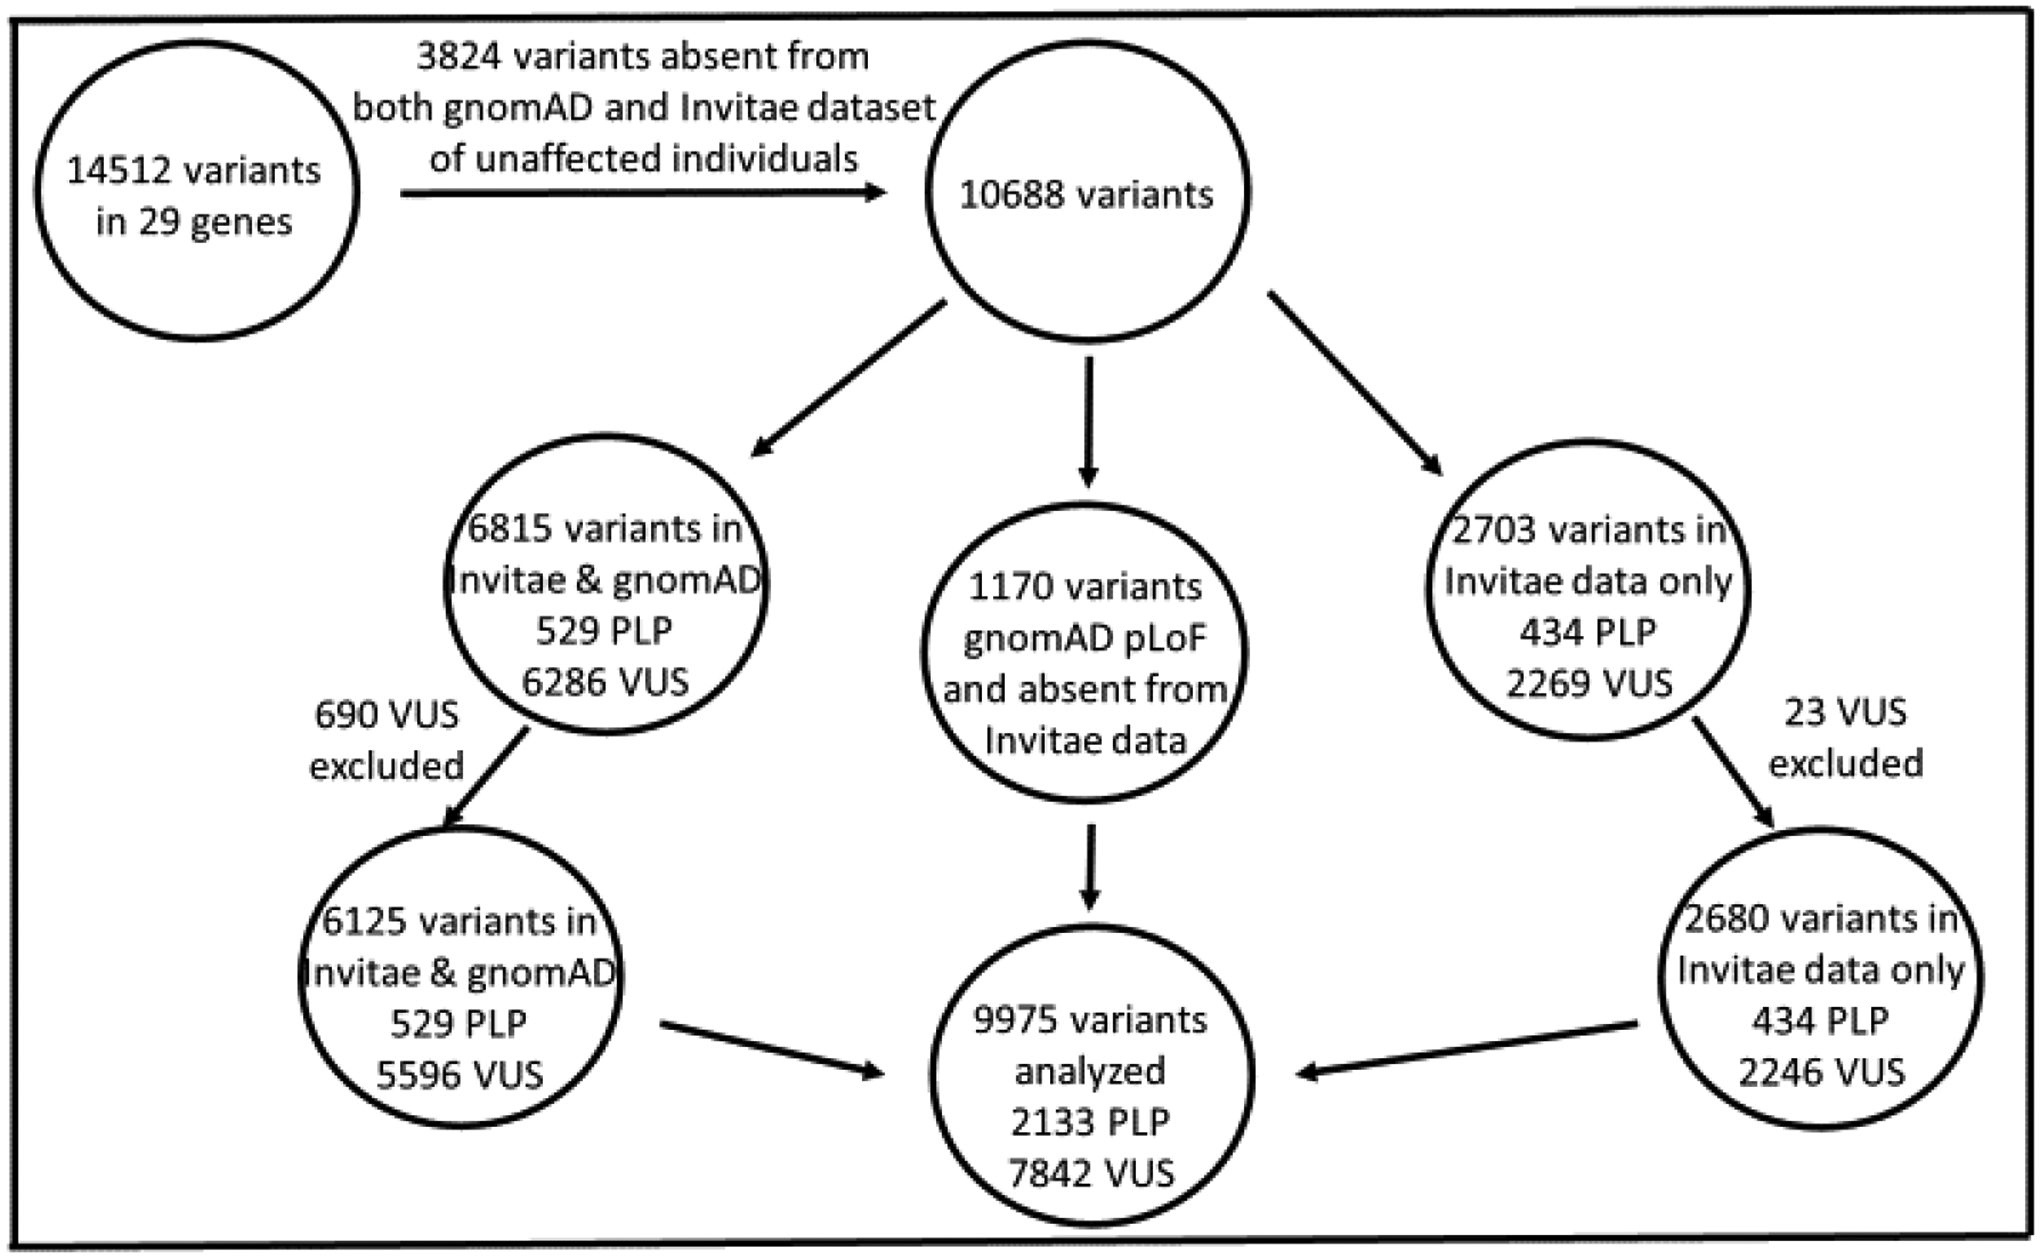
Figure 1 demonstrates the filtering process of variants included in the analysis. We aggregated all PLP variants classified at Invitae in 29 genes in the course of genetic testing. We used these variants to calculate the allele frequency in two presumably unaffected populations: gnomAD and Invitae patients who did not have testing ordered of PCD genes. Because patients who had testing ordered for evaluation of PCD are likely enriched for PLP variants, we excluded 3,824 PLP and VUS that were only observed in this population (or if they were in gnomAD but were not present in any of the major ethnicities (only “Other” ethnicity) and absent from the Invitae control population). gnomAD pLoF variants with an allele frequency that did not exceed the expected compared to PLP variants interpreted at Invitae were also aggregated. 10,688 variants seen in gnomAD or control individuals with testing at Invitae were present after excluding the 3,824 variants. 2703 variants were present in Invitae data but were either absent in gnomAD or were not seen in any of the major ethnicities; 23 of these VUS were excluded due to the high allele frequency, and 2680 of these variants were included in the analysis for calculation of an “Overall” prevalence. In total,713 VUS were excluded due to prevalence as detailed in the manuscript. A total of 9,975 variants were included in the analysis. 2,133 PLP were analyzed (of which 53 were CNVs and present only in the Invitae dataset). 7,842 VUS were analyzed. It is important to note that for some variants, there are not data available from gnomAD for every ethnicity. When variants interpreted at Invitae were absent from gnomAD, allele frequencies could be calculated using data from control individuals with testing ordered at Invitae (testing ordered for indications other than PCD); these data were only used in calculations for the “overall” cohort since information was not available regarding allele frequency in different ethnicities. There were data present in the Invitae control dataset and/or gnomAD for 9,975 variants in the overall cohort, 6,919 variants in the South Asian cohort, and 7,295 variants in the remaining ethnicities.
For each gene and in each ethnicity, variant frequency data were first analyzed excluding VUS (pathogenic and likely pathogenic variants only). We then reanalyzed the data including VUS. For each gene and in each ethnicity, the sum of all individual allele frequencies was calculated. GnomAD pLoF variants were included in the analysis even if not present in the Invitae dataset. Both the prevalence of PCD due to each specific gene and the carrier frequency, respectively, were then calculated using HWE for autosomal recessive conditions. For each gene in each ethnicity, the allele frequencies of each variant are summed. Hardy Weinberg equations are applied to calculate the prevalence of biallelic variants by squaring the sum of allele frequencies for every variant in a gene. That is, if the sum of the minor allele frequencies for a gene in a given ethnicity is represented as q, then the prevalence is equal to q2 (individuals with biallelic variants), and the carrier frequency is equal to 2*(1-q)*q. These calculations were performed twice to ensure accuracy. Only genes associated with autosomal recessive inheritance were included in this study. Within each ethnicity, the prevalence of PCD due to each gene was then summed. Based on the estimate that roughly 65% of individuals with PCD will have biallelic disease-causing variants in one the genes analyzed5, this sum was then divided by 0.65 to estimate the prevalence of PCD in each ethnicity.
Because numerous rare VUS are seen in many PCD genes, one concern was that large genes may be enriched for VUS and that many of these variants do not cause disease. This could in theory affect the order of genes calculated to be most commonly implicated in PCD among each ethnicity. Note that large genes could be enriched for both pathogenic variants and VUS. The prevalence of each gene in each ethnicity was divided by the number of coding nucleotides (Table 1), and this method was also used to study the genes most commonly causing PCD in each ethnicity.
Statistical Analyses
In this study, the 95% confidence intervals were calculated following the central limit theorem and the delta method32.
Data for variants analyzed in this study can be found on Mendeley: “Variant Data: The high global prevalence and ethnic heterogeneity of primary ciliary dyskinesia gene variants,” https://data.mendeley.com/datasets/nc3zm6v6cg/1.
Role of the funding source:
The funders at NIH nor Invitae did not have a role in the data collection, analysis, interpretation or writing of the manuscript.
Results
The estimated PCD prevalence, assuming HWE and accounting for inability to identify 35% of PCD-causing variants5, is shown in Table 3a and Table 3b. When excluding VUS (Table 3a), approximately 1 in 7554 individuals overall has PCD. This is a quite conservative estimate. Individuals of African ancestry have the greatest estimated prevalence, followed by non-Finnish European ancestry, East Asian ancestry, and Latino ancestry; bearing in mind that these estimates are based on genes identified in North American and European centers, PCD prevalence could be even higher in patients of African ancestry. When including VUS (Table 3b), the total prevalence calculations are likely over-estimates, as discussed below. When VUS are included, individuals of African/African American ancestry again appear most commonly affected, followed by individuals of non-Finnish European, Latino, and East Asian ancestries. Note that gnomAD also stratifies ethnicity by “other,” which is defined by individuals that did not cluster with any of the major ethnicities by a principle component analysis of informative single nucleotide polymorphisms. For thoroughness, data from the “Other Ethnicities” subgroup were included in Table 3a and Table 3b, although this group was excluded from Figure 2 since these individuals cannot be assigned to one of the major ethnic groupings. These analyses will need periodically to be refined as additional genes and additional pathogenic variants are defined, but they really represent the first evidence that PCD prevalence is substantially higher than previously quoted.
Table 3a.
Calculated prevalence of PCD in each ethnicity studied. Calculations are shown excluding VUS (pathogenic and likely pathogenic variants only). The prevalence estimate for all PCD is calculated based on the assumption that 65% of affected individuals have diagnostic variants in genes known to be implicated in PCD.
| Calculated Prevalence of PCD, Excluding VUS | ||||
|---|---|---|---|---|
| Ethnicity | Calculated PCD Prevalence for 29 Genes (95% CI) | Calculated PCD Prevalence for 29 Genes Combined (1 in) | Prevalence Estimate for All PCD (95% CI) | Prevalence Estimate for All PCD (1 in) |
| Overall | 8.60×10⁻⁵ (6.21×10⁻⁵, 1.10×10⁻⁴) | 11622 | 1.32×10⁻⁴ (9.55×10⁻⁵, 1.69×10⁻⁴) | 7554 |
| African/African American | 6.56×10⁻⁵ (1.85×10⁻⁵, 1.13×10⁻⁴) | 15241 | 1.01×10⁻⁴ (2.84×10⁻⁵, 1.73×10⁻⁴) | 9906 |
| Latino | 3.99×10⁻⁵ (5.68×10⁻⁶, 7.40×10⁻⁵) | 25090 | 6.13×10⁻⁵ (8.74×10⁻⁶, 1.14×10⁻⁴) | 16309 |
| Ashkenazi Jewish | 3.34×10⁻⁵ (0, 1.01×10⁻⁴) | 29948 | 5.14×10⁻⁵ (0, 1.56×10⁻⁴) | 19466 |
| East Asian | 4.45×10⁻⁵ (1.28×10⁻⁶, 8.77×10⁻⁵) | 22470 | 6.85×10⁻⁵ (1.96×10⁻⁶, 1.35×10⁻⁴) | 14606 |
| Finnish | 1.17×10⁻⁵ (0, 2.36×10⁻⁵) | 85711 | 1.79×10⁻⁵ (0, 3.63×10⁻⁵) | 55712 |
| Non-Finnish European | 6.26×10⁻⁵ (3.91×10⁻⁵, 8.60×10⁻⁵) | 15982 | 9.63×10⁻⁵ (6.02×10⁻⁵, 1.32×10⁻⁴) | 10388 |
| Other Ethnicities | 8.91×10⁻⁵ (0, 2.11×10⁻⁴) | 11223 | 1.37×10⁻⁴ (0, 3.24×10⁻⁴) | 7295 |
| South Asian | 4.01×10⁻⁵ (1.61×10⁻⁵, 6.40×10⁻⁵) | 24948 | 6.17×10⁻⁵ (2.48×10⁻⁵, 9.85×10⁻⁵) | 16216 |
Table 3b.
Calculated prevalence of PCD in each ethnicity studied. Calculations are shown including VUS. The prevalence estimate for all PCD is calculated based on the assumption that 65% of affected individuals have diagnostic variants in genes known to be implicated in PCD.
| Calculated Prevalence of PCD, Including VUS | ||||
|---|---|---|---|---|
| Ethnicity | Calculated PCD Prevalence for 29 Genes (95% CI) | Calculated PCD Prevalence for 29 Genes Combined (1 in) | Prevalence Estimate for All PCD (95% CI) | Prevalence Estimate for All PCD (1 in) |
| Overall | 5.10×10⁻³ (4.75×10⁻³, 5.45×10⁻³) | 196 | 7.84×10⁻³ (7.31×10⁻³, 8.38×10⁻³) | 127 |
| African/African American | 6.12×10⁻³ (5.11×10⁻³, 7.14×10⁻³) | 163 | 9.42×10⁻³ (7.85×10⁻³, 1.10×10⁻²) | 106 |
| Latino | 3.32×10⁻³ (2.73×10⁻³, 3.91×10⁻³) | 301 | 5.11×10⁻³ (4.20×10⁻³, 6.01×10⁻³) | 196 |
| Ashkenazi Jewish | 2.70×10⁻⁴ (7.89×10⁻⁵, 4.61×10⁻⁴) | 3706 | 4.15×10⁻⁴ (1.21×10⁻⁴, 7.09×10⁻⁴) | 2409 |
| East Asian | 3.46×10⁻³ (2.68×10⁻³, 4.24×10⁻³) | 289 | 5.32×10⁻³ (4.12×10⁻³, 6.52×10⁻³) | 188 |
| Finnish | 2.89×10⁻⁴ (1.87×10⁻⁴, 3.92×10⁻⁴) | 3457 | 4.45×10⁻⁴ (2.88×10⁻⁴, 6.02×10⁻⁴) | 2247 |
| Non-Finnish European | 3.66×10⁻³ (3.32×10⁻³, 4.00×10⁻³) | 273 | 5.63×10⁻³ (5.10×10⁻³, 6.15×10⁻³) | 178 |
| Other Ethnicities | 3.66×10⁻³ (2.34×10⁻³, 4.97×10⁻³) | 274 | 5.62×10⁻³ (3.60×10⁻³, 7.64×10⁻³) | 178 |
| South Asian | 2.22×10⁻³ (1.84×10⁻³, 2.60×10⁻³) | 450 | 3.42×10⁻³ (2.83×10⁻³, 4.00×10⁻³) | 293 |
Figure 2a and 2b:


VUS (variant of uncertain significance). In each ethnicity, the portion of PCD due to each of the five genes most commonly implicated in PCD is shown with each of the five genes assigned a color in the graphs. The portion of PCD due to all other evaluated PCD genes is shown in gray. Figure 2a includes only the pathogenic/likely pathogenic variants. Figure 2b includes all variants. As noted in the text, the “other” ethnic groups are not displayed in Figure 2a and 2b as these individuals are included in the overall cohort and cannot be considered a separate ethnic grouping. As can be seen in the tables, the other group unsurprisingly most closely mimics the overall prevalence.
The carrier frequencies and prevalence of PCD due to each individual gene is shown for each of the ethnicities studied. When excluding and including VUS, there is substantial ethnic variation in the PCD prevalence of genes most commonly associated with the disease (Figure 2). Further detail is provided in the supplemental tables: overall (Supplemental Table 1a and 1b), African/African American (Supplemental Table 2a and 2b), Latino (Supplemental Table 3a and 3b), Ashkenazi Jewish (Supplemental Table 4a and 4b), East Asian (Supplemental Table 5a and 5b), Finnish (Supplemental Table 6a and 6b), non-Finnish European (Supplemental Table 7a and 7b), South Asian (Supplemental Table 8a and 8b), and other ethnicities (Supplemental Table 9a and 9b). The genes are listed in order of highest carrier frequency and calculated prevalence of disease at the top row to the lowest carrier frequency and calculated prevalence of disease at the bottom row (Supplemental Tables 1–9).
Genes most commonly associated with PCD were also studied by dividing the prevalence by the number of coding nucleotides in the transcript. These data are also shown for each cohort: overall (Supplemental Table 10), African/African American ethnicity (Supplemental Table 11), Latino ethnicity (Supplemental Table 12), Ashkenazi Jewish ethnicity (Supplemental Table 13), East Asian ethnicity (Supplemental Table 14), Finnish ethnicity (Supplemental Table 15), non-Finnish European ethnicity (Supplemental Table 16), South Asian ethnicity (Supplemental Table 17), and other ethnicities (Supplemental Table 18). As HYDIN and additional genes are discovered and studied in more detail, these data will need to be further refined in the future.
Conclusions
There are five salient conclusions from our data, conclusions likely relevant to physicians in many specialties and across the globe. First, applying two large genetic databases, our calculations suggest that the global prevalence of having PCD - that is, two disease-causing alleles in a PCD gene - is likely higher than was previously estimated based either on population chest X-Ray studies or on provider surveys. Specifically, it is at least 1 in 7,554, and likely much greater than that. Because our calculations exclude many disease-causing variants in the genes studied (either because they are classified as VUS based on our current variant interpretations or because they were not identified by our methods), as well as recently identified and X-linked and autosomal dominant PCD genes, we think the prevalence – though certainly not as high as the estimate that includes VUS - is likely greater than that calculated in this analysis when excluding VUS. As noted in the introduction, past estimates of PCD prevalence in specific populations were less common than our analysis would suggest: approximately 1 in 11,000 in Norwegian individuals6, approximately 1 in 16,566 in Japanese individuals7, and varying prevalence among individuals in different European countries based on questionnaire data of clinical centers9. A more precise answer can be calculated in the future when VUS may have been reclassified and PCD-causing genes more comprehensively identified and studied. But we believe that it is important for the practitioner to know that PCD is likely substantially more common than was previously estimated.
Second, we show that the prevalence, by HWE, of carrying two disease-causing alleles in a PCD gene is generally higher in individuals of African descent than in most other populations. This has not previously been reported, and is in contrast to the predominantly Caucasian ancestry typical of patients with a similar condition, cystic fibrosis (CF). It is important for the general practitioner to know that patients who are of African descent (and individuals of other ethnicities) with features of CF, such as chronic rhinitis, sinusitis, chronic cough, recurring pneumonia, bronchiectasis and chronic otitis media, are at significant risk for having PCD.
These first two conclusions raise an important question: why is PCD not more commonly diagnosed? Three main possibilities could exist. First, PCD may be under-diagnosed because the diagnosis is challenging to make. Specialized PCD centers with availability of highly specialized tests (particularly including high-speed video microscopy in Europe33 and nasal nitric oxide measurement in North America34), as well as expertise in interpreting genetic testing and other relevant data, are normally required to make the diagnosis. These centers are not uniformly available across the globe, and when available, general practitioners may not be familiar with them. Thus, when CF and immunodeficiency studies are negative, the oto-sino-pulmonary infections and manifestations of heterotaxy are labeled “idiopathic” and not evaluated further in patients. Second, an unconscious bias may exist, particularly in North America, that work up of non-Caucasian patients is likely futile since a CF diagnosis is unlikely (especially in the newborn screen era) : an unifying diagnosis may simply not be considered. For example, Invitae estimates that only about 6% of its requisitions are for patients of African-American heritage. In fact, our data suggest that patients of non-European ancestry are precisely the patients to most likely need PCD workup, and we hope that our current work sheds light on this issue. Third, having two pathogenic PCD alleles may not always cause overt PCD. In the PCD literature to date, only symptomatic patients are studied. Our data suggest at least the possibility of incomplete penetrance.. Certain PLP variants in our analysis are substantially more prevalent than would be expected based on index case identification (note that the data surprisingly suggest that biallelic DNAH11 variants may be more common than biallelic DNAH5 variants, for instance). While this likely represents under-identification of affected patients, it could also be that individuals with two disease-causing variants are asymptomatic: that is, until our study, only data from patients with known disease have been queried.
We consider this possibility to be unlikely, however, because we have not been able to find any reports at all in the literature of an individual who is asymptomatic and has two disease-causing alleles. It is more likely that patients with PCD have been misclassified as not having PCD based on ciliary ultrastructural findings, which can be falsely negative in many patients, including those with biallelic DNAH11 variants.1,2,5.
The third conclusion is that the genes we traditionally think of as the leading causes of PCD appear to be heavily biased in favor of North American and European populations, from which most reports have stemmed. The distribution of prevalent genes in other populations is different,as noted previously35.Understanding genes most commonly causing PCD in different ethnicities provides vital information for families, physicians, and genetic counselors. The history of CF genetics provides insight into the future of PCD genetics. Certain variants, enriched in specific populations, are associated with more or less severe CF. A similar genotype-phenotype relationship is emerging in PCD genetics36,37, and it may become increasingly important to understand the gene – and thus severity - distribution in different populations. Further, being aware of the prevalence of these variants in specific populations has increased the likelihood of establishing a correct diagnosis in CF, and will likely do so in PCD. Finally, specific treatments have now been developed for specific CF genotypes, and it is anticipated that similar, genetically-directed treatments could be developed for PCD. In the future, however, our analyses will certainly need to be repeated as more genes and variants are identified.
Fourth, we believe that the approach we have taken could be readily adapted to studying the prevalence of other diseases. Our study was particularly difficult because of the large number of genes and VUSs, and similar studies may be simpler for conditions associated with variants in only one gene. Ultimately, as ethnic and geographic prevalence become apparent with these analyses, large databases may be queried for these purposes.
Finally, our data underscore the urgency of parsing out the clinical significance of VUS and of novel genes. This is of paramount importance to families with ambiguous genotypes. It is also important for population and prevalence studies applied to other disease genes. An approach we anticipate to aid interpretation of VUS includes matching of genomic data with phenotypic data through programs such as All of Us38. A reanalysis of these data in the coming years will enable a more comprehensive understanding of which VUS are disease-causing.
There are ;imitations of our analysis.. With additional evidence in the future, variants may be reclassified from VUS to pathogenic, which would be expected to increase the prevalence estimation, or variants could be reclassified from pathogenic or likely pathogenic to benign, which would ultimately decrease the prevalence estimation in this study. Although, consistent with ACMG/AMP recommendations, internal data indicate that less than 5% of PLP variants classified at Invitae are expected to be downgraded to VUS, likely benign or benign, while ~10% of VUS may be classified as pathogenic with new data. Additional limitations include: the paucity of copy number variant data in gnomAD for frequency calculations of this relatively common cause of Mendelian disease39;absence of recently discovered PCD genes included in this analysis; unknown effects of population bottlenecks; limited number of ethnicities included in the gnomAD database;and possible deviations of PCD from HWE assumptions, including an absence of natural selection or increased likelihood of embryonic lethality associated with biallelic PCD variants. Also, this study includes only 29 of the genes known to be associated with PCD;. Additionally, our calculations are based on our best estimate of what portion of PCD is due to biallelic variants in the genes analyzed based on available data5, and over time our understanding of the proportion of PCD related to these genes may improve.
In summary, we provide an in-depth analysis of the prevalence and carrier frequency for genes currently associated with PCD and frequently included on diagnostic next-generation sequencing panels for PCD. These estimates will likely change somewhat over time as variant classifications are updated and sequencing technology evolves to provide better detection of genetic variation. Overall, our study provides a foundation that could be applied to myriad conditions of genetic heterogeneity. It also demonstrates that PCD is likely about twice as common as was previously believed, that patients of non-Caucasian ethnicity are more commonly affected than were previously assumed, and that specific PCD gene variants are characteristic of specific ethnicities.
Supplementary Material
Research in context.
Evidence before this study:
The global prevalence of primary ciliary dyskinesia (PCD) is not well established, but is believed to be less than 1 in 10,000. We leveraged data from two large genetic databases to estimate prevalence among different ethnic groups and to study which genes most commonly have biallelic variants.
Added value of the study:
This study provides a minimum global prevalence estimate of PCD as 1 in approximately 7500 individuals. It not only demonstrates the pan-ethnic nature of PCD but also suggests that PCD may be more common than previously appreciated in some ethnicities, such as individuals of African and African American ancestry. This study shows that the genes most commonly implicated in PCD likely differ between different ethnicities.
Implications:
PCD is likely more common than previously recognized. This study brings to light the importance of genetic studies to evaluate molecular etiologies of PCD outside of Europe and North America and the importance of PCD diagnostic suspicion and care across the globe.
Acknowledgements:
Corresponding Author’s salary was supported by 1 P01 HL128192
Declaration of interests.
Dr. Hannah, unrelated to this reported work, receives support from the NIH Loan Repayment Program. Dr. Seifert reports other from Dr. Seifert reports other from Duke University School of Medicine, other from Medical Science and Computing, LLC, other from American College of Medical Genetics and Genomics (ACMG), outside the submitted work. Dr. Truty reports personal fees and other from Invitae outside the submitted work. Dr. Zariwala has salary support from research grants from NIH, outside the submitted work. Dr. Nykamp reports other from Invitae Corporation, during the conduct of the study; other from Invitae Corporation, outside the submitted work; being a stock holder of Invitae, which is a genetic testing provider and offers testing for Primary Ciliary Dyskinesia. Dr. Gaston received salary support from NIH grants, outside the reported work.
The authors acknowledge that they had full access to all the data and accept responsibility for the publication.
Footnotes
Publisher's Disclaimer: This is a PDF file of an unedited manuscript that has been accepted for publication. As a service to our customers we are providing this early version of the manuscript. The manuscript will undergo copyediting, typesetting, and review of the resulting proof before it is published in its final form. Please note that during the production process errors may be discovered which could affect the content, and all legal disclaimers that apply to the journal pertain.
References
- 1.Shapiro AJ, Davis SD, Polineni D, et al. Diagnosis of primary ciliary dyskinesia. An official American Thoracic Society clinical practice guideline. Am J Respir Crit Care Med. 2018; 197(12): e24–e39. [DOI] [PMC free article] [PubMed] [Google Scholar]
- 2.Shapiro AJ, Zariwala MA, Ferkol T, et al. Diagnosis, monitoring, and treatment of primary ciliary dyskinesia: PCD Foundation consensus recommendations based on state of the art review. Pediatr Pulmonol. 2016; 51(2): 115–132. [DOI] [PMC free article] [PubMed] [Google Scholar]
- 3.Lucas JS, Barbato A, Collins SA, et al. European Respiratory Society guidelines for the diagnosis of primary ciliary dyskinesia. Eur Respir J. 2017; 49(1): 1601090. [DOI] [PMC free article] [PubMed] [Google Scholar]
- 4.Zariwala MA, Knowles MR, Leigh MW. Primary Ciliary Dyskinesia. 2007. Jan 24 [Updated 2019 Dec 5]. In: Adam MP, Ardinger HH, Pagon RA, et al. , editors. GeneReviews® [Internet]. Seattle (WA): University of Washington, Seattle; 1993–2019. Available from: https://www.ncbi.nlm.nih.gov/books/NBK1122/ [PubMed] [Google Scholar]
- 5.Knowles MR, Daniels LA, Davis SD, Zariwala MA, Leigh MW. Primary ciliary dyskinesia. Recent advances in diagnostics, genetics, and characterization of clinical disease. Am J Respir Crit Care Med. 2013; 188(8): 913–922. [DOI] [PMC free article] [PubMed] [Google Scholar]
- 6.Torgersen J. Situs inversus, asymmetry, and twinning. Am J Hum Genet. 1950; 2(4): 361–370. [PMC free article] [PubMed] [Google Scholar]
- 7.Katsuhara K, Kawamoto S, Wakahayashi T, Belsky JL. Situs inversus totalis and Kartagener’s Syndrome in a Japanese Population. Chest. 1972; 61(1): 56–61. [DOI] [PubMed] [Google Scholar]
- 8.Torgersen J. Transposition of viscera, bronchiectasis and nasal polyps; a genetical analysis and a contribution to the problem of constitution. Acta Radiol. 1947; 28:17–24 [PubMed] [Google Scholar]
- 9.Kuehni CE, Frischer T, Strippoli M-PF, et al. Factors influencing age at diagnosis of primary ciliary dyskinesia in European children. Eur Respir J. 2010; 36(6): 1248–1258. [DOI] [PubMed] [Google Scholar]
- 10.Hornef N, Olbrich H, Horvath J, et al. DNAH5 mutations are a common cause of primary ciliary dyskinesia with outer dynein arm defects. Am J Respir Crit Care Med. 2006; 174: 120–126. [DOI] [PMC free article] [PubMed] [Google Scholar]
- 11.Failly M, Bartolini L, Letourneau A, et al. Mutations in DNAH5 account for only 15% of a non-preselected cohort of patients with primary ciliary dyskinesia. J Med Genet. 2009; 46: 281–286. [DOI] [PubMed] [Google Scholar]
- 12.Djakow J, Svobodová T, Hrach K, Uhlík J, Cinek O, Pohunek P. Effectiveness of sequencing selected exons of DNAH5 and DNAI1 in diagnosis of primary ciliary dyskinesia. Pediatr Pulmonol. 2012; 47: 864–875. [DOI] [PubMed] [Google Scholar]
- 13.Kim RH, Hall DA, Cutz E, et al. The role of molecular genetic analysis in the diagnosis of primary ciliary dyskinesia. Ann Am Thorac Soc. 2014; 11(3): 351–359. [DOI] [PMC free article] [PubMed] [Google Scholar]
- 14.Knowles MR, Leigh MW, Carson JL, et al. Mutations of DNAH11 in patients with primary ciliary dyskinesia with normal ciliary ultrastructure. Thorax. 2012; 67: 433–441. [DOI] [PMC free article] [PubMed] [Google Scholar]
- 15.Zariwala MA, Leigh MW, Ceppa F, et al. Mutations of DNAI1 in primary ciliary dyskinesia: evidence of founder effect in a common mutation. Am J Respir Crit Care Med. 2006; 174: 858–866. [DOI] [PMC free article] [PubMed] [Google Scholar]
- 16.Failly M, Saitta A, Muñoz A, et al. DNAI1 mutations explain only 2% of primary ciliary dykinesia. Respiration. 2008; 76: 198–204. [DOI] [PubMed] [Google Scholar]
- 17.Blanchon S, Legendre M, Copin B. Delineation of CCDC39/CCDC40 mutation spectrum and associated phenotypes in primary ciliary dyskinesia. J Med Genet. 2012; 49: 410–416. [DOI] [PubMed] [Google Scholar]
- 18.Cindrić S, Dougherty GW, Olbrich H, et al. SPEF2- and HYDIN- mutant cilia lack the central pair-associated protein SPEF2, aiding primary ciliary dyskinesia diagnostics. Am J Respir Cell Mol Biol; 2020; 62(3): 382–396. [DOI] [PubMed] [Google Scholar]
- 19.Mani R, Belkacem S, Soua Z, et al. Primary ciliary dyskinesia gene contribution in Tunisia: Identification of a major Mediterranean allele. Hum Mutat; 2020; 41(1): 115–121. [DOI] [PubMed] [Google Scholar]
- 20.Shamseldin HE, Mogarri IA, Alqwaiee MM, et al. An exome-first approach to aid in the diagnosis of primary ciliary dyskinesia. Hum Genet; 2020: 139(10): 1273–1282. [DOI] [PubMed] [Google Scholar]
- 21.Fassad MR, Shoman WI, Morsy H, et al. Clinical and genetic spectrum in 33 Egyptian families with suspected primary ciliary dyskinesia. Clin Genet. 2020; 97(3): 509–515. [DOI] [PubMed] [Google Scholar]
- 22.Emiralioğlu N, Taşkiran EZ, Koşukcu C, et al. Genotype and phenotype evaluation of patients with primary ciliary dyskinesia: First results from Turkey. Pediatr Pulmonol. 2020; 55(2): 383–393. [DOI] [PubMed] [Google Scholar]
- 23.Ferkol TW, Puffenberger EG, Lie H, et al. Primary ciliary dyskinesia-causing mutations in Amish and Mennonite communities. J Pediatr. 2013; 163(2): 383–387. [DOI] [PMC free article] [PubMed] [Google Scholar]
- 24.Takeuchi K, Xu Y, Kitano M, et al. Copy number variation in DRC1 is the major cause of primary ciliary dyskinesia in the Japanese population. Mol Genet Genomic Med. 2020; 8(3): e1137. [DOI] [PMC free article] [PubMed] [Google Scholar]
- 25.Lanktree MB, Haghighi A, Guiard E, et al. Prevalence estimates of polycystic kidney and liver disease by population sequencing. J Am Soc Nephrol. 2018; 29(10): 2593–2600. [DOI] [PMC free article] [PubMed] [Google Scholar]
- 26.Gao J, Brackley S, Mann JP. The global prevalence of Wilson disease from next-generation sequencing data. Genet Med. 2019; 21(5): 1155–1163. [DOI] [PubMed] [Google Scholar]
- 27.De Andrade KC, Frone MN, Wegman-Ostrosky T, et al. Variable population prevalence estimates of germline TP53 variants: a gnomAD-based analysis. Hum Mutat 2019; 40(1): 97–105. [DOI] [PMC free article] [PubMed] [Google Scholar]
- 28.Nykamp K, Anderson M, Powers M, et al. Sherloc: a comprehensive refinement of the ACMG-AMP variant classification criteria. Genet Med. 2017; 19(10): 1105–1117. [DOI] [PMC free article] [PubMed] [Google Scholar]
- 29.Richards S, Aziz N, Bale S, et al. Standards and guidelines for the interpretation of sequence variants: a joint consensus recommendation of the American College of Medical Genetics and Genomics and the Association for Molecular Pathology. Genet Med. 2015; 17(5): 405–424. [DOI] [PMC free article] [PubMed] [Google Scholar]
- 30.Rehm HL. A new era in the interpretation of human genomic variation. Genet Med. 2017; 19(10): 1092–1095. [DOI] [PMC free article] [PubMed] [Google Scholar]
- 31.Karczewski KJ, Francioli LC, Tiao G, et al. The mutational constraint spectrum quantified from variation in 141,456 humans. Nature 2020; 581(7809): 434–443. [DOI] [PMC free article] [PubMed] [Google Scholar]
- 32.Chakraborty R, Srinivasan MR, Daiger SP. Evaluation of standard error and confidence interval of estimated multilocus genotype probabilities, and their implications in DNA forensics. Am J Hum Genet 1993; 52(1): 60–70. [PMC free article] [PubMed] [Google Scholar]
- 33.Rubbo B, Shoemark A, Jackson CL, et al. Accuracy of high-speed video analysis to diagnose primary ciliary dyskinesia. Chest 2019; 155(5): 1008–1017. [DOI] [PubMed] [Google Scholar]
- 34.Shapiro AJ, Josephson M, Rosenfeld M, et al. Accuracy of nasal nitric oxide measurement as a diagnostic test for primary ciliary dyskinesia. A systematic review and meta-analysis. Ann Am Thorac Soc 2017; 14(7): 1184–1196. [DOI] [PMC free article] [PubMed] [Google Scholar]
- 35.Fassad MR, Patel MP, Shoemark A, et al. Clinical utility of NGS diagnosis and disease stratification in a multiethnic primary ciliary dyskinesia cohort. J Med Genet 2020; 57(5): 322–330. [DOI] [PubMed] [Google Scholar]
- 36.Davis SD, Rosenfeld M, Lee H, et al. Primary ciliary dyskinesia: longitudinal study of lung disease by ultrastructure defect and genotype. Am J Respir Crit Care Med 2019; 199(2): 190–198. [DOI] [PMC free article] [PubMed] [Google Scholar]
- 37.Shoemark A, Rubbo B, Legendre M, et al. Topological data analysis reveals genotype-phenotype relationships in primary ciliary dyskinesia. Eur Respir J 2021; Online ahead of print. [DOI] [PubMed] [Google Scholar]
- 38.All of Us Research Program Investigators; Denny JC, Rutter JL, et al. The “All of Us” research program. N Engl J Med 2019; 381(7): 668–676. [DOI] [PMC free article] [PubMed] [Google Scholar]
- 39.Truty R, Paul J, Kennemer M, et al. Prevalence and properties of intragenic copy-number variation in Mendelian disease genes. Genet Med 2019; 21(1): 114–123. [DOI] [PMC free article] [PubMed] [Google Scholar]
- 40.Merveille A-C, Davis EE, Becker-Heck A, et al. CCDC39 is required for assembly of inner dynein arms and the dynein regulatory complex and for normal ciliary motility in humans and dogs. Nat Genet 2011; 43(1): 72–78. [DOI] [PMC free article] [PubMed] [Google Scholar]
- 41.Fedick AM, Jalas C, Treff NR, Knowles MR, and Zariwala MA. Carrier frequencies of eleven mutations in eight genes associated with primary ciliary dyskinesia in the Ashkenazi Jewish population. Mol Genet Genomic Med 2015; 3(2): 137–142. [DOI] [PMC free article] [PubMed] [Google Scholar]
Associated Data
This section collects any data citations, data availability statements, or supplementary materials included in this article.