

Abstract
It is of great theoretical significance and practical value to establish a fast and accurate detection method for particle size of rock fragmentation. This study introduces the Phansalkar binarization method, proposes the watershed seed point marking method based on the solidity of rock block contour, and forms an adaptive watershed segmentation algorithm for blasted rock piles images based on rock block shape, which is to better solve the problem of incorrect segmentation caused by adhesion, stacking and blurred edges in blasted rock images. The algorithm first obtains the binary image after image pre-processing and performs distance transformation; then by selecting the appropriate gray threshold, the adherent part of the distance transformation image, i.e., the adherent rock blocks in the blasted rock image, is segmented and the seed points are marked based on the solidity of the contour calculated by contour detection; finally, the watershed algorithm is used to segment. The area cumulative distribution curve of the segmentation result is highly consistent with the manual segmentation, and the segmentation accuracy was above 95.65% for both limestone and granite for rock blocks with area over 100 cm2, indicating that the algorithm can accurately perform seed point marking and watershed segmentation for blasted rock image, and effectively reduce the possibility of incorrect segmentation. The method provides a new idea for particle segmentation in other fields, which has good application and promotion value.
Subject terms: Civil engineering, Petrology
Introduction
Blasting is widely used in mining and civil engineering due to its economy and efficiency1–5. As an important technical indicator of blasting effectiveness, blasted block size distribution directly affects the cost and efficiency of subsequent shoveling, crushing and grinding processes, and also provides a necessary basis for blasting parameter optimization6–10. Therefore, it is of theoretical significance and practical value to establish a fast and accurate detection method for particle size of rock fragmentation to guide blasting construction and improve blasting efficiency. Blasted rock piles are characterized by large scale, serious adhesion and irregularly shaped rock clumps, large differences in particle size, and small differences in grayness, which make it difficult to accurately measure the particle size of blasted rocks11,12. The existing measurement methods can be summarized into two categories: three-dimensional (3D) point cloud data segmentation measurement and two-dimensional (2D) image segmentation measurement. The 3D point cloud data is mainly obtained using 3D laser scans or a large number of high-resolution digital photos taken by Unmanned Aerial Vehicle (UAV)13,14. Han and Song15 used stereophotogrammetry for 3D modeling of blasted rock piles to obtain surface block dimensions and corrected for errors in rock fast due to stacking by indoor tests, and validated the applicability of the method in small-scale tests in the field. Although the creation of point cloud data using stereophotogrammetry is more effective and cheaper, the large number of images received takes a lot of time to process and convert into point cloud data16. 3D laser scanners are widely used in mine surveying due to its directly, quickly and captures 3D geometry in detail17–21. Engin et al.22 used a 3D laser scanner to obtain a 3D view of a rock piles of about 13 cm and used morphological methods to determine the position of the rock block and to correct the surface of the rock block, and finally used nonlinear order statistical filtering and histogram analysis to determine the blasted block size distribution of the rock piles, and by comparing the results of image analysis, the results obtained using this method were proved to be sufficiently reliable and accurate. Wang et al.23 used 3D laser scanning technology to obtain blasted rock piles point cloud data, and used the Voxel Cloud Connectivity Segmentation algorithm improved by discrete features to solve the influence of point clouds on the surface of small particles of ore on block recognition, and used the Locally Convex Connected Patches algorithm improved by plane fitting to solve the problem of over-segmentation of large rock blocks, and verified the generality and accuracy of the method by comparing the number of rock blocks. The methods for rock segmentation measurement of 3D point cloud data are mainly clustering analysis or converting point cloud data into similar 2D images and then using 2D image segmentation methods21,23,24. Compared with the 2D image rock segmentation measurement method, its main advantage is the high accuracy of the obtained point cloud data, but due to the expensive 3D laser scanner and the need for professional software for pre-processing, it cannot be widely used.
The 2D image segmentation measurement method has been used for nearly 30 years, which is currently the most used method for blasting fragmentation size measurement. Researchers studying and applying this method have also developed various commercial software, such as Wipfrag and Gold Size developed in Canada, Split and Cias developed in the United States, Ipacs and Kth developed in Sweden, Fragscan developed in France, Tucips developed in Germany, Power Sieve developed in Australia, and India developed Fragalyst 3.0, of which Wipfrag and Split are the most commonly used commercial software25–30. According to different principles, image segmentation methods are divided into four main categories: threshold segmentation, region segmentation, edge segmentation, and artificial neural network segmentation methods31–37. Among them, the most applied methods in rock segmentation are region and artificial neural network segmentation methods. Li et al.38 used the GAN-Unet model to segment images on the ore delivery belt, and the results showed that the method can reduce the problems of unclosed edges, over-segmentation, and under-segmentation, and improve the graph segmentation accuracy. Liu et al.39 first extracted the contour of the conveyor belt ore image using the U-Net model and binarized the image, and then used the Res_UNet model for contour optimization. The results of segmentation show that the model based on U-Net and Res_UNet is more suitable for conveyor belt ore image segmentation compared with the watershed algorithm and the U-Net model without contour optimization. However, the training time of the Neural network for image segmentation method is extremely long, and the above study is aimed at the conveyor belt ore with small particle size differences, and whether it applies to the segmentation of large-scale blasted rock blocks with large particle size differences needs to be studied. Yang et al.40 adopt a new affinity image construction model to improve the superpixel image segmentation technique for rock block segmentation. DexiNed edge detection network was introduced by Li et al.41, and implemented rock block segmentation using morphological transformation and watershed algorithm to avoid the influence of noise in binary images on rock block segmentation. Li et al.42 adopt binarization of rock block images using the U-Net model and segmentation of cohesive rock blocks using the watershed algorithm to solve the mis-segmentation of rock blocks caused by small differences in rock block grayness, and the results showed that the method is high robustness and high accuracy.
The watershed algorithm is widely used for rock particle image segmentation because of its good response to weak edges43,44. Ma et al.45 introduced an improved algorithm based on distance transform and morphological gradient. The result proved that the method is effective, accurate and rapid, which basically meets the requirements of unsupervised automatic acquisition of ore granularity parameters. Yao et al.46 improved the watershed algorithm using local minimum with threshold, effectively segmenting adhesive grains while avoiding over-segmentation.
To realize the accurate and rapid segmentation of blasted rock block image, the image pre-processing process and the impact on the segmentation results are studied first in this study, and then the causes of redundant seed points generated by the watershed algorithm in the process of blasted rock block image segmentation are analyzed. To explore the new automatic marking method of seed points, the shape characteristics of blasted rock blocks are analyzed and introduced into the watershed algorithm, a seed point marking method based on the solidity of rock block contours is proposed, and finally, an adaptive segmentation algorithm for blasted rock blocks based on block shapes is proposed based on the distance-based optimized watershed algorithm. The important contributions of this study are as follows.
Blasted rock block contours have a high solidity.
An automatic seed point marking method based on the solidity of rock block contour is proposed.
An adaptive segmentation algorithm for blasted rock blocks based on block shapes is proposed.
Image acquisition
Limestone quarries and granite quarries located in Huizhou, China were selected for the study, are both operated by Guangdong Xiyuan Blasting Technology Co., Ltd. Therefore, the blasting design parameters are the same, except for the charge quantity. The step height of the quarry is about 12, the diameter of the gun hole is 140 mm, using a digital electronic detonator to hole-by-hole detonation. Figures 1 and 2 show the 3D images established by aerial photography of a limestone quarry and a granite quarry after a certain blast using a UAV, respectively.
Figure 1.
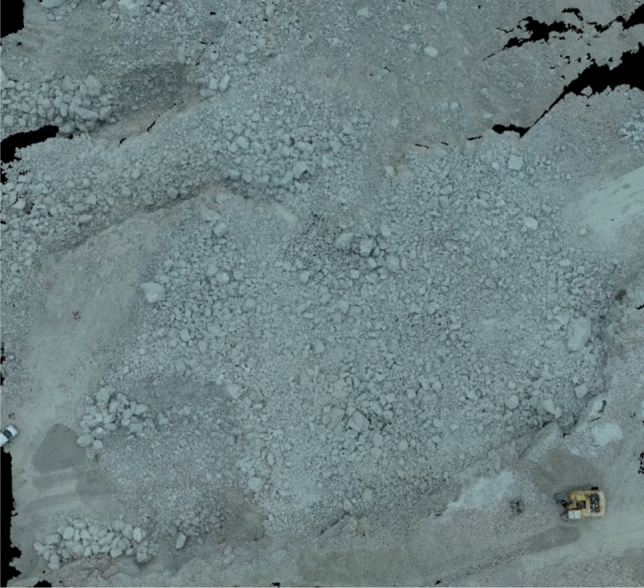
3D view of limestone quarry after blasting.
Figure 2.
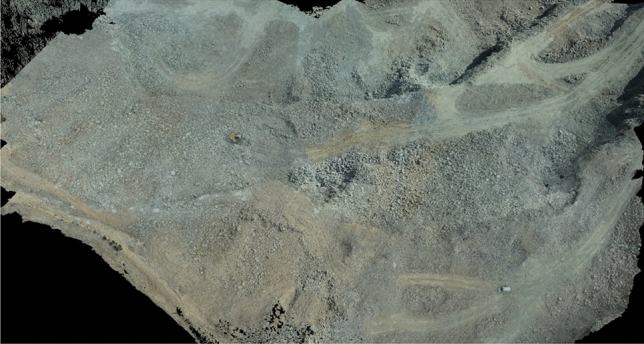
3D view of granite quarry after blasting.
The UAV used the DJI Phantom 4 RTK, which is equipped with a multi-frequency and multi-system RTK module. The camera is synchronized with the RTK module -level time to provide real-time -level positioning data without the need to deploy image control points. The UAV is equipped with a high-precision anti-shake tripod head camera that supports up to 20 megapixels of still photo shooting. To avoid errors caused by rock block overlap, image acquisition of blasted rock piles is performed using tilt photogrammetry, where the camera orientation is perpendicular to the blasted rock piles surface. Figure 3 shows the flight schematic of the UAV. Firstly, determined point A, B and C. Then, the outward expansion was carried out from point C to A and B respectively until the flight range completely covered the rock piles, and the UAV automatically planned the flight route according to the overlap rate. To ensure clarity in images, the flight altitude was set to 25, which is the minimum flight altitude of the UAV. The collected images of limestone and granite blasting blocks are shown in Fig. 4.
Figure 3.
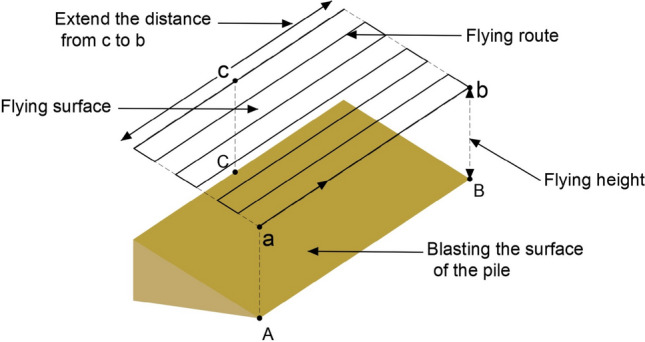
UAV flight image.
Figure 4.

Blasted rock images acquired by UAV.
Proposed methods
Image pre-processing
Due to the more complex and dustier environment of the quarry, there is more serious noise in the images of blasted rock piles collected through the camera, and the rock piles are heavily stacked and adhered to each other, with small background difference degree and inconspicuous color information. To effectively segment the rock blocks, pre-processing is required for the blast rock piles images. There are many methods of image pre-processing47,48, and this study adopts the more commonly used methods in the field of rock segmentation. Firstly, the grayscale image is de-noising by bilateral filtering. Secondly, the rock block edges are made more visible by limiting the contrast adaptive histogram equalization, then the image is binarized using the Phansalkar method49 based on local image properties. Finally, the binary image is morphologically optimized and area filtered. Figure 5 shows the effect of limestone blasting rock block image after pre-processing.
Figure 5.

Image pre-processing effect of limestone blasting block.
The Phansalkar method49 is an adaptive local thresholding method based on local image properties, which processes each pixel in an image by considering a window with the pixel as the center on that window with a grayscale mean is and standard deviation is , then the local threshold for the pixel is:
| 1 |
where and are constants. The Phansalkar method is flexible in that it determines the selection of the threshold value based on the magnitude of the local mean and the standard deviation, and by adjusting the values of the parameters , and , different processing results are obtained. the processing effects are shown in Fig. 5c.
To show indicate the effectiveness, the method is compared with the Otsu method50, and the results of the processing of Fig. 5b using the Otsu method are given in Fig. 6, from which it can be seen that the Otsu method produces three kinds of errors: (1) incorrectly dividing regions into backgrounds, such as darker regions and zones obscured by shadows; (2) incorrectly dividing small rocks into backgrounds; (3) dividing part of the inner regions of large rocks into backgrounds. Some of the error areas are shown in the red box part of the image, which can seriously affect the subsequent rock identification. The Phansalkar method can accurately distinguish the background from the rock particles with satisfactory results.
Figure 6.

Otsu method image binarization.
Figure 5d shows the binary image of the blasted rock piles after morphological optimization. Comparing this image with Fig. 5c, we can see that morphological optimization can eliminate the small “holes” and noise points in the binary image and smooth the target edges, but some of them still cannot be completely removed. Figure 5e uses the area filtering elimination method to achieve more satisfactory results, but there are still some noise points, which affect the rock segmentation. When the area threshold increases, it causes some edges to be removed. As in the red box in Fig. 5d, small rock block contour are eliminated, which has an impact on the segmentation results.
Principle of watershed segmentation algorithm based on distance transformation
The principle of the watershed algorithm is to visualize an image as a 3D topographic image34. In the terminology of “topography”, three types of points are considered. In Fig. 7: ① a local min point (min value surface), which corresponds to the lowest point of a basin; ② points at other locations in the basin; ③ points at the edge of the basin, where the basin meets other basins. For a specific regional minimum, the set of points meeting condition ② is called the catchment basin or watershed for that minimum, and the points meeting condition ③ form the front line of the ground called the division line or watershed line. The main goal of the algorithm is to find the watershed line, which is the contour of the rock block image. Assuming that a hole is punched at the minimum of each area, we let the water pass through the hole to flood the entire terrain at a uniform rate. As the water rising in the different catchment basins aggregates, a dam is built to stop this aggregation until the water floods the highest point of the topographic image, and the boundaries of these dams are the dividing lines of the watershed.
Figure 7.
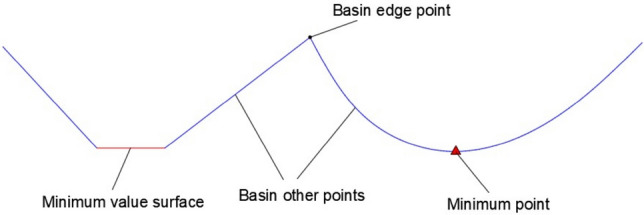
2D topographic image of watershed.
The traditional watershed algorithm is usually marker less segmentation, and the input object is a gradient image, which is based on the luminance change, and it only reflects the edge information of the image, which will result in unreasonable segmentation because of its noise-sensitive feature, leading to the following disadvantages of the watershed algorithm: ① the noise in the original image causes the segmentation contour shift; ② the image with low contrast, the contour of the target region is easily lost when segmenting; ③ there are many meaningless local minima in the image. Therefore, the most common practice is to perform a distance transformation on the binary image.
The distance from each pixel in a binary image to its nearest zero-valued pixel is called the distance transform51. Suppose a binary image I with a target set O and a background set B and a distance image D. The distance transformation is defined as in Eq. (2).
| 2 |
The Euclidean distance is generally chosen as the . The calculation method is as follows:
| 3 |
Defects of watershed segmentation algorithm based on distance transformation
Figure 8 gives the distance transformed image of the binary image of the blasted rock piles. From Fig. 8b, the distance image of the binary image is similar to image skeletonization and still retains the general shape.
Figure 8.

Distance transformation.
Figure 9 shows the distance transformation detail image and seed point image of a rock block, where (a) is a rock block in the image; (b) is the distance transformation image; (c) is the local extreme value point (seed point). From Fig. 9c, it can be seen that there are multiple extreme value points, i.e., redundant seed points, in the center of the block (in the red box), which will cause more serious over-segmentation, and there are also more extreme value points in the sticky part of the two blocks (in the yellow box), which seriously affects the segmentation effect of the adhesion block.
Figure 9.

Detailed image of distance transformation and seed point image of rock block.
For this problem, the commonly used methods are mainly to merge adjacent maximal points and merge expanded maximal points. But as shown in Fig. 9c, the distance between the maximal points inside the rock block and the maximal points in the adhering part of the rock block is large. The above method is difficult to achieve accurate merging. Moreover, for the complex image, the distribution of the maximal points is irregular, and the above maximum point elimination method is less effective.
Solidity of rock block contour
In the segmentation process of some special adherent objects, such as adherent cells, spherical particles, etc., some prior knowledge, such as the color of cell nuclei, shape of spherical particles and others, can be used in turn to correct the seed points. However, for the segmentation of blasted rock block, there is no a priori knowledge available other than the shape, and the shape of blasted rock block is irregular polygons. To investigate the rule of blasted rock block shape, this study performs manual segmentation of blasted rock images, as shown in Fig. 10.
Figure 10.

Manual segmentation image.
Statistical information of rock blocks, including area, contour convex hull, solidity of rock block, through image contour detection technology, and it should be noted that the solidity is the ratio of area to the contour convex hull. Due to the limitation of space and considering the large segmentation error of small rocks, only part of the information of larger blocks is shown in Tables 1 and 2. The histograms of solidity distribution of limestone and granite blocks are shown in Figs. 11 and 12, respectively.
Table 1.
Limestone rock block information.
| Area cm2 | Convex hull cm2 | Solidity | Area cm2 | Convex hull cm2 | Solidity | Area cm2 | Convex hull cm2 | Solidity |
|---|---|---|---|---|---|---|---|---|
| 8910 | 9475 | 0.94 | 3039 | 3487 | 0.87 | 2157 | 2355 | 0.92 |
| 7463 | 8076 | 0.92 | 2949 | 3148 | 0.94 | 2138 | 2526 | 0.85 |
| 6989 | 7247 | 0.96 | 2879 | 3007 | 0.96 | 2119 | 2355 | 0.90 |
| 6582 | 7249 | 0.91 | 2849 | 3237 | 0.88 | 1977 | 2277 | 0.87 |
| 6072 | 6360 | 0.95 | 2824 | 2986 | 0.95 | 1975 | 2133 | 0.93 |
| 5588 | 5906 | 0.95 | 2733 | 2868 | 0.95 | 1969 | 2201 | 0.89 |
| 5506 | 5801 | 0.95 | 2624 | 2884 | 0.91 | 1938 | 2145 | 0.90 |
| 5362 | 6260 | 0.86 | 2585 | 2860 | 0.90 | 1920 | 2262 | 0.85 |
| 5325 | 5964 | 0.89 | 2575 | 2947 | 0.87 | 1914 | 2026 | 0.94 |
| 5008 | 5964 | 0.84 | 2554 | 2989 | 0.85 | 1902 | 2151 | 0.88 |
| 4254 | 4529 | 0.94 | 2536 | 2771 | 0.92 | 1867 | 2037 | 0.92 |
| 3984 | 4392 | 0.91 | 2484 | 2791 | 0.89 | 1854 | 2018 | 0.92 |
| 3748 | 4139 | 0.91 | 2389 | 2733 | 0.87 | 1840 | 2108 | 0.87 |
| 3725 | 3938 | 0.95 | 2355 | 2657 | 0.89 | 1831 | 2040 | 0.90 |
| 3646 | 3970 | 0.92 | 2332 | 2723 | 0.86 | 1825 | 1994 | 0.92 |
| 3607 | 3901 | 0.92 | 2331 | 2574 | 0.91 | 1780 | 1989 | 0.89 |
| 3365 | 3758 | 0.90 | 2247 | 2405 | 0.93 | 1779 | 2163 | 0.82 |
| 3328 | 3614 | 0.92 | 2241 | 2506 | 0.89 | 1767 | 1868 | 0.95 |
| 3286 | 3773 | 0.87 | 2195 | 2329 | 0.94 | 1765 | 2071 | 0.85 |
| 3238 | 3470 | 0.93 | 2162 | 2563 | 0.84 | 1751 | 1814 | 0.97 |
Table 2.
Granite rock block information.
| Area | Convex hull cm2 | Solidity | Area cm2 | Convex hull cm2 | Solidity | Area cm2 | Convex hull cm2 | Solidity |
|---|---|---|---|---|---|---|---|---|
| 10,296 | 10,877 | 0.95 | 3778 | 4394 | 0.86 | 2434 | 2742 | 0.89 |
| 10,053 | 11,500 | 0.87 | 3643 | 4383 | 0.83 | 2420 | 2548 | 0.95 |
| 9542 | 10,393 | 0.92 | 3587 | 4183 | 0.86 | 2320 | 2652 | 0.87 |
| 8577 | 9579 | 0.90 | 3553 | 3934 | 0.90 | 2313 | 2563 | 0.90 |
| 6889 | 7875 | 0.87 | 3369 | 3784 | 0.89 | 2301 | 2483 | 0.93 |
| 6340 | 7412 | 0.86 | 3090 | 3411 | 0.91 | 2298 | 2684 | 0.86 |
| 6226 | 7117 | 0.87 | 3063 | 3510 | 0.87 | 2241 | 2418 | 0.93 |
| 6218 | 7230 | 0.86 | 3061 | 3494 | 0.88 | 2241 | 2684 | 0.83 |
| 4701 | 4990 | 0.94 | 3021 | 3318 | 0.91 | 2220 | 2383 | 0.93 |
| 4640 | 5188 | 0.89 | 3009 | 3350 | 0.90 | 2204 | 2527 | 0.87 |
| 4583 | 5027 | 0.91 | 2991 | 3142 | 0.95 | 2203 | 2480 | 0.89 |
| 4535 | 4970 | 0.91 | 2957 | 3348 | 0.88 | 2193 | 2428 | 0.90 |
| 4486 | 4746 | 0.95 | 2841 | 3177 | 0.89 | 2178 | 2469 | 0.88 |
| 4374 | 5098 | 0.86 | 2822 | 3021 | 0.93 | 2178 | 2585 | 0.84 |
| 4292 | 4856 | 0.88 | 2818 | 3008 | 0.94 | 2149 | 2425 | 0.89 |
| 4192 | 4645 | 0.90 | 2776 | 3086 | 0.90 | 2125 | 2456 | 0.87 |
| 4090 | 4514 | 0.91 | 2629 | 2892 | 0.91 | 2107 | 2417 | 0.87 |
| 3984 | 4246 | 0.94 | 2569 | 2823 | 0.91 | 2093 | 2258 | 0.93 |
| 3812 | 4201 | 0.91 | 2492 | 2952 | 0.84 | 2086 | 2426 | 0.86 |
| 3783 | 4051 | 0.93 | 2449 | 2600 | 0.94 | 2054 | 2369 | 0.87 |
Figure 11.
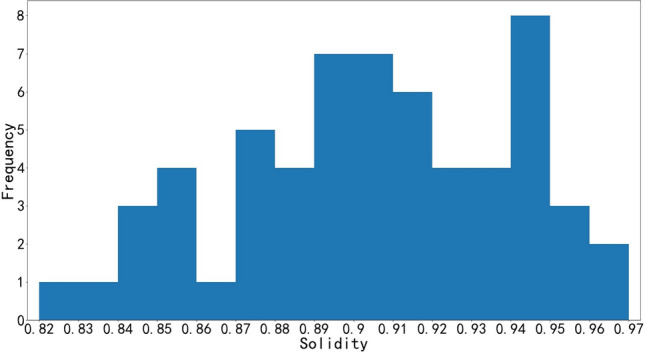
Histogram of limestone solidity distribution.
Figure 12.
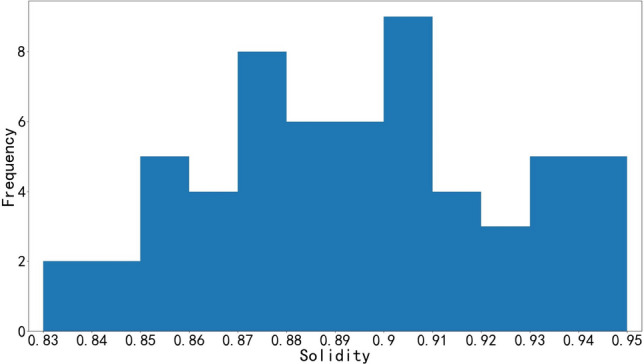
Histogram of granite solidity distribution.
From Fig. 11 can be seen in the graph of the larger rock solidity range of 0.82–0.97, mainly concentrated between 0.87 and 0.95; from Fig. 12 can be seen in the graph of the larger rock solidity range of 0.83–0.95, mainly concentrated between 0.85 and 0.95. The solidity of the contour of block is high, which can be concluded that the shape of the blasting rock blocks closes to convex polyhedron.
The seed point marking method based on the solidity of rock block contour
Based on the above study, the seed point marking method based on the solidity of rock block contour is proposed on the basis of the distance transformation optimized watershed algorithm. The method makes the adhesion part (that is, adherent rock blocks in the blasted rock image) in the distance transformation image segmented by selecting an appropriate gray threshold, and calculates the solidity by image contour detection technology, and marks it as a seed point if the contour solidity is greater than the set solidity threshold. As shown in Fig. 13, (a) is a 3D schematic image of the distance image, and the height is the gray value of the corresponding coordinate; (b1) is a 3D schematic image of the distance image when the gray threshold value is 50, and (b2) is its corresponding 2D cross-section; (c1) is a 3D schematic image of the distance image when the gray threshold value is 100, and (c2) is its corresponding 2D cross-section.
Figure 13.

3D schematic image of distance image and 2D cross-sectional image under different gray thresholds.
When the grayness threshold is too small, although smaller blocks can be split and seed point marked, more large rock blocks are not divided, as can be seen in Fig. 13b1,b2. And most of the contour solidity is less than the solidity threshold value, which does not work as seed points. It can be seen from Fig. 13c1,c2 that when the gray threshold is too large, only the large size rock blocks can be segmented. Due to the large size difference, a single gray threshold does not satisfy the seed point marking of rock blocks, so multiple gray thresholds need to be processed and the solidity is calculated for the contours in the 2D image after each gray threshold is processed. If it is greater than the solidity threshold, the interior of the contour is filled and marked as a seed point.
It should be noted that since this seed point marking method is based on the distance transform image, there may be two cases as follows: ① When the solidity of the contour of a background region in a binary image is too high, a depressed structure as in Fig. 14a will be formed in this background region after the distance transformation process, when the contour is taken using the gray threshold, a contour as in Fig. 14b will be formed, and the solidity of this contour is greater than the solidity threshold, which will cause wrong segmentation if the contour is marked as a seed point. ② As shown in the red marker in Fig. 15, this noise is caused by the wrong differentiation of Phansalkar. Obviously, morphological optimization and area filtering do not eliminate this noise, and the contour is smaller than the solidity threshold value. Therefore, when determining whether the contour is a seed point or not, it is necessary to determine whether there is a background area or noise within the contour, and if it exists, it is necessary to determine whether the contour is generated by the background area or noise.
Figure 14.

Recessed structure formed in the background area and 2D cross-sectional profile.
Figure 15.

Flow chart of the proposed rock image segmentation method.
The pseudo code of the seed point marking method based on the solidity of rock block contour is shown in steps 8–12 of algorithm 1.
The adaptive watershed algorithm based on the solidity of rock block contours
Achieving accurate segmentation of blasted rock images requires a complete process, which mainly consists of image denoising, histogram equalization, image binarization, morphological optimization, distance transform, seed point marking and watershed segmentation. Based on the above research, an adaptive watershed segmentation algorithm is proposed for blasted rock piles images based on the solidity of rock contours. The method performs adaptive segmentation based on the gray feature of blasted rock piles image and the rock contour features without any manual intervention. The process is shown in Fig. 15, and algorithm 1 shows the main steps of the adaptive watershed algorithm based on the solidity of rock block contours.
Experimental results and analysis
Seed point marking and segmentation results
Using the blasted rock block images of limestone and granite in Fig. 4 as the test objects, the applicability and accuracy of the adaptive watershed algorithm based on rock block contour solidity for blasted rock images are verified. Firstly, the images are preprocessed, and the binary images of limestone blasted rock is shown in Fig. 8a, and the binary images of granite blasted rock are shown in Fig. 16. Then the blasted rock images are segmented using the method proposed in this study. Figures 17, 18 and 19 show the effect of seed point labeling and segmentation with solidity threshold values of 0.8, 0.85, and 0.9, respectively.
Figure 16.

Granite blasted rock binary image.
Figure 17.

Blasted rock seed point marking effect and segmentation effect for a solidity threshold of 0.8.
Figure 18.

Blasted rock seed point marking effect and segmentation effect for a solidity threshold of 0.85.
Figure 19.

Blasted rock seed point marking effect and segmentation effect for a solidity threshold of 0.9.
Analysis of seed point marking results
From the seed point images in Figs. 17, 18 and 19, it can be seen that the seed point marking method based on the solidity of rock block contours can effectively mark the rock blocks, especially the larger ones. Comparing the seed point image of the blasted rock piles with its pre-processed binary image, it is found that the seed point marking method can avoid the effect of noise inside the binary image on the segmentation, as shown in the red box in Fig. 16. However, the method also has some problems.
Some of the severely adhered blocks are not separated, as shown in the red boxes in the seed point images of Figs. 17, 18 and 19. It can be seen from the image that the problem is likely to arise when a large block heavily adheres to a small block and the difference in grayscale is small, due to the result that there are no local minima in the small block after the distance transformation and that solidity of the contours formed by the small and large rock blocks during seed point marking is greater than the solidity threshold.
Multiple seed point markings were performed on some of the rock blocks, as shown in the yellow boxes in the seed point images of Figs. 17, 18 and 19. From the figures, it can be seen that the rock blocks with multiple seed points fall into two main categories: the presence of multiple faces and large surface undulations in the image, which, due to natural light, cause the presence of shadows on the back of the block or lower areas of the surface, which affect the seed point marking.
There are no seed point markers for some of the smaller size rock blocks, as shown in the green boxes in the seed point plots of Figs. 17, 18 and 19. The main reason for this problem is the elimination of the background in the area of smaller rock blocks during morphological optimization and area filtering.
By comparing the seed point images with different solidity thresholds, it can be found that with the increase of solidity threshold, the case of no segmentation of the adherent rock block gradually decreases, but the case of multiple seed point marking of the rock block gradually increases, so it is necessary to select a suitable solidity threshold for seed point marking of the rock block to achieve the best segmentation effect.
Analysis of image segmentation results of blasted rock piles
From the segmentation results in Figs. 17, 18 and 19, it can be seen that the adaptive watershed algorithm based on the solidity of rock block contours can achieve more accurate segmentation of the severely stacked and adhered blast rock images, especially the limestone blast rock images with less noise. In contrast, the segmentation effect of granite blast rock images is poor compared with that of limestone blast rock images due to the influence of rock block shadows and other problems. In order to evaluate the segmentation results with quantitative indexes, this study uses the manual segmentation image as the segmentation criterion to evaluate the segmentation effect of two blasted rock images, in which the manual segmentation image of limestone blasted rock is shown in Fig. 10a and the manual segmentation image of granite blasted rock is shown in Fig. 10b.
Figure 20 show the cumulative distribution curves of the area of rock blocks in the images of limestone and granite blasted rock piles. The calculation formula is shown in Eq. (4).
| 4 |
where is the cumulative area ratio of rock blocks; is the sum of the areas of all identified rock blocks across the blasted rock image; and is the cumulative area of rock blocks in part of area classification.
Figure 20.

Cumulative area distribution curve.
As can be seen from Fig. 20, for rock segmentation of limestone blasted rock piles images, the agreement between the cumulative distribution curves of the area of the algorithm proposed in this study and the manual segmentation results gradually increases with the increase of the solidity threshold. but rock segmentation of granite blasted rock images becomes progressively worse as the solidity threshold increases. From Fig. 20c1, it can be seen that there are some differences in the segmentation results of limestone rocks with area ranges between 3600–4300 and 5500–6000 cm2. From Fig. 20a2, it can be seen that there are some differences in the segmentation results of granite rocks in the area range between 4000–5000 and 6000–7000 cm2, and the maximum area rock segmentation error is larger.
Table 3 gives a comparison of the three characteristic area parameters, , and , at different solidity thresholds, which represent the areas corresponding to cumulative area distribution percentages of 20%, 50%, and 80% respectively. As can be seen from the table, like the solidity threshold increases, the error for limestone gradually increases, while the and errors gradually decrease. The opposite is true for granite, where the error decreases with increasing solidity threshold, while the and errors gradually increase.
Table 3.
Three characteristic area parameters.
| Limestone | Granite | ||||||
|---|---|---|---|---|---|---|---|
| Manual segmentation | 354.2 | 1034.1 | 2580.7 | 325.7 | 1084.7 | 3050.5 | |
| Proposed algorithm segmentation | Solidity threshold = 0.8 | 349.9 | 1163.5 | 2927.0 | 335.4 | 1112.4 | 3136.5 |
| Relative error () | − 1.21 | 12.5 | 13.4 | 2.97 | 2.53 | 2.82 | |
| Solidity threshold = 0.85 | 340.2 | 1081.1 | 2689.5 | 329.3 | 1001.2 | 2651.8 | |
| Relative error () | − 3.95 | 4.55 | 4.22 | 1.11 | − 7.70 | − 13.07 | |
| Solidity threshold = 0.9 | 332.3 | 1020.8 | 2602.8 | 323.3 | 952.3 | 2556.9 | |
| Relative error () | − 6.18 | − 1.28 | 0.86 | − 0.74 | − 12.21 | − 16.18 | |
| Literature45 | 494.3 | 1324.5 | 3240.0 | 386.9 | 1178.4 | 2871.9 | |
| Relative error (%) | 39.55 | 28.08 | 25.55 | 18.79 | 8.64 | − 5.85 | |
| Literature46 | 296.9 | 917.1 | 2489.9 | 294.4 | 958.3 | 2582.5 | |
| Relative error (%) | − 16.18 | − 11.31 | − 3.52 | − 9.61 | − 11.65 | − 15.34 | |
Tables 4 and 5 give the comparison of the number of rocks in different area zones for the image segmentation of limestone and granite blasted rock piles, respectively, and it should be noted that only the number of rocks with an area of 100 cm2 or more is counted. As can be seen from Table 4, the accuracy of block segmentation for limestone blasted rock images above 100 cm2 is above 95.80%. with the increase of solidity threshold, the number of rocks in the 100–1000 interval gradually increases, and the rocks above 1000 cm2 are less affected by the solidity threshold. Table 5 shows that the accuracy of rock segmentation for granite blasted block images above 100 cm2 is above 95.65%, and the number of rocks in the 100–1000 cm2 interval gradually increases with the increase of solidity threshold, while the number of rocks above 1000 cm2 gradually decreases. This is mainly due to the fact that as the solidity threshold increases, the area of large rock seed points gradually decreases and even splits into multiple seed points, resulting in an increase in the number of small rocks and a decrease or no change in the number of large rocks in the segmentation result, as shown in the seed point marking images in Figs. 18 and 19.
Table 4.
The number of rock blocks in the image segmentation result of limestone blasted rock piles.
| 100–max | 100–1000 | 1000–3000 | 3000–max | ||
|---|---|---|---|---|---|
| Manual segmentation | 904 | 750 | 132 | 22 | |
| Proposed algorithm segmentation | Solidity threshold = 0.8 | 872 | 715 | 132 | 25 |
| Relative error () | − 3.54 | − 4.67 | 0.00 | 13.64 | |
| Solidity threshold = 0.85 | 915 | 761 | 131 | 23 | |
| Relative error () | 0.22 | 1.47 | − 0.76 | 4.55 | |
| Solidity threshold = 0.9 | 942 | 787 | 131 | 24 | |
| Relative error () | 4.20 | 4.93 | − 0.76 | 9.09 | |
| Literature45 | 780 | 604 | 148 | 28 | |
| Relative error (%) | − 13.2 | − 19.47 | 12.12 | 27.27 | |
| Literature46 | 978 | 833 | 124 | 21 | |
| Relative error (%) | 8.19 | 11.07 | − 6.06 | − 4.55 | |
Table 5.
The number of rock blocks in the image segmentation result of granite blasted rock piles.
| 100–max | 100–1000 | 1000–3000 | 3000–max | ||
|---|---|---|---|---|---|
| Manual segmentation | 1196 | 1006 | 156 | 34 | |
| Proposed algorithm segmentation | Solidity threshold = 0.8 | 1144 | 946 | 164 | 34 |
| Relative error () | − 4.35 | − 5.96 | 5.13 | 0.00 | |
| Solidity threshold = 0.85 | 1184 | 993 | 160 | 31 | |
| Relative error () | − 1.00 | − 1.29 | 2.56 | − 8.82 | |
| Solidity threshold = 0.9 | 1221 | 1033 | 158 | 30 | |
| Relative error () | 2.09 | 2.68 | 1.28 | − 11.76 | |
| Literature45 | 1161 | 950 | 178 | 33 | |
| Relative error (%) | − 2.93 | − 5.57 | 14.10 | − 2.94 | |
| Literature46 | 1301 | 1107 | 166 | 28 | |
| Relative error (%) | 8.78 | 10.04 | 6.41 | − 17.65 | |
Therefore, among the three solidity thresholds, the best solidity threshold interval for limestone blasted rock image segmentation is 0.85–0.9, the best solidity threshold interval for granite blasted rock image segmentation is 0.8–0.85, considering the cumulative area distribution curve, characteristic area parameters and the number of rock blocks. In general, the algorithm proposed in this paper is consistent with the manual segmentation results under the condition that a suitable solidity threshold is selected.
Comparison with current methods
To evaluate the performance of the algorithm proposed in this study, the algorithm was compared with two other watershed improvement methods for rock segmentation, as described in the literature45,46, respectively. Figures 21 and 22 show the segmentation results using the segmentation methods from the literature45,46, respectively. Figures 23 and 24 show the cumulative area distribution curve of the literature45,46 segmentation results, respectively. The three characteristic area parameters, , and , are shown in Table 3. The comparison of the number of rocks in different area for the segmentation of limestone and granite blasted rock images is shown in Tables 4 and 5, respectively.
Figure 21.

The segmentation effect using the segmentation method of the literature45.
Figure 22.

The segmentation effect using the segmentation method of the literature46.
Figure 23.

The cumulative area distribution curve for segmentation results in the literature45.
Figure 24.

The cumulative area distribution curve for segmentation results in the literature46.
As can be seen from Figs. 23a and 24a, the method of literature46 gives better results for limestone compared to the method of literature45, with cumulative area distribution curve over 1000 cm2 is more similar to the result of manual segmentation. As can be seen from Figs. 23b and 24b, the results of the method of literature45 are better than those of literature46 for granite. From Tables 3, 4 and 5, it can be seen that among the three segmentation methods, the method proposed in this study has the best segmentation results, and its segmentation results will be closer to the manual segmentation after selecting a suitable solidity threshold.
Conclusion
In this study, to avoid errors caused by rock block overlap, image acquisition of blasted rock piles is performed using tilt photogrammetry. Then, the accurate rock target area was obtained through the image pre-processing process. Finally, the binary image is segmented using the adaptive watershed segmentation algorithm of blasted rock image based on rock block shape. This method enables automatic segmentation of blasted rock piles rock blocks is achieved. We compared the performance of the proposed method with the manual sieving results and with three methods in the literature45,46. The main conclusions are as follows:
The pre-processing process of blasted rock image and its influence on the segmentation results are described, and the Phansalkar method is introduced. By comparing the results with the Otsu method, it is proved that the method is more applicable to the binarization of blasted rock images.
The principle of the watershed algorithm based on distance transformation is described, and the reasons why the algorithm is prone to serious over-segmentation are analyzed. The study revealed a high-solidity of the blasted rock block contour by analyzing the shape of blocks, a seed point marking method based on the solidity of rock block contours is proposed, and forms an adaptive watershed segmentation algorithm for blasted rock images based on block shapes. The algorithm solves the problem of mis-segmentation of blasted rock images caused by severe adhesion and large differences in particle size.
The algorithm can effectively mark the seed points of blasted rock blocks and avoid the effect caused by noise inside the rock blocks of binary images, the segmentation results are highly similar to the area cumulative distribution curve of the manual segmentation results, and the errors of the different indexes are smaller than the segmentation methods adopt in the literature45,46, which proves the effectiveness and superiority of the algorithm for rock block segmentation of blasted rock piles images.
The adaptive watershed algorithm based on the solidity of rock block contours proposed in this study considers the contour properties of rock blocks in the segmentation, resulting in a more significant improvement in segmentation accuracy. However, it should be acknowledged that the method requires different solidity thresholds for different block image segmentation to achieve the best segmentation results. In future research, solidity thresholds for more kinds of rock will be investigated and determined, making the proposed method more widely applied.
Acknowledgements
Financial support from National Natural Science Foundation of China (No. 50974076) and Postgraduate Scientific Research Innovation Project of Hunan Province (No. QL20210216) are greatly appreciated.
Author contributions
Q.G. and S.Y. designed the research. Q.G. performed image processing. Q.G. and Yuchen Wang wrote the manuscript. Z.X. provided research materials. All authors reviewed the manuscript.
Data availability
All data used to support the findings of this study are available from the corresponding author upon request.
Competing interests
The authors declare no competing interests.
Footnotes
Publisher's note
Springer Nature remains neutral with regard to jurisdictional claims in published maps and institutional affiliations.
Contributor Information
Qinpeng Guo, Email: 1516682242@qq.com.
Shijiao Yang, Email: 649292197@qq.com.
References
- 1.Qiu X, et al. Short-delay blasting with single free surface: Results of experimental tests. Tunn. Undergr. Space Technol. 2018;74:119–130. doi: 10.1016/j.tust.2018.01.014. [DOI] [Google Scholar]
- 2.Hu Y, Lu W, Chen M, Yan P, Yang J. Comparison of blast-induced damage between presplit and smooth blasting of high rock slope. Rock Mech. Rock Eng. 2014;47:1307–1320. doi: 10.1007/s00603-013-0475-7. [DOI] [Google Scholar]
- 3.Hu Y, Lu W, Wu X, Liu M, Li P. Numerical and experimental investigation of blasting damage control of a high rock slope in a deep valley. Eng. Geol. 2018;237:12–20. doi: 10.1016/j.enggeo.2018.01.003. [DOI] [Google Scholar]
- 4.Zeng Y, et al. Blast-induced rock damage control in Fangchenggang nuclear power station, China. J. Rock Mech. Geotech. Eng. 2018;10:914–923. doi: 10.1016/j.jrmge.2018.04.010. [DOI] [Google Scholar]
- 5.Eades RQ, Perry K. Understanding the connection between blasting and highwall stability. Int. J. Min. Sci. Technol. 2019;29:99–103. doi: 10.1016/j.ijmst.2018.11.016. [DOI] [Google Scholar]
- 6.Monjezi M, Amini Khoshalan H, Yazdian Varjani A. Optimization of open pit blast parameters using genetic algorithm. Int. J. Rock Mech. Min. Sci. 2011;48:864–869. doi: 10.1016/j.ijrmms.2011.04.005. [DOI] [Google Scholar]
- 7.Ozkahraman HT. Fragmentation assessment and design of blast pattern at Goltas limestone quarry, Turkey. Int. J. Rock Mech. Min. Sci. 2006;43:628–633. doi: 10.1016/j.ijrmms.2005.09.004. [DOI] [Google Scholar]
- 8.Kabwe E. Velocity of detonation measurement and fragmentation analysis to evaluate blasting efficacy. J. Rock Mech. Geotech. Eng. 2018;10:523–533. doi: 10.1016/j.jrmge.2017.12.003. [DOI] [Google Scholar]
- 9.Hamdi E, du Mouza J. A methodology for rock mass characterisation and classification to improve blast results. Int. J. Rock Mech. Min. Sci. 2005;42:177–194. doi: 10.1016/j.ijrmms.2004.07.005. [DOI] [Google Scholar]
- 10.Taji M, Ataei M, Goshtasbi K, Osanloo M. ODM: A new approach for open pit mine blasting evaluation. J. Vib. Control. 2013;19:1738–1752. doi: 10.1177/1077546312439911. [DOI] [Google Scholar]
- 11.Ouchterlony F. The case for the median fragment size as a better fragment size descriptor than the mean. Rock Mech. Rock Eng. 2016;49:143–164. doi: 10.1007/s00603-015-0722-1. [DOI] [Google Scholar]
- 12.Spathis AT. Discussion of “the case for the median fragment size as a better fragment size descriptor than the mean” by Finn Ouchterlony. Rock Mech. Rock Eng. 2016;49:335–337. doi: 10.1007/s00603-015-0878-8. [DOI] [Google Scholar]
- 13.Labati RD, Genovese A, Munoz E, Piuri V, Scotti F. 3-D granulometry using image processing. IEEE Trans. Ind. Inform. 2019;15:1251–1264. doi: 10.1109/TII.2018.2856466. [DOI] [Google Scholar]
- 14.Thurley MJ. Automated online measurement of limestone particle size distributions using 3D range data. J. Process Control. 2011;21:254–262. doi: 10.1016/j.jprocont.2010.11.011. [DOI] [Google Scholar]
- 15.Han JH, Song JJ. Statistical estimation of blast fragmentation by applying stereophotogrammetry to block piles. Int. J. Rock Mech. Min. Sci. 2014;68:150–158. doi: 10.1016/j.ijrmms.2014.02.010. [DOI] [Google Scholar]
- 16.Jang H, et al. Development of 3D rock fragmentation measurement system using photogrammetry. Int. J. Mining Reclam. Environ. 2020;34:294–305. doi: 10.1080/17480930.2019.1585597. [DOI] [Google Scholar]
- 17.Thurley, M. J. Automated image segmentation and analysis of rock piles in an open-pit mine. In 2013 Int. Conf. Digit. Image Comput. Tech. Appl. DICTA 2013, 1–8. 10.1109/DICTA.2013.6691484 (2013).
- 18.Feng Q, Röshoff K. In-situ mapping and documentation of rock faces using full-coverage 3D laser scanning techniques. Int. J. Rock Mech. Min. Sci. 2004;41:379. doi: 10.1016/j.ijrmms.2003.12.104. [DOI] [Google Scholar]
- 19.Lato M, Kemeny J, Harrap RM, Bevan G. Rock bench: Establishing a common repository and standards for assessing rockmass characteristics using LiDAR and photogrammetry. Comput. Geosci. 2013;50:106–114. doi: 10.1016/j.cageo.2012.06.014. [DOI] [Google Scholar]
- 20.Salvini R, Francioni M, Riccucci S, Bonciani F, Callegari I. Photogrammetry and laser scanning for analyzing slope stability and rock fall runout along the Domodossola-Iselle railway, the Italian Alps. Geomorphology. 2013;185:110–122. doi: 10.1016/j.geomorph.2012.12.020. [DOI] [Google Scholar]
- 21.Onederra I, Thurley MJ, Catalan A. Measuring blast fragmentation at Esperanza mine using high-resolution 3D laser scanning. Trans. Inst. Min. Metall. Sect. A Min. Technol. 2015;124:34–46. [Google Scholar]
- 22.Engin IC, Maerz NH, Boyko KJ, Reals R. Practical measurement of size distribution of blasted rocks using LiDAR scan data. Rock Mech. Rock Eng. 2020;53:4653–4671. doi: 10.1007/s00603-020-02181-5. [DOI] [Google Scholar]
- 23.Wang Y, Tu W, Li H. Fragmentation calculation method for blast muck piles in open-pit copper mines based on three-dimensional laser point cloud data. Int. J. Appl. Earth Obs. Geoinf. 2021;100:102338. [Google Scholar]
- 24.Campbell AD, Thurley MJ. Application of laser scanning to measure fragmentation in underground mines. Trans. Inst. Min. Metall. Sect. A Min. Technol. 2017;126:240–247. [Google Scholar]
- 25.Sanchidrián JA, Segarra P, Ouchterlony F, López LM. On the accuracy of fragment size measurement by image analysis in combination with some distribution functions. Rock Mech. Rock Eng. 2009;42:95–116. doi: 10.1007/s00603-007-0161-8. [DOI] [Google Scholar]
- 26.Siddiqui F, Shah S, Behan M. Measurement of size distribution of blasted rock using digital image processing. J. King Abdulaziz Univ. Sci. 2009;20:81–93. doi: 10.4197/Eng.20-2.4. [DOI] [Google Scholar]
- 27.Sudhakar J, Adhikari GR, Gupta RN. Comparison of fragmentation measurements by photographic and image analysis techniques. Rock Mech. Rock Eng. 2006;39:159–168. doi: 10.1007/s00603-005-0044-9. [DOI] [Google Scholar]
- 28.Engin, I. C. A practical method of bench blasting design for desired fragmentation based on digital image processing technique and Kuz-Ram model. In Rock Fragm. by Blasting—Proc. 9th Int. Symp. Rock Fragm. by Blasting, FRAGBLAST 9, 257–263 (2010).
- 29.Tosun A. A modified Wipfrag program for determining muckpile fragmentation. J. S. Afr. Inst. Min. Metall. 2018;118:1113–1119. doi: 10.17159/2411-9717/2018/v118n10a13. [DOI] [Google Scholar]
- 30.Latham JP, et al. A blind comparison between results of four image analysis systems using a photo-library of piles of sieved fragments. Fragblast. 2003;7:105–132. doi: 10.1076/frag.7.2.105.15899. [DOI] [Google Scholar]
- 31.Saxena LP. Niblack’s binarization method and its modifications to real-time applications: A review. Artif. Intell. Rev. 2019;51:673–705. doi: 10.1007/s10462-017-9574-2. [DOI] [Google Scholar]
- 32.Magnier B. Edge detection: A review of dissimilarity evaluations and a proposed normalized measure. Multimed. Tools Appl. 2018;77:9489–9533. doi: 10.1007/s11042-017-5127-6. [DOI] [Google Scholar]
- 33.Tariq N, Hamzah RA, Ng TF, Wang SL, Ibrahim H. Quality assessment methods to evaluate the performance of edge detection algorithms for digital image: A systematic literature review. IEEE Access. 2021;9:87763–87776. doi: 10.1109/ACCESS.2021.3089210. [DOI] [Google Scholar]
- 34.Haris K, Efstratiadis SN, Maglaveras N, Katsaggelos AK. Hybrid image segmentation using watersheds and fast region merging. IEEE Trans. Image Process. 1998;7:1684–1699. doi: 10.1109/83.730380. [DOI] [PubMed] [Google Scholar]
- 35.Cremers D, Rousson M, Deriche R. A review of statistical approaches to level set segmentation: Integrating color, texture, motion and shape. Int. J. Comput. Vis. 2007;72:195–215. doi: 10.1007/s11263-006-8711-1. [DOI] [Google Scholar]
- 36.Guo Y, et al. Deep learning for visual understanding: A review. Neurocomputing. 2016;187:27–48. doi: 10.1016/j.neucom.2015.09.116. [DOI] [Google Scholar]
- 37.Sun J, Su B. Coal-rock interface detection on the basis of image texture features. Int. J. Min. Sci. Technol. 2013;23:681–687. doi: 10.1016/j.ijmst.2013.08.011. [DOI] [Google Scholar]
- 38.Li H, Wang X, Yang C, Xiong W. Ore image segmentation method based on GAN-UNet. Control Theory Appl. 2021 doi: 10.7641/CTA.2021.00558. [DOI] [Google Scholar]
- 39.Liu X, Zhang Y, Jing H, Wang L, Zhao S. Ore image segmentation method using U-Net and Res_Unet convolutional networks. RSC Adv. 2020;10:9396–9406. doi: 10.1039/C9RA05877J. [DOI] [PMC free article] [PubMed] [Google Scholar]
- 40.Yang Z, Ding H, Guo L, Lian M. Superpixel image segmentation-based particle size distribution analysis of fragmented rock. IEEE Access. 2021;9:59048–59058. doi: 10.1109/ACCESS.2021.3072998. [DOI] [Google Scholar]
- 41.Li H, Asbjörnsson G, Lindqvist M. Image process of rock size distribution using dexined-based neural network. Minerals. 2021;11:1–13. [Google Scholar]
- 42.Li H, Pan C, Chen Z, Wulamu A, Yang A. Ore image segmentation method based on u-net and watershed. Comput. Mater. Contin. 2020;65:563–578. doi: 10.32604/cmc.2020.09806. [DOI] [Google Scholar]
- 43.Zhang GY, Liu GZ, Zhu H. Segmentation algorithm of complex ore images based on templates transformation and reconstruction. Int. J. Miner. Metall. Mater. 2011;18:385–389. doi: 10.1007/s12613-011-0451-8. [DOI] [Google Scholar]
- 44.Yang X, Ren T, Tan L. Size distribution measurement of coal fragments using digital imaging processing. Meas. J. Int. Meas. Confed. 2020;160:107867. doi: 10.1016/j.measurement.2020.107867. [DOI] [Google Scholar]
- 45.Ma, L., Zhang, Y., Song, G., Ma, Z. & Lu, T. Ore granularity detection and analysis system based on image processing. In Proc. 31st Chinese Control Decis. Conf. CCDC 2019, 359–366. 10.1109/CCDC.2019.8832862 (2019).
- 46.Qiang Y, Shunchao Q, Li H, Yang X, Li H. Infrared image-based identification method for the gradation of rock grains using heating characteristics. Constr. Build. Mater. 2020;264:120216. doi: 10.1016/j.conbuildmat.2020.120216. [DOI] [Google Scholar]
- 47.Zheng M, et al. Image dehazing by an artificial image fusion method based on adaptive structure decomposition. IEEE Sens. J. 2020;20:8062–8072. doi: 10.1109/JSEN.2020.2981719. [DOI] [Google Scholar]
- 48.Zhu Z, et al. A novel fast single image dehazing algorithm based on artificial multiexposure image fusion. IEEE Trans. Instrum. Meas. 2021;70:1–23. [Google Scholar]
- 49.Phansalkar, N., More, S., Sabale, A. & Joshi, M. Adaptive local thresholding for detection of nuclei in diversity stained cytology images. In ICCSP 2011—2011 Int. Conf. Commun. Signal Process, 218–220. 10.1109/ICCSP.2011.5739305 (2011).
- 50.Xue JH, Zhang YJ. Ridler and Calvard’s, Kittler and Illingworth’s and Otsu’s methods for image thresholding. Pattern Recognit. Lett. 2012;33:793–797. doi: 10.1016/j.patrec.2012.01.002. [DOI] [Google Scholar]
- 51.Cuisenaire O. Locally adaptable mathematical morphology using distance transformations. Pattern Recognit. 2006;39:405–416. doi: 10.1016/j.patcog.2005.07.009. [DOI] [Google Scholar]
Associated Data
This section collects any data citations, data availability statements, or supplementary materials included in this article.
Data Availability Statement
All data used to support the findings of this study are available from the corresponding author upon request.