

Abstract
Controlling microbial risks in cell therapy products (CTPs) is important for product safety. Here, we identified the nicotinic acid (NA) to nicotinamide (NAM) ratio as a biomarker that detects a broad spectrum of microbial contaminants in cell cultures. We separately added six different bacterial species into mesenchymal stromal cell and T cell culture and found that NA was uniquely present in these bacteria-contaminated CTPs due to the conversion from NAM by microbial nicotinamidases, which mammals lack. In cells inoculated with 1 × 10⁴ CFUs/mL of different microorganisms, including USP <71> defined organisms, the increase in NA to NAM ratio ranged from 72 to 15,000 times higher than the uncontaminated controls after 24 h. Importantly, only live microorganisms caused increases in this ratio. In cells inoculated with 18 CFUs/mL of Escherichia coli, 20 CFUs/mL of Bacillus subtilis, and 10 CFUs/mL of Candida albicans, significant increase of NA to NAM ratio was detected using LC-MS after 18.5, 12.5, and 24.5 h, respectively. In contrast, compendial sterility test required >24 h to detect the same amount of these three organisms. In conclusion, the NA to NAM ratio is a useful biomarker for detection of early-stage microbial contaminations in CTPs.
Keywords: cell therapy products, sterility test, microbial contamination, mass spectrometry, metabolomics, microbial biomarker, mesenchymal stromal cells, T cells
Graphical abstract
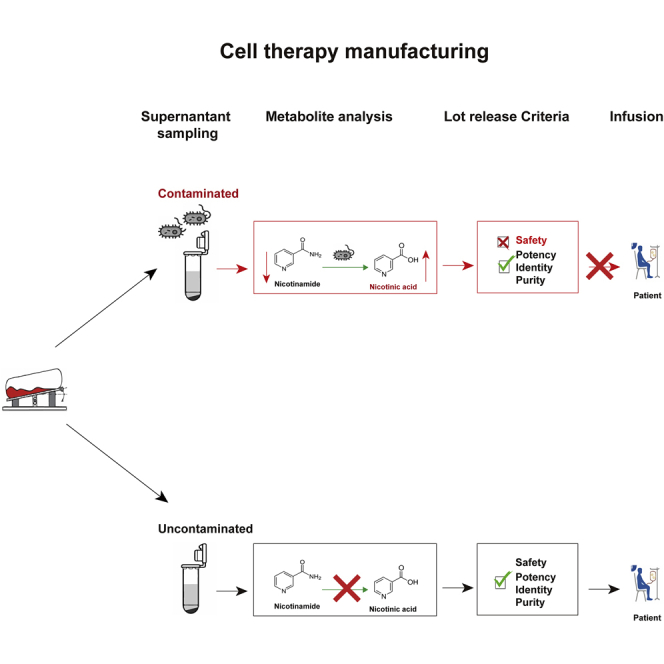
This study discovered a unique metabolite, nicotinic acid, which is presented in bacterially contaminated cell therapy products but is nearly undetectable in the uncontaminated cell medium. It can be used as a biomarker for identifying contaminations in cell therapy products, acting as a rapid, sensitive, and label-free sterility testing method.
Introduction
Advanced therapy medicinal products (ATMPs) are rapidly emerging as viable alternatives to treat a variety of diseases and conditions that are not effectively treated using small molecule or biologic therapies.1 Thus, cell therapies and gene-modified cell therapies are a key advance in treating such conditions. Over the past 30 years, chimeric antigen receptor T (CAR-T) cells have been developed for treating cancer of the hematopoietic system.2 Although the Food and Drug Administration (FDA) still refers to CAR-T therapies as gene therapies, because they involve modifying the genetic material of patients ex vivo, we will refer to therapies that rely on the delivery of living cells as cell therapy products (CTPs). Stem cell-based therapies have also been approved for therapeutic usage due to their proliferative potential and the ability to repair damaged tissues and treat degenerative diseases and cancer.3 Among these stem-cell-based therapies, mesenchymal stromal cells (MSCs) are the most clinically studied cell therapy platform worldwide due to their immune regulatory responses alongside their other stemness properties.4
Cell culture is vulnerable to contamination due to the use of nutrient media that can support the growth of microorganisms. CTPs hence present a significantly high risk of possible transmission of infectious agents from cells to patients.5 Reported rates of microbial contamination of various types of progenitor cell products or platelets range from 0.2% to 25%,6,7 and 12% contamination was found in an analysis of 32 stem cell lines and feeder cell lines.8 The most commonly reported contaminants are Mycoplasma spp., followed by fungal and bacterial contaminants.5 Coagulase-negative Staphylococcus spp. was the predominant bacterial species isolated from hematopoietic stem cell culture while Bacillus spp., Enterococcus spp., and Escherichia coli were also major contaminants of animal cell cultures.5,8, 9, 10 Pseudomonas aeruginosa, Klebsiella pneumoniae, and Acinetobacter baumannii were frequent contaminants in healthcare facilities, contributing to contamination during storage and handling.11, 12, 13, 14 To ensure the safety of CTPs prior to patient infusion, sterility testing is required in the manufacturing process and for the release of CTPs. United States Pharmacopeia (USP) chapter <63> details a compendial Mycoplasma testing method by culturing with an indicator cell line for detection, which has more recently been replaced by qPCR testing,15 and these rapid commercial kits are widely used. On the other hand, the culture-based methods remain the gold standard for sterility testing of CTPs, as regulated by USP <71>, which consists of direct inoculation and membrane filtration methods, requiring an incubation up to 14 days.16 Compared with traditional biotherapeutic products, it is harder to obtain the final results of sterility testing for CTPs within the required timeframe because they may have relatively short shelf lives and the waiting time is limited due to patient health.6 Automated blood culture systems, such as BACTECTM (Becton Dickinson) and BacT/ALERT® (bioMérieux), have been widely used as alternative testing methods.17,18 Although they have the advantages of shorter incubation period of 7 days, the extremely short shelf lives of CTPs require approaches that provide results even sooner. Hence, the industry has focused on developing alternative test methods that are rapid and that show equivalent performance as compendial reference methods.
Microorganisms secrete unique metabolites that are different from human cell metabolites;19 hence, their metabolites are explored as potential biomarkers of microbial contamination in CTPs. Currently, metabolites in cell cultures can be analyzed with various techniques, such as nuclear magnetic resonance (NMR), Raman spectroscopy, and mass spectrometry (MS).20 Among these techniques, MS offers a good combination of sensitivity and selectivity and it is able to identify thousands of metabolites at the same time and unknown metabolites in complex biological mixtures, such as urine, plasma, and cell cultures.21,22 Here, we employed MS-based metabolomics to discover unique extracellular metabolites in the conditioned culture media of MSCs and T cells that correlated with microbial contamination. We identified nicotinic acid (NA) as a metabolite secreted by six bacterial species that are common contaminants in mammalian cell culture and found in the clinical environment, and five USP <71> defined organisms. NA production was associated with nicotinamidases encoded in the genomes of the bacterial species tested here, which converted nicotinamide (NAM) in the cell culture medium into NA. The NA to NAM ratio increased 72 to 15,000 times in the cells inoculated with 104 colony-forming units (CFUs)/mL of different bacterial species, with an incubation time of 24 h. Genomic database search revealed that nicotinamidases were not found in mammals but were distributed in at least 10,500 different bacterial strains, including USP <71> defined organisms. Using E. coli as a model, our results showed that a two- to three-fold increase of the NA to NAM ratio was detected for high (104 CFUs/mL) and low (18 CFUs/mL) inocula of E.coli-contaminated MSCs after 5.5 and 18.5 h, respectively. In addition, our method was able to detect 20 CFUs/mL of Bacillus subtilis and 10 CFUs/mL of Candida albicans after 12.5 and 24.5 h, respectively. Our finding suggests the NA to NAM ratio can be used as a general microbial biomarker for detecting CTP contamination.
Results
Significant morphological and metabolic changes of MSCs contaminated with six different bacterial species
Six bacterial species from five different genera, A. baumannii, E. coli, K. pneumoniae, P. aeruginosa, S. aureus, and S. epidermidis, were used in this study for the detection of contamination in MSCs; 1 × MSCs/mL were inoculated with 1 × CFUs/mL of each bacterial species. After 24 h incubation, >1 × CFUs/mL of bacteria were recovered in the contaminated MSC culture medium for all of the bacterial species, as determined by viable counting. Phenol red in DMEM is usually used as a pH indicator, and microbial contamination can acidify the medium, resulting in a color change to yellow. However, it is subjective and mammalian cell waste products will also slowly decrease the pH. Under our artificial contamination conditions, obvious color changes were only observed in MSCs infected with P. aeruginosa and A. baumannii (Figure S1). Bright-field microscopy was also used to observe the morphological changes of MSCs after the 24 h co-culture with the six bacterial species (Figure S2). Compared with the uncontaminated MSCs, all bacterial species induced similar morphological changes to MSCs, including loss of the characteristic spindle-like cell morphology and eventual cell death. However, at low-level contamination, these visual observation-based methods might be subjective and are not suitable to indicate the results for a sterility test.23
To explore possible microbial biomarkers for sterility tests, the exometabolomic profiles of uncontaminated MSCs, contaminated MSCs, and microbial culture supernatants were characterized using liquid chromatography-MS (LC-MS) and compared. Global exometabolomic profiles from the uncontaminated MSCs group was compared with the contaminated MSCs and the microbial cultures. Differences were observed in the chromatograms of contaminated MSCs and uncontaminated MSCs, while the contaminated MSCs and the microbial group showed a high degree of similarity, which suggests that the exometabolomic profiles in the culture supernatant were largely influenced by the presence of microorganisms. Representative examples of chromatograms obtained from the three groups of samples were shown in Figure S3.
Untargeted metabolomics revealed NA as a potential biomarker of broad-based microbial contamination
Using untargeted metabolomics, a total of 74,241 metabolic features were observed and 574 differential features were extracted. Partial least squares-discriminant analysis (PLS-DA) was performed based on the overall features to compare the exometabolomic profiles between the three groups. The PLS-DA score plot showed that contaminated MSCs were clearly separated from MSCs that were not contaminated with microorganisms (Figure 1). The metabolites that were statistically found only in contaminated MSC culture medium and microbial culture medium, but not uncontaminated MSC culture medium and blank medium, were selected for further analysis. Statistical analysis showed 39 and 10 possible metabolites that were not found in MSCs were present in four or five out of the six microbial cultures, respectively (Tables S1 and S2). However, only one compound (m/z 123.0366) was found in cultures contaminated with all six different bacterial species and, therefore, was the subject of further investigation (Figure 2A). By tandem MS/MS and isotope pattern analysis, this compound was identified as NA, C₆H₅NO₂. The identity of NA was further confirmed by mixing the representative contaminated MSC sample and NA chemical standard and demonstrating their co-elution (Figure S4) as well as the high matching score between the acquired MS/MS spectra and the standard MS/MS spectra in the METLIN Metabolite and Chemical Entity Database (Figure 2B).
Figure 1.

PLS-DA score plot based on cell culture supernatant in positive mode
Blue group, bacteria-free MSC culture medium; green group, culture medium of contaminated MSCs by six bacteria; and red group, bacteria in culture medium. LV, Latent Variables. All the samples were prepared in triplicate and used in PLS-DA.
Figure 2.

Extracted chromatograms and mass spectra of metabolite m/z 123.0366 and metabolite m/z 122.0571 in all uncontaminated MSCs and MSCs contaminated with 1 × of each bacterium for 24 h
(A) Representative examples of Extracted Ion Chromatogram (EIC) chromatograms obtained from the uncontaminated MSC culture medium and contaminated MSC culture medium. (B) MS/MS identification of NA: (i) the product ion spectrum of metabolite m/z 123.0366 in positive ion mode and (ii) MS/MS spectrum of NA in METLIN database; ion matches are highlighted. (C) MS/MS spectrum of NAM in METLIN database: (i) MS/MS spectrum of metabolite m/z 122.0571 in positive mode and (ii) MS/MS spectrum of NAM in METLIN database; ion matches are highlighted.
From the comparison of chromatograms of contaminated and uncontaminated MSCs, we observed a peak m/z 122.0571 of an elution time 0.2 min later than NA, which was present in all cell culture supernatants. Its peak intensity was much lower in contaminated MSCs as compared with the uncontaminated MSCs, suggesting that this compound might be consumed by bacteria. By employing the same identification procedure, compound m/z 122.0571 was identified as NAM, C6H6N2O (Figure 2C). The elution time and mass spectrum, accurate mass, and tandem MS of NA and NAM have been validated, meeting the minimum reporting requirement for confident, evidence-based metabolite identification.24
Nicotinamidases for NAM metabolism are not present in mammals
To understand why NA is unique to the cell cultures contaminated with bacteria, we performed a pathway analysis to investigate the microbial specificity of NA. The Kyoto Encyclopedia of Genes and Genomes (KEGG) pathway database showed that NA and NAM actively participated in the biosynthesis of NAM adenine dinucleotide (NAD+), a coenzyme in the cellular redox reaction that is essential for the growth of all living organisms. The PubSEED database search NCBI BLAST revealed that E. coli, K. pneumoniae, P. aeruginosa and A. baumannii possess all of the genes encoding the entire pathway starting from aspartate, while S. aureus and S. epidermidis lack the genes coding for enzymes involved in NAD+ de novo biosynthesis (Figure 3A). However, all six bacterial species possess the complete gene set necessary for the NAD+ salvage pathway, including pncA, which encodes nicotinamidase ( Enzyme Commission [EC]: 3.5.1.19). Nicotinamidases are amidohydrolases that convert NAM into NA to maintain NAD+ homeostasis. A majority of nicotinamidases (88%) are found in bacteria. The remainder are found in other prokaryotes (1.5%) and non-mammalian eukaryotes (10%), including fungi (6.4%).25 In contrast, mammals convert NAM directly into NAM mononucleotide for NAD+ synthesis.26,27
Figure 3.

Analysis of pathway and related enzymes involved in NA production
(A) Mechanism of NA production. Bacteria and fungi possess the pncA gene. which encodes for nicotinamidase that converts NAM to NA as illustrated by the tested six organisms, while mammals do not possess this gene. (B) Multiple sequence alignment between putative nicotinamidase from the USP <71> defined five organisms, C. sporogenes ATCC 15579 and reported nicotinamidase. Residues involved in cis-peptide bond (•) and in the metal ion binding (▪) are shown. The residues forming the active site are indicated by stars (★). Reported nicotinamidase are PNCA_ECOLI for E. coli (Uniprot: P21369), PNCA_MYCTU for Mycobacterium tuberculosis (Uniprot: I6XD65), and PNC1_YEAST for Saccharomyces cerevisiae (Uniprot: P53184). QA, quinolinate; NaMN, nicotinate mononucleotide; NMN, nicotinamide mononucleotide.
An important component of USP <71> is the definition of six organisms for test system qualification, which include S. aureus American Type Culture Collection (ATCC) 6538, P. aeruginosa ATCC 9027, Bacillus subtilis ATCC 6633, Clostridium sporogenes ATCC 19404, Candida albicans ATCC 10231, and Aspergillus brasiliensis ATCC 16404. Hence, we performed that same pathway analysis on these organisms. Their whole-genome sequences were obtained from ATCC genome portal. The Rapid Annotations using Subsystems Technology (RAST) annotation and tBLASTn showed that, except for C. sporogenes, the other five organisms all possessed putative pncA genes encoding nicotinamidases (Figure 3B). It is possible that the whole-genome sequencing had some gaps since another well-studied strain of C. sporogenes (ATCC 15579) possesses the pncA gene encoding nicotinamidase (accession number: Uniprot J7TC07). Sequence alignment revealed that these putative nicotinamidases included the totally conserved catalytic cysteine (C209), aspartate (D12), and lysine (K155), which form the catalytic activity (Figure 3B, highlights) of the enzymes.
A genome database search was also performed for identifying the presence of the pncA genes, which encodes nicotinamidases in Mycoplasma. Among the Mycoplasma species that are specified in USP <63>,28 Mycoplasma fermentans ATCC 19989, Mycoplasma orale ATCC 23714, and Mycoplasma synoviae ATCC 25204 possess the pncA genes encoding nicotinamidases. The remaining strains, which include Acholeoplasma laidlawii ATCC 23206, Mycoplasma gallisepticum ATCC 19610, Mycoplasma hyorhinis ATCC 17981, and Mycoplasma pneumoniae ATCC 15531, do not appear to possess pncA gene, hence, will not be detected using our methods. Therefore, our method is not applicable for mycoplasma testing in a broad range but is useful for general sterility.
NA to NAM ratio is a non-invasive microbial biomarker for CTP sterility testing
We investigated the ratio of NA generation to NAM consumption (NA to NAM ratio) as a quantitative biomarker for detecting microbial contamination in CTPs. The matrix effect was first evaluated in the blank DMEM inoculated with 1× CFUs/mL of six different bacterial species but without MSCs. As shown in Figure 4, the NA to NAM ratio increased significantly, ranging from 30 to 15,621 times higher than the uncontaminated medium, with the order from high to low of A. baumannii, P. aeruginosa, S. epidermidis, K. pneumoniae, E. coli, and S. aureus. The results indicated that the blank medium did not interfere with the metabolite production. MSCs were then inoculated with same amount of the six bacterial species and a significant increase of the NA to NAM ratio was observed. For A. baumannii, K. pneumoniae, P. aeruginosa and E. coli, the bacteria-contaminated medium showed a higher NA to NAM ratio than bacteria-contaminated MSCs, while S. epidermidis and S. aureus had lower NA to NAM ratios in their respective bacteria-contaminated medium. These differences in ratio increase might be due to the different proliferating rates, the distinctive consumption rates of NA and NAM by different bacterial species. Figure 4 showed that MSCs contaminated with 1× CFUs/mL of A. baumannii generated the highest amount of NA, with an NA to NAM ratio approximately 11,590 times higher than the uncontaminated MSCs. The second highest NA to NAM ratio was detected in MSCs contaminated with S. epidermidis (10,153-fold increase), followed by P. aeruginosa (7,212-fold increase), K. pneumoniae (6,054-fold increase) and E. coli (5,373-fold increase) compared with uncontaminated MSCs. MSCs contaminated with S. aureus showed the lowest increase in the NA to NAM ratio but was still 72 times higher than uncontaminated MSCs. However, Figure 4 also showed when the MSCs were inoculated with dead bacteria under the same conditions, no significant increase was observed for any of the six bacterial species, suggesting that NA to NAM ratio is specific for detecting viable microbial contaminants, which pose the risk to CTPs.
Figure 4.

NA to NAM ratio for uncontaminated and contaminated MSC culture medium with six different bacteria
With an inoculation condition of CFUs/mL for 24 h, the ratio of NA to NAM in contaminated MSC culture medium was 72 to 11,590 times higher than the uncontaminated MSC culture medium. Dead bacteria caused no significant increase of NA to NAM ratio in cell culture medium. Blank DMEM was used as negative control. ∗p ≤ 0.05, ∗∗p ≤ 0.01, ∗∗∗p ≤ 0.001, ∗∗∗∗ p ≤ 0.0001 compared with blank medium group using one-way ANOVA.
To further demonstrate the utility of the NA to NAM ratio as a microbial biomarker for CTP sterility testing, we carried out this experiment using five of the six organisms specified in USP <71>. Technical limitations prevented us from carrying out this study on one of the USP strains. Four of the strains, S. aureus ATCC 6538, P. aeruginosa ATCC 9027, B. subtilis ATCC 6633, and C. albicans ATCC 10231, showed 100 to 8,600 times increase of NA to NAM ratio in contaminated MSCs (Figure 5). For A. brasiliensis ATCC 16404, which is a common saprophytic mold that spreads fungal spores widely, we do not have a suitable biosafety cabinet for its culture, which prevented us from performing microbial dilutions and CFU counting. Due to this limited condition, we were able to carry out a limited spiking study by obtaining the commercial stocks of A. brasiliensis ATCC 16404. Only 10 CFUs/mL of the A. brasiliensis were inoculated with MSCs, and the sample was collected after 24 and 72 h. Due to the slow growth rate of A. brasiliensis, no significant increase of NA to NAM ratio was observed at 24 h, but an increase of 200-fold in NA to NAM ratio was detected after 72 h (Figure S5). The sixth strain, C. sporogenes ATCC 19404, was not tested because it is anaerobic and difficult to grow under normal MSC culture conditions and, therefore, would not be expected to be metabolizing NA to NAM.
Figure 5.

NA to NAM ratio for uncontaminated and contaminated MSC culture medium by four USP <71> defined microorganisms
With an inoculation condition of CFUs/mL for 24 h, the ratio of NA to NAM in contaminated MSC culture medium was 100 to 8,600 times higher than the uncontaminated MSC culture medium. ∗∗p ≤ 0.05, ∗∗p ≤ 0.01, ∗∗∗p ≤ 0.001, ∗∗∗∗ p ≤ 0.0001 compared with blank medium group using t test.
The same contamination experiments using activated T cells were performed to evaluate whether the NA to NAM ratio can be used as a biomarker for monitoring microbial contamination in other types of CTPs, which are cultured in media other than DMEM. These activated T cells were cultured in RPMI medium with an NAM concentration of 1 mg/L, which is lower than the NAM concentration of 4 mg/L in DMEM. Our results showed that with an inoculum of CFUs/mL and incubation time of 24 h, the ratio of NA to NAM in contaminated T cell culture medium was approximately 4,500 to 15,000 times higher than the uncontaminated T cell culture medium (Figure 6). This is consistent with the experiments performed with MSCs, suggesting that the NA to NAM ratio is useful as a general microbial biomarker for CTP sterility testing, regardless of medium composition.
Figure 6.

NA to NAM ratio for uncontaminated and contaminated T cell culture medium with six different bacteria
(A) Representative examples of EIC chromatograms obtained from the uncontaminated culture medium and contaminated culture medium. (B) NA to NAM ratio of uncontaminated and contaminated T cell culture medium by six different bacteria. With an inoculation condition of 1× CFUs/mL for 24 h, the ratio of NA to NAM in contaminated T cell culture medium was 4,500 to 15,000 times higher than the uncontaminated T cell culture medium. Blank RPMI medium was used as negative control. ∗p ≤ 0.05, ∗∗p ≤ 0.01, ∗∗∗p ≤ 0.001, ∗∗∗∗ p ≤ 0.0001 compared with blank medium group using one-way ANOVA.
Detection limit of using NA to NAM ratio for CTP sterility testing
The time to detection of NA to NAM ratio was evaluated. Here, CFUs/mL of E. coli was inoculated into MSCs, and the ratio of NA to NAM was measured at different time points. After growing for 4 h, E. coli began to enter the log phase of growth, and a significant increase of NA to NAM ratio was observed after 5 h (Figure 7A). When E. coli (18∼50 CFUs/mL) was inoculated and incubated with the MSCs for 24 h, no viable bacteria were recovered from two of five samples, suggesting that the bacteria were killed in the presence of the MSCs (data not shown). This is supported by previous observations that MSCs possess antimicrobial activity.29,30 For cultures where the low number of inoculated bacteria (18 CFUs/mL) survived, the bacteria entered log phase of growth after 15 h and showed a significant increase in the NA to NAM ratio after 18 h (Figure 7B). In contrast, visual inspection based on medium color change did not show any color changes for MSCs inoculated with <1,000 CFUs/mL of E. coli after 18 h (Figure S6A). The cell morphology appeared normal after 21 h incubation for MSCs inoculated with <1,000 CFUs/mL of E. coli (Figure S6B). Previous research indicated that at least 106 CFUs/mL of microbial cell densities were needed to make the medium turbid by the naked eye, but the assessments are highly subjective.31
Figure 7.

NA to NAM ratio for uncontaminated and contaminated MSC culture medium with different microorganisms
(A) With an inoculation condition of 1.4 × CFUs/mL of E. coli, the ratio of NA to NAM in contaminated MSC culture medium became significantly higher than the uncontaminated MSC culture medium after 5 h. (B) With an inoculation condition of 18 CFUs/mL of E. coli, the ratio of NA to NAM in contaminated MSC culture medium became significantly higher than the uncontaminated MSC culture medium after 18 h. (C) With an inoculation condition of 20 CFUs/mL of B. subtilis, the ratio of NA to NAM in contaminated MSC culture medium became significantly higher than the uncontaminated MSC culture medium after 12 h. (D) With an inoculation condition of 10 CFUs/mL of C. albicans, the ratio of NA to NAM in contaminated MSC culture medium became significantly higher than the uncontaminated MSC culture medium after 24 h. ∗p < 0.05 using t test.
The performance of our NA to NAM ratio detection method was compared with the gold standard USP <71> sterility method and the automated blood culture systems that were recommended by European Pharmacopoeia chapter 2.6.27. For the USP <71> and automated blood culture methods, cell cultures at 0 h were inoculated into aerobic and anaerobic medium for incubation and monitoring. In contrast, for our method using NA/NAM ratio, the cell cultures were incubated and collected for direct measurement. Three microorganisms were tested in the comparison study, which were gram-positive B. subtilis, gram-negative E. coli, and fungi C. albicans. To compare with the USP <71> sterility method, 18 CFUs/mL of E. coli was inoculated with MSCs and 1 mL of the cell culture were collected at 0 h and inoculated into 9 mL of soybean casein digest at 20°C–25°C for visual observation. USP <71> sterility test showed a visible turbidity of 18 CFUs/mL of E. coli after 24 h, while the significant increase of the NA/NAM ratio was observed after 18 h (Figure 7B), and the total time to detection was 18.5 h, including the time for sample preparation and LC-MS analysis. Similarly, visible turbidity was observed for an inoculation of B. subtilis with 20 CFUs/mL after 24 h, while a significant increase of the NA/NAM ratio was observed after 12 h (Figure 7C) and the total time to detection was 12.5 h. Also, the time to detection for 10 CFUs/mL of C. albicans was 48 h using USP <71> sterility testing method, while the time to detection was 24.5 h based on the NA/NAM ratio increase (Figure 7D). Therefore, our method based on the NA/NAM ratio performed better than the gold standard USP <71> sterility test method in terms of time to detection.
Previous study showed that automated blood culture system and BacT/ALERT® (bioMérieux) took approximately 15.5, 16.0, and 27.7 h after inoculation into aerobic iAST and anaerobic iNST media (bioMérieux) to detect 10 CFUs/mL of E. coli, B. subtilis, and C. albicans at 32.5°C, respectively.32 In comparison, our method took approximately 18.5 , 12.5, and 24.5 h to detect ∼10 CFUs/mL of E. coli, B. subtilis, and C. albicans, respectively. Although in one of the cases, our method took longer time to detect the presence of 10 CFUs/mL of E. coli because the automated systems have the advantage of continuous monitoring, our method are also potentially amenable to continuous monitoring to facilitate the detection speed. In addition, it is noted that the USP <71> or an automated blood culture system requires the sample to be inoculated in growth medium and monitored over time for changes in metabolite consumption. The method described herein relies on monitoring metabolites during normal cell culture. As such, the time of analysis in our method includes sample preparation and LC-MS analysis and only takes ∼0.5 h. The study also demonstrated that our method achieved a detection limit of 10 CFUs, which is comparable with the compendial sterility test and other alternative microbiological methods.
Absolute quantification of NA and NAM using LC-MS
To demonstrate the performance of our method, we evaluated the limit of detection (LOD) of our proposed microbial biomarker, the NA to NAM ratio, using E. coli as a model organism. LOD, limit of quantification (LOQ), and calibration curve parameters of internal standards (ISTDs) of NA and NAM were summarized in Table S3. A linear regression with r2 > 0.9943 was obtained for all relevant ranges. The LOD and LOQ for NA-13C6 were 0.93 and 3.11 ng/mL, respectively. The LOD and LOQ for NAM-13C6 were 5.89 and 19.65 ng/mL, respectively. The recoveries were evaluated by spiking defined amounts of ISTDs into aliquots of unprocessed cell culture medium, and ISTD concentrations were calculated using the calibration curves. The recoveries were 107.5% and 102.5% for NA-13C6 and NAM-13C6, respectively. The intraday and interday precisions and accuracies of three QC concentrations were illustrated in Table S4. The average RSDs of intraday precision at low QC, medium QC, and high QC were 0.51%, 0.57%, and 0.53%, whereas 1.95%, 3.12%, and 1.98% were the average RSDs for interday precision, respectively. Furthermore, the average intraday accuracies at low QC, medium QC, and high QC were 0.03%, 0.97%, and 1.90%, whereas the average interday accuracies were 1.44%, 4.18%, and 2.99%, respectively. These results showed that the developed method had good accuracy and reproducibility.
To demonstrate the ability of our LC-MS system for quantifying NA and NAM production by any of the microbial species, MSCs were inoculated with 0, 1, 10, 100, 1,000, and 1 × 10⁴ CFUs/mL of E. coli for 24 h. These samples were used to determine the amounts of NA produced and the consumption of NAM (Figure S7). The concentrations of NA in blank DMEM and uncontaminated MSCs were quantified as 0.004 and 0.007 μg/mL, respectively. When the CFU number was <100, no significant increase of NA was observed because there was also no recoverable E. coli after incubation. After MSCs were contaminated with 100, 1,000, and 10,000 CFUs/mL of E. coli for 24 h, the recovered E. coli numbers were 3.3 × , 3.4 × , and 4.4 × CFUs/mL, and the NA amount increased to 2.59, 13.68, and 16.60 μg/mL, respectively. With the increase of NA production, NAM decreased from 31.93 μg/mL in uncontaminated MSCs to 16.24, 4.23, and 0.12 μg/mL, respectively. There is not a linear correlation with the inocula size, and further work is needed to understand the relationships between growth rate and NA production or NAM consumption rates. Nonetheless, the changes of NA and NAM upon microbial contamination can be clearly detected.
The production of NA is caused by microbial nicotinamidases
To support the hypothesis that the NA produced in cell culture medium was due to the conversion of NAM to NA by microbial nicotinamidases, the nicotinamidase inhibitor, pyrazinecarbonitrile, was used to inhibit nicotinamidase activity. An inoculum density of 228 CFUs/mL of E. coli was used in the inhibition study. After 24 h of incubation with MSCs, a significant increase in the NA to NAM ratio of 622-fold was observed, as expected (Figure 8). In contrast, when 1 mM pyrazinecarbonitrile was added at 0 h to the MSCs with 228 CFUs/mL of E. coli, there was no significant increase in the NA to NAM ratio compared with the uncontaminated MSCs after 24 h. E. coli recovered from the inhibitor-containing and non-inhibitor-containing cell culture after 24 h of incubation were 4.7× and 5.1× CFUs/mL, respectively, suggesting that the inhibitor did not prevent microbial growth but inhibit the nicotinamidase activity. Despite the inhibition of nicotinamidase activity, NAD+ can still be produced from NAM and NAM riboside (NR) through the salvage pathway or de novo synthesis from aspartate. Previous work also suggested that the production of NA through nicotinamidases might enhance microbial infectivity instead of acting as a growth factor for microorganisms; hence, the inhibition of nicotinamidases might not affect their growth.33,34 This assay supports our hypothesis that the NA in contaminated cell culture medium was converted from NAM by microbial nicotinamidases. Our study aimed to provide a broad-based sterility testing method for CTPs but not a method that is capable of identifying different microbial species. Therefore, even though the expression levels of nicotinamidases and the NA/NAM ratio vary for different microorganisms, we can still demonstrate microbial contamination if the NA/NAM ratio increased significantly in the product.
Figure 8.

Inhibition of the production of NA in microbial contaminated cell culture medium
(A) Effect of 1 mM pyrazinecarbonitrile on NA to NAM ratio to MSCs contaminated by ∼200 CFUs/mL of E. coli. (B) Representative chromatograms obtained from the uncontaminated culture medium and contaminated culture medium using QQQ LC-MS. The ratio of NA to NAM in contaminated MSC culture medium was significantly higher than the MSC culture added with 1 mM pyrazinecarbonitrile.
Discussion
Microbial contamination of CTPs may originate from many sources, and, unlike pharmaceutical and many other biologic products, CTPs cannot undergo terminal sterilization. Hence, sterility testing is an important part of in-process and final product testing.35 USP’s compendial sterility tests require a long turnaround time for results. It takes 14 and 28 days for bacteria and mycoplasma testing, respectively,16 but it is sensitive to 10 CFUs/mL and can even detect down to 1 CFUs/mL.36,37 The method is suitable for use in the pharmaceutical industry, where there is plenty of time, however, is not well suited for the sterility and release testing of CTPs because they possess a short shelf life, which makes turnaround time for sterility results critical to patients.16 Rapid microbial methods, such as the BacT/ALERT® system for the detection of microorganisms for sterility tests purposes, have been proposed and validated.16 The time to detection for the BacT/ALERT® system is dependent on the product matrix and specific microbial species, and it can detect 99% of all microorganisms in 3 days but needs a full 7 days to detect slow-growing bacteria, such as Cutibacterium acnes.16,32 Unlike USP compendial tests or the BacT/ALERT® automated system, the detection of the NA to NAM ratio does not require an additional incubation period and can be performed at regular time intervals during the CTP manufacturing process or before the product releases. The USP Modern Microbiological Methods Expert Panel also recommended other candidate analytical platforms, such as adenosine triphosphate bioluminescence, flow cytometry, isothermal microcalorimetry, nucleic acid amplification, and solid phase cytometry, for developing risk-based compendial rapid sterility tests.31 However, these methods have limitations, such as being invasive because normal cells are collected for extraction, requiring a microbial enrichment step, or detecting only a limited range of bacterial species.38 In contrast, metabolite analysis of cell culture media offers the possibility of identifying biomarkers of CTP contamination using a small volume of spent medium in a non-invasive manner without sacrificing the cells.
The NA to NAM ratio is able to detect a broad spectrum of bacterial and fungal contaminants. Unlike targeted detection methods, such as PCR, it does not require prior knowledge about the possible contaminants. The key enzyme nicotinamidases are key metal-dependent amidohydrolases in NAD+ metabolism of multiple species, including archaea, bacteria, yeast, protozoa, plants, and even metazoans, such as the common fruit fly and roundworms.26 However, nicotinamidases are absent in mammals and thus have been exploited as a drug target for the control of microbial infections in humans.39 There is a broad range of potential adventitious agents, and we have identified NA production was well conserved that did not cross over into mammalian cells, hence is a good indicator for contaminants. Nicotinamidases are common across all bacterial groups (Figure S8) and also identified from a number of fungi (Figure S8, yellow), which are also adventitious agents found in CTPs.
Slow-growing organisms and very low microbial loads are particularly likely to give rise to false-negative culture results.40 A study comparing compendial sterility test and automated systems showed that their true-positive rates are comparable (2.3% versus 2.1%), but the compendial method had higher false-positive rates (7.3% versus 0.2%).35 The key issue lies in the subjective judgement in visual detection of turbidity, and, instead, detection based on the evolution of a metabolic by-product is less subjective and, hence, result in a lower false-positive rate. However, based on CO2 measurements, the BacT/ALERT® system might be influenced by the metabolically active cells contained in the product. Thus, an evaluation system needs to distinguish between microbial growth and metabolism of the cell matrix.32 In contrast, using the NA to NAM ratio, which is dependent on microbial metabolic activity, may further limit false-positive outcomes with minimal cellular matrix effect. In addition, false-positives can be caused by the misidentification of live and dead microbial cells. Differentiating live and dead contaminants is important in microbial diagnostics because the potential health risks are limited to the live portion of a mixed microbial population due to their metabolic and reproductive activities.41 Sterility testing will only rule out the presence of viable microorganisms.42 For hazardous components released by bacteria, such as endotoxin, USP encourages manufacturers to uphold high-quality standards through the bacterial endotoxins test described in USP <85> in addition to sterility testing.43 A Limulus amebocyte lysate test is required for CTPs for endotoxin testing. The dead microorganisms presented in the cell culture medium are considered as non-infectious; hence, the detection method should be able to distinguish them from live microorganisms. Our method showed that the amount of nicotinamidases in the dead inoculum would be low and the minor increases of NA to NAM ratio observed with the dead microorganisms were not statistically significantly different from background, which distinguished dead microorganisms from live microorganisms. Detection methods, such as nucleic acid amplification, are fast and sensitive, but many have the limitation of not differentiating live microbial cells.38
Despite its advantages, there are several challenges regarding the use of NA to NAM ratio as a microbial biomarker for sterility testing exist. Because the production rates of NA are not the same in all microbial strains, the time to detection of the increase in NA to NAM ratio cannot be normalized using one single bacterium and has to be investigated in a broad range of microorganisms in future studies. In addition, although the biomarker was discovered and detected using MS, other potential detection platforms should be explored, for example, colorimetric assays. However, NA-specific colorimetric assays still suffer from a number of challenges and remain largely unexplored.44 Except for focusing on NA, other possibilities can be explored based on microbial nicotinamidases. However, currently there is no such antibody that can specifically bind to all microbial nicotinamidases. Furthermore, the implementation of the NA to NAM ratio into sterility testing during CTP manufacturing should also be evaluated. The NA to NAM ratio can be used as a checkpoint at the beginning of a sterility test and a simple “yes” or “no” readout can help to save time and sample volume for analysis. The measurement can also be incorporated into the CTP manufacturing in a closed system, following the manufacturing process to perform sterility check, which can also eliminate the risk of cross-contamination during sampling.45 Raman spectroscopy is a potential tool for this application because it provides molecular fingerprints of samples in a non-invasive way, acting as a process analytical technology for cell therapy bioprocessing.46 A preliminary measurement of NA, NAM, and major cell medium metabolites, such as lactate and glucose in water, was performed using Raman spectroscopy in our study, showing that NA-associated peaks displayed a different pattern from NAM-associated peaks (Figure S9). However, it will be more challenging to measure these low-concentration metabolites in real cell samples due to the complexity of matrix. Therefore, future work of improving the detection of NA and NAM using Raman spectroscopy is needed and the possibility of incorporating a bench-top Raman system, such as the BioRam® (CellTool) can be further explored. Subsequently, molecular methods, such as PCR, can be used to investigate the identity of contaminants if the NA to NAM ratio increases. As such, the NA to NAM ratio has a greater potential for use as an in-process indication of viable microbial contamination compared to other rapid microbiological methods.
Conclusion
We have developed a novel rapid test for detecting microbial contamination in mammalian cell cultures. Through a combination of untargeted and targeted metabolomics screening, we observed changes in the exometabolomic profiles of cell culture supernatant after MSCs or T cells were intentionally contaminated with six different bacterial species for 24 h. One unique metabolite, NA, was present in all contaminated cell cultures but was nearly absent in sterile MSCs or T cell culture medium. NA is produced by the conversion of NAM via microbial nicotinamidases, which is supported by our nicotinamidase inhibition assay. To quantitatively use NA as a biomarker for assessing microbial contamination in CTPs, the ratio of NA to NAM was calculated and compared in each experiment, showing a significant increase in contaminated cell cultures. Bioinformatic analyses were conducted on 10 microorganisms, including the USP <71> defined organisms, revealing that five out of the six USP <71> organisms and a different strain of C. sporogenes (ATCC 15579) possess pncA genes encoding nicotinamidases, which suggests the common production of NA in microorganisms. Five of these microorganisms have been validated in this study that the increase in the NA to NAM ratio indicated their presence in CTPs. The time to detection and limit of this method were investigated using E. coli, B. subtilis, and C. albicans. Our results showed that when a high inoculum (1× CFUs/mL) or low inoculum (18 CFUs/mL) of E. coli was used, the increase in the NA to NAM ratio can be detected after 5.5 and 18.5 h, respectively. In cells contaminated with 20 CFUs/mL of B. subtilis and 10 CFUs/mL of C. albicans, the ratio increase can be detected after 12.5 and 24.5 h, respectively. With a broad detection range, rapidity and possible low false-positive rates, the NA to NAM ratio has great potential of acting as a microbial biomarker for CTP sterility testing.
Materials and methods
Materials
Methanol and acetonitrile of LCMS grade and all other chemicals and solvents of analytical grade used in this study were purchased from Sigma–Aldrich, unless otherwise indicated. Bacterial strains S. aureus (ATCC 6538), P. aeruginosa (ATCC 9027), B. subtilis (ATCC 6633), C. sporogenes (ATCC 19404), C. albicans (ATCC 10231), A. brasiliensis (ATCC 16404), S. epidermidis (ATCC 12228), E. coli K12 (ATCC 25404), K. pneumoniae (ATCC KP1), P. aeruginosa PAO1 (ATCC BAA-47), S. aureus (ATCC 25923), and A. baumannii (ATCC BAA-2801) were obtained from the American Type Culture Collection. A. brasiliensis ATCC 16404 was obtained from EZ Accu ShotTM Select (Microbiologics, Saint Cloud, MN, USA).
Human bone-marrow-derived MSCs isolation and culture
Bone-marrow (BM)-derived MSCs from a single adult human donor were obtained from a commercial source (Lonza) at passage 1. MSCs were expanded at 37°C with 5% CO2 DMEM supplemented with 10% fetal bovine serum (FBS) and with 1% (v/v) antibiotics (100 U/mL penicillin and 100 ng/mL streptomycin). The cells were grown in a T175 flask until they reached a 70% to 80% confluence. The medium was changed twice a week and cells from passage 4 to 6 were used in the experiments.
T cell isolation, culture, and activation
Peripheral blood leukapheresis products were obtained from Department of Haematology, Singapore General Hospital (Central Institutional Review Board [CIRB] reference: 2019/2600). Human T cells from leukapheresis samples were isolated using EasySepTM Human T Cell Isolation Kit (STEMCELL Technologies, Vancouver, British Columbia, Canada). Viable human T cells were seeded in fresh AIM V supplemented with 2% AB human serum and interleukin-2 (IL-2) (100 IU/mL). To activate T cells, 25 μL of ImmunoCultTM Human CD3/CD28 T cell activator was added to 1 mL of 1 million of cell suspension and incubated at 37°C with 5% CO2. After 3 d of activation, a viable cell count was performed and the viable cell density was adjusted every 2–3 d by adding fresh complete AIM V + 2% AB human serum + IL-2 (100 IU/mL) to the cell suspension. The cells were incubated at 37°C with 5% CO2 until the desired cell number is obtained or for up to 12 d.
Preparation of live and dead bacteria
Bacteria were plated onto Luria broth (LB) agar and cultivated at 37°C overnight. After the incubation, a single colony of each bacterial species was isolated and inoculated into 5 mL of LB broth (Sigma-Aldrich, St. Louis, MO, USA) and incubated overnight at 37°C. The next morning, the optical density 600 (OD600nm) of the overnight culture was determined using an ULTROSPEC 10 cell density meter (Biochrom, Cambridge, UK). Subsequently, the bacterial suspension was diluted (OD600nm 0.075) and further subcultured at 37°C for the bacteria to reach log phase (OD600nm 0.6–0.8). The subcultured bacterial cells were harvested by centrifugation at 7,000 × g for 10 min and concentrated in 2 mL PBS. One mL was diluted 10-fold in 70% isopropanol for preparing dead bacteria while the other 1 mL was diluted 10-fold in PBS for preparing live bacteria. The live and dead cells were harvested by centrifugation at 7,000 × g for 10 min and the pellets were suspended in PBS at approximately 107 CFUs/mL (OD600nm 0.1).
MSCs contamination with microorganisms
For microbial contamination studies, MSCs were cultured according to methods described above and were trypsinized from culture flask and suspended in the culture medium without antibiotics. MSCs were seeded at cells per well in 6-well plates and incubated overnight at 37°C with 5% CO2. Serial 10-fold dilutions of all six bacterial live and dead suspensions were performed in PBS. Bacterial dilution corresponding approximately to CFUs/mL of live or dead bacteria per well were used to inoculate each strain separately into the MSCs, which had been cultured overnight. In parallel, the same amount of each strain was separately inoculated into the blank DMEM culture medium. All treatments were performed in triplicate. The morphology of the MSCs was determined after infection experiments using bright-field microscope microscopy.
For the contamination study using USP <71> defined microorganisms, CFUs/mL of S. aureus, P. aeruginosa, B. subtilis, C. sporogenes, and C. albicans were inoculated with MSCs for 24 h while 10 CFUs/mL of A. brasiliensis were inoculated with MSCs for 24 and 72 h.
The time-point-dependent contamination experiments were performed using E. coli. Briefly, MSCs/mL were inoculated with a high inoculum ( CFUs/mL) of E. coli and incubated for 1, 2, 3, 4, 5, 6, and 24 h. Because it will take longer time to observe significant changes for low numbers of microbial contamination, additional time intervals (1, 3, 6, 9, 12, 15, 18, 21, and 24 h) were used for low inocula (18 CFUs/mL) experiments. In addition, MSCs/mL were also inoculated with 20 CFUs/mL of B. subtilis and 10 CFUs/mL of C. albicans and incubated for 6, 12, 18, and 24 h to investigate the detection limit of the method. Untreated MSCs were used as a negative control. To compare with the USP <71> sterility test, 1 mL of the contaminated cell culture were collected at 0 h and inoculated into 9 mL of soybean casein digest or fluid thioglycolate medium for visual observation at 20°C–25°C and 30°C –35°C, respectively. The experimental flow was summarized in Figure S10.
Microbial nicotinamidase inhibition assay
The irreversible nicotinamidase inhibitor pyrazinecarbonitrile was used to inhibit the enzymatic activity of microbial nicotinamidases. The inhibitor was tested for its cytotoxicity to MSCs using a 3-(4,5-dimethylthiazolyl-2)-2,5-diphenyltetrazolium bromide (MTT) dye reduction assay. Briefly, MSCs per well were seeded into a 96-well plate and incubated at 37°C with 5% CO2. After 24 h, MSCs were treated with pyrazinecarbonitrile at concentrations of 0.1, 1, 10, 50, 100, 500, 1,000, 5,000, or 10,000 μM and incubated overnight. Positive and negative controls were 0.1% Triton X-100 and PBS, respectively. A final concentration of 0.5 mg/mL MTT was added to each well and incubated for 4 h at 37°C. DMSO was then added to dissolve insoluble formazan crystals. The absorbance was measured at 550 nm using a microplate reader (Tecan Infinite 200 Pro, Männedorf, Switzerland).
The nicotinamidase inhibition assay was performed using E. coli. E. coli (200 CFUs/mL) was used to infect MSCs, as described above. MTT assay revealed that pyrazinecarbonitrile was non-toxic to MSCs at <10,000 μM (Figure S11). As an irreversible inhibitor, it shows a Ki value (inhibitory constant) of 61 ± 3 μM.47 To increase the inhibition potency, a higher concentration (1,000 μM) with no cytotoxicity of pyrazinecarbonitrile was used to inhibit nicotinamidases in this study. The uninfected MSCs (without nicotinamidase inhibitors) and E. coli incubated alone with the blank DMEM were used as positive controls. MSCs with inhibitors were used as negative control. All the samples were incubated at 37°C with 5% CO2 for 24 h.
Sample preparation for extracellular metabolites
At each time point for the contamination experiments, 100 μL cell culture from each well was collected and filtered through a Nanosep® centrifugal device with an OmegaTM 10K molecular weight cutoff membrane (Pall Corporation, Port Washington, NY, USA) by centrifugation at 8,000 × g for 5 min. The filtrates were collected in autosampler vials for LC-MS analysis. The whole sample preparation process took 10 min.
Untargeted metabolomics analysis by LC-MS
The samples were analyzed using an Agilent 1290 ultrahigh pressure liquid chromatography system (Agilent, Waldbronn, Germany) equipped with a 6550 iFunnel Q-TOF mass detector managed by a MassHunter Workstation, as previously described.48,49 A Waters ACQUITY UPLC HSS T3 (2.1 × 100 mm, 1.8 μm; Waters, Milford, MA, USA) column was used with a Waters ACQUITY HSS T3 1.8 μM VanGuard guard column. The column temperature was 50°C. The separation was performed under a gradient elution which involved a mobile phase consisting of (A) 0.1% formic acid in water and (B) 0.1% formic acid in methanol. A linear gradient from 0% B to 95% B was applied for 2 min and was held for 5 min and then returned to the initial condition over 1 min. Two μL of samples was injected with a flow rate of 0.4 mL/min. For MS, the electrospray ionization mass spectra were acquired in positive ion mode and collected between m/z 50 and 1,700 at a rate of two scans per second. The ion spray voltage was set at +3,500 V and the capillary temperature was maintained at 350°C. Drying gas was set with a flow rate of 12.0 L/min and the pressure of nebulizer nitrogen was 50 psi. The total analysis time is 17 min.
Targeted metabolomics of NA and NAM
LC-MS analysis was performed with an Agilent 1290 ultrahigh pressure liquid chromatography system (Agilent, Waldbronn, Germany) coupled to an electrospray ionization with iFunnel Technology on a 6490 triple quadrupole (QQQ) mass spectrometer, as previously described.50 Chromatographic separation was achieved by using ACQUITY UPLC HSS T3 (2.1 × 100 mm, 1.8 μm; Waters, Milford, MA, USA) column with a Waters ACQUITY HSS T3 1.8 μM VanGuard guard column. The mobile phase consisted of (A) 0.1% formic acid in water and (B) 0.1% formic acid in methanol. The initial condition was set at 0% B for 3 min. A 2 min linear gradient to 95% B was applied and then was held for 5 min and was returned to starting conditions over 1 min. The column was kept at 50°C. The autosampler was cooled to 4°C, and an injection volume of 0.5 μL with a flow rate of 0.3 mL/min was used. Electrospray ionization was performed in positive ion mode with the following source parameters: drying gas temperature 200°C with a flow of 14 L/min, nebulizer gas pressure 30 psi, sheath gas temperature 400°C with a flow of 11 L/min, capillary voltage 3,000 V, and nozzle voltage 800 V. Multiple reaction monitoring (MRM) mode was used to monitor the transitions m/z 124.04 > 79.90 and m/z 123.06 > 80.00 for NA and NAM, respectively.
LC-MS method validation
The validation of the LC-MS method regarding LOD, LOQ, linearity, recovery, reproducibility and robustness was performed according to FDA guidelines and the guideline of the International Council for Harmonisation of Technical Requirements for Pharmaceuticals for Human Use (ICH).51 NA-13C6 and NA-13C6 were obtained from Cambridge Isotope Laboratories (Tewksbury, MA, USA) and used as ISTDs. Briefly, the calibration curves were constructed from three replicate measurements of 7 concentrations of NA-13C6 (0.0001–0.5 μg/mL) and NA-13C6 (0.001–0.75 μg/mL) in cell culture medium. The calibration curve was obtained by plotting the average peak area versus the concentration of each ISTD. LOD was calculated using the formula 3∗σ/slope and LOQ was calculated as 10∗σ/slope while σ was defined as the SD. The reproducibility and robustness were demonstrated by intraday and interday precision and accuracy, using the quality control (QC) samples at low QC, medium QC, and high QC concentrations (NA-13C6: 9, 60, and 400 ng/mL, and NA-13C6: 6, 60, and 600 ng/mL). The QC samples were analyzed six times within one day for intraday precision and accuracy. The interday precision and accuracy were determined by analyzing the samples on three consecutive days, in which the samples were injected six times daily. Precision was expressed as the relative SD (RSD [%]) for the repeated measurement, whereas accuracy was expressed as the relative error (RE [%]) using the formula:
Bioinformatics analysis
The nicotinamidase sequences (encoded by pncA genes) of the six bacterial species used in the study were identified from genome annotations in the PubSEED database,52 where conserved gene order and metabolic inferences were used for gene assignments. Whole-genome sequences of USP <71> defined six microorganisms (S. aureus ATCC 6538, P. aeruginosa ATCC 9027, B. subtilis ATCC 6633, C. sporogenes ATCC 19404, C. albicans ATCC 10231, and A. brasiliensis ATCC 16404) were obtained from ATCC genome portal. NCBI BLAST searches were also used to identify homologs of nicotinamidases. The alignment of the nicotinamidase sequences and the phylogenetic tree were obtained using MEGA v. 7.053 and displayed with iTOL v.3.54
LC-MS data analysis
Raw spectrometric data were analyzed by MassHunter Qualitative Analysis software (Agilent Technologies, Santa Clara, CA, USA). The molecular features of the peaks were obtained using the Molecular Feature Extraction algorithm based on the analysis of their retention time, chromatographic peak intensity, and accurate mass. MassHunter Mass Profiler Professional software (Agilent Technologies, CA, USA) was used to visualize and analyze the features. For further processing, the features were filtered by the criteria of, intensity ≥5,000 counts and found in at least 50% of the samples at the same sampling time point signal. To align the retention time and m/z values, a tolerance window of 0.15 min and 2 mDa was used.
Compound identification and pathway analysis
The elemental compositions of the metabolites were calculated based on the exact mass, the nitrogen rule, and the isotope pattern using Agilent MassHunter software. These characteristics of the features were used for searching in online databases, including Human Metabolome Database (HMDB) (http://www.hmdb.ca/), METLIN database (http://metlin.scripps.edu/), MassBank (http://www.massbank.jp/), KEGG database (http://www.genome.jp/kegg), and PubSEED platform (http://pubseed.theseed.org/). Next, MS/MS was used to reveal the fragmentation pattern of the compound and thus provides the structural information. In databases, the MS/MS spectra of possible metabolite targets were searched and compared. Commercially available NA and NAM were used as standards to compare with the possible metabolite targets. The evidence-based classification system of metabolite identification conforms to the minimal reporting standards by metabolomics standards initiative (MSI).55,56
Statistical analysis
A statistical analysis used unpaired t test and one-way ANOVA, and statistical significance was set at p < 0.05. Only those features with a fold change of >2.0 were selected as potentially significantly altered metabolites for further analysis. For multivariate analysis using PLS-DA, data were normalized by autoscaling, which was performed on MATLAB R2019b (MathWorks, Natick, MA, USA) using PLS toolbox version 8.5 (Eigenvector Research, WA, USA) and classification toolbox version 5.1.
Acknowledgments
This work was supported by the National Research Foundation, Prime Minister’s Office, Singapore, under its Campus for Research Excellence and Technological Enterprise (CREATE) program, through the Singapore MIT-Alliance for Research and Technology (SMART): Critical Analytics for Manufacturing Personalised-Medicine (CAMP) Inter-Disciplinary Research Group. This work was supported by the Singapore Centre for Environmental Life Sciences Engineering (SCELSE), whose research is supported by the National Research Foundation Singapore, Ministry of Education, Nanyang Technological University, and National University of Singapore, under its Research Centre of Excellence Programme.
Author contributions
J.H.: conceptualization, data curation, investigation, methodology, validation, formal analysis, writing–original draft preparation, and writing–reviewing and editing. L.C.: methodology, data curation, and investigation. M.N.: data curation and investigation. P.W.B.: conceptualization, resources, and writing–reviewing and editing. J.M.W.: conceptualization, resources, and writing–reviewing and editing. Y.H.L.: conceptualization, methodology, resources, and writing–reviewing and editing. S.A.R.: resources, supervision, conceptualization, funding acquisition, project administration, and writing–reviewing and editing. S.L.S.: resources, supervision, conceptualization, funding acquisition, project administration, and writing–reviewing and editing.
Declaration of interests
The authors declare that they have no known competing financial interests or personal relationships that could have appeared to influence the work reported in this paper.
Footnotes
Supplemental information can be found online at https://doi.org/10.1016/j.omtm.2022.04.006.
Contributor Information
Scott A. Rice, Email: rscott@ntu.edu.sg.
Stacy L. Springs, Email: ssprings@mit.edu.
Supplemental information
References
- 1.Fischbach M.A., Bluestone J.A., Lim W.A. Cell-based therapeutics: the next pillar of medicine. Sci. Transl. Med. 2013;5 doi: 10.1126/scitranslmed.3005568. 179ps177. [DOI] [PMC free article] [PubMed] [Google Scholar]
- 2.Yáñez-Muñoz R.J., Grupp S.A. CAR-T in the clinic: drive with care. Gene Ther. 2018;25:157–161. doi: 10.1038/s41434-018-0023-x. [DOI] [PubMed] [Google Scholar]
- 3.Wubshet A. Review on stem cell therapy and their role in cancer treatment. Int. J. Biotech. Bioeng. 2017;3:4–71. [Google Scholar]
- 4.Galipeau J., Sensébé L. Mesenchymal stromal cells: clinical challenges and therapeutic opportunities. Cell Stem Cell. 2018;22:824–833. doi: 10.1016/j.stem.2018.05.004. [DOI] [PMC free article] [PubMed] [Google Scholar]
- 5.Mahmood A., Ali S. Microbial and viral contamination of animal and stem cell cultures: common contaminants, detection and elimination. J. Stem Cell Res. Ther. 2017;2:00078. [Google Scholar]
- 6.Störmer M., Wood E.M., Gathof B. Microbial safety of cellular therapeutics—lessons from over ten years’ experience in microbial safety of platelet concentrates. ISBT Sci. Ser. 2019;14:37–44. [Google Scholar]
- 7.Ritter M., Schwedler J., Beyer J., Movassaghi K., Mutters R., Neubauer A., Schwella N. Bacterial contamination of ex vivo processed PBPC products under clean room conditions. Transfusion. 2003;43:1587–1595. doi: 10.1046/j.1537-2995.2003.00573.x. [DOI] [PubMed] [Google Scholar]
- 8.Cobo F., Cortés J.L., Cabrera C., Nieto A., Concha A. Microbiological contamination in stem cell cultures. Cell Biol. Int. 2007;31:991–995. doi: 10.1016/j.cellbi.2007.03.010. [DOI] [PubMed] [Google Scholar]
- 9.Klein M.A., Kadidlo D., McCullough J., McKenna D.H., Burns L.J. Microbial contamination of hematopoietic stem cell products: incidence and clinical sequelae. Biol. Blood Marrow Transplant. 2006;12:1142–1149. doi: 10.1016/j.bbmt.2006.06.011. [DOI] [PubMed] [Google Scholar]
- 10.Vanneaux V., Foïs E., Robin M., Rea D., de Latour R.P., Biscay N., Chantre E., Robert I., Wargnier A., Traineau R., et al. Microbial contamination of BM products before and after processing: a report of incidence and immediate adverse events in 257 grafts. Cytotherapy. 2007;9:508–513. doi: 10.1080/14653240701420427. [DOI] [PubMed] [Google Scholar]
- 11.Pietilä M., Lähteenmäki K., Lehtonen S., Leskelä H.-V., Närhi M., Lönnroth M., Mättö J., Lehenkari P., Nordström K. Monitoring mitochondrial inner membrane potential for detecting early changes in viability of bacterium-infected human bone marrow-derived mesenchymal stem cells. Stem Cel. Res. Ther. 2012;3:53. doi: 10.1186/scrt144. [DOI] [PMC free article] [PubMed] [Google Scholar]
- 12.Honohan A., Olthuis H., Bernards A.T., van Beckhoven J.M., Brand A. Microbial contamination of cord blood stem cells. Vox Sang. 2002;82:32–38. doi: 10.1046/j.1423-0410.2002.00133.x. [DOI] [PubMed] [Google Scholar]
- 13.Subbiahdoss G., Fernández I.C., Domingues J.F., Kuijer R., van der Mei H.C., Busscher H.J. In vitro interactions between bacteria, osteoblast-like cells and macrophages in the pathogenesis of biomaterial-associated infections. PLoS One. 2011;6:e24827. doi: 10.1371/journal.pone.0024827. [DOI] [PMC free article] [PubMed] [Google Scholar]
- 14.Spagnolo A.M., Sartini M., Cristina M.L. Pseudomonas aeruginosa in the healthcare facility setting. Rev. Med. Microbiol. 2021;32:169–175. [Google Scholar]
- 15.Sung J., Hawkins J.R. A highly sensitive internally-controlled real-time PCR assay for mycoplasma detection in cell cultures. Biologicals. 2020;64:58–72. doi: 10.1016/j.biologicals.2019.12.007. [DOI] [PubMed] [Google Scholar]
- 16.Gebo J.E.T., Lau A.F. Sterility testing for cellular therapies: what is the role of the clinical microbiology laboratory? J. Clin. Microbiol. 2020;58 doi: 10.1128/JCM.01492-19. e01492–01419. [DOI] [PMC free article] [PubMed] [Google Scholar]
- 17.England M.R., Stock F., Gebo J.E.T., Frank K.M., Lau A.F. Comprehensive evaluation of compendial USP<71>, BacT/alert dual-T, and bactec FX for detection of product sterility testing contaminants. J. Clin. Microbiol. 2019;57 doi: 10.1128/JCM.01548-18. e01548–01518. [DOI] [PMC free article] [PubMed] [Google Scholar]
- 18.Khuu H.M., Stock F., McGann M., Carter C.S., Atkins J.W., Murray P.R., Read E.J. Comparison of automated culture systems with a CFR/USP-compliant method for sterility testing of cell-therapy products. Cytotherapy. 2004;6:183–195. doi: 10.1080/14653240410005997. [DOI] [PubMed] [Google Scholar]
- 19.Sharon G., Garg N., Debelius J., Knight R., Dorrestein P.C., Mazmanian S.K. Specialized metabolites from the microbiome in health and disease. Cell Metab. 2014;20:719–730. doi: 10.1016/j.cmet.2014.10.016. [DOI] [PMC free article] [PubMed] [Google Scholar]
- 20.Zhao L., Fu H.-Y., Zhou W., Hu W.-S. Advances in process monitoring tools for cell culture bioprocesses. Eng. Life Sci. 2015;15:459–468. [Google Scholar]
- 21.Lombard-Banek C., Schiel J.E. Mass spectrometry advances and perspectives for the characterization of emerging adoptive cell therapies. Molecules. 2020;25:1396. doi: 10.3390/molecules25061396. [DOI] [PMC free article] [PubMed] [Google Scholar]
- 22.Lei Z., Huhman D.V., Sumner L.W. Mass spectrometry Strategies in metabolomics. J. Biol. Chem. 2011;286:25435–25442. doi: 10.1074/jbc.R111.238691. [DOI] [PMC free article] [PubMed] [Google Scholar]
- 23.Wang T.-E., Chao T.-L., Tsai H.-T., Lin P.-H., Tsai Y.-L., Chang S.-Y. Differentiation of Cytopathic Effects (CPE) induced by influenza virus infection using deep Convolutional Neural Networks (CNN) PLoS Comput. Biol. 2020;16:e1007883. doi: 10.1371/journal.pcbi.1007883. [DOI] [PMC free article] [PubMed] [Google Scholar]
- 24.Sumner L.W., Amberg A., Barrett D., Beale M.H., Beger R., Daykin C.A., Fan T.W.M., Fiehn O., Goodacre R., Griffin J.L., et al. Proposed minimum reporting standards for chemical analysis chemical analysis working group (CAWG) metabolomics standards initiative (MSI) Metabolomics. 2007;3:211–221. doi: 10.1007/s11306-007-0082-2. [DOI] [PMC free article] [PubMed] [Google Scholar]
- 25.Sánchez-Carrón G., García-García M.I., Zapata-Pérez R., Takami H., García-Carmona F., Sánchez-Ferrer Á. Biochemical and mutational analysis of a novel nicotinamidase from oceanobacillus iheyensis HTE831. PLoS One. 2013;8:e56727. doi: 10.1371/journal.pone.0056727. [DOI] [PMC free article] [PubMed] [Google Scholar]
- 26.Zapata-Pérez R., García-Saura A.G., Jebbar M., Golyshin P.N., Sánchez-Ferrer Á. Combined whole-cell high-throughput functional screening for identification of New nicotinamidases/pyrazinamidases in metagenomic/polygenomic libraries. Front. Microbiol. 2016;7:1915. doi: 10.3389/fmicb.2016.01915. [DOI] [PMC free article] [PubMed] [Google Scholar]
- 27.Gazzaniga F., Stebbins R., Chang S.Z., McPeek M.A., Brenner C. Microbial NAD metabolism: lessons from comparative genomics. Microbiol. Mol. Biol. Rev. 2009;73:529–541. doi: 10.1128/MMBR.00042-08. [DOI] [PMC free article] [PubMed] [Google Scholar]
- 28.Nims R.W., Meyers E. 2010. USP< 63> Mycoplasma Tests: A New Regulation for Mycoplasma Testing. https://www.biopharminternational.com/view/usp-mycoplasma-tests-new-regulation-mycoplasma-testing. [Google Scholar]
- 29.Alcayaga-Miranda F., Cuenca J., Khoury M. Antimicrobial activity of mesenchymal stem cells: current Status and New perspectives of antimicrobial peptide-based therapies. Front. Immunol. 2017;8:339. doi: 10.3389/fimmu.2017.00339. [DOI] [PMC free article] [PubMed] [Google Scholar]
- 30.Yagi H., Chen A.F., Hirsch D., Rothenberg A.C., Tan J., Alexander P.G., Tuan R.S. Antimicrobial activity of mesenchymal stem cells against Staphylococcus aureus. Stem Cell Res. Ther. 2020;11:293. doi: 10.1186/s13287-020-01807-3. [DOI] [PMC free article] [PubMed] [Google Scholar]
- 31.Bonnevay T., Breton R., Denoya C., Cundell A.M., Duguid J., Jenkins M., Julian F.M., Kenney J., McDaniel A., Miller M., et al. 2017. The Development of Compendial Rapid Sterility Tests. https://www.usp.org/sites/default/files/usp/document/get-involved/monograph-modernization/stimuli-403-s201044.pdf. [Google Scholar]
- 32.Günther S.K., Geiss C., Kaiser S.J., Mutters N.T., Günther F. Microbiological control of cellular products: the relevance of the cellular matrix, incubation temperature, and atmosphere for the detection performance of automated culture systems. Transfus. Med. Hemother. 2020;47:254–263. doi: 10.1159/000503397. [DOI] [PMC free article] [PubMed] [Google Scholar]
- 33.Kligler I., Grossowicz N. The function of nicotinic acid in bacterial metabolism. J. Bacteriol. 1941;42:173–192. doi: 10.1128/jb.42.2.173-192.1941. [DOI] [PMC free article] [PubMed] [Google Scholar]
- 34.Shats I., Williams J.G., Liu J., Makarov M.V., Wu X., Lih F.B., Deterding L.J., Lim C., Xu X., Randall T.A. Bacteria boost mammalian host NAD metabolism by engaging the deamidated biosynthesis pathway. Cell Metab. 2020;31:564–579.e7. doi: 10.1016/j.cmet.2020.02.001. [DOI] [PMC free article] [PubMed] [Google Scholar]
- 35.Khuu H.M., Patel N., Carter C.S., Murray P.R., Read E.J. Sterility testing of cell therapy products: parallel comparison of automated methods with a CFR-compliant method. Transfusion. 2006;46:2071–2082. doi: 10.1111/j.1537-2995.2006.01041.x. [DOI] [PubMed] [Google Scholar]
- 36.Sutton S. Microbiology Network, Inc; 2011. The Sterility Tests. [Google Scholar]
- 37.Duguid J., Kielpinski G., Seymour B., Moulin G.C.d. The Review of American Pharmaceutical Business & Technology. American Pharmaceutical Review; 2009. Risk assessment for a rapid mycoplasma test optimized for cell therapy products. [Google Scholar]
- 38.Smith R., Von Tress M., Tubb C., Vanhaecke E., Hussong D. 2018. Eagle ScanRDI® Sterility Test Protocol Ross Caputo, PhD Evaluation of the ScanRDI® as a Rapid Alternative to the Pharmacopeial Sterility Test Method: Comparison of the Limits of Detection. https://eagleanalytical.com/wp-content/uploads/2019/04/ScanRDI-_Suitability-of-ScanRDI-as-a-Rapid-Sterility-Testing-Method.pdf. [PubMed] [Google Scholar]
- 39.Purser J.E., Lawrenz M.B., Caimano M.J., Howell J.K., Radolf J.D., Norris S.J. A plasmid-encoded nicotinamidase (PncA) is essential for infectivity of Borrelia burgdorferi in a mammalian host. Mol. Microbiol. 2003;48:753–764. doi: 10.1046/j.1365-2958.2003.03452.x. [DOI] [PubMed] [Google Scholar]
- 40.Patel P., Garson J.A., Tettmar K.I., Ancliff S., McDonald C., Pitt T., Coelho J., Tedder R.S. Development of an ethidium monoazide–enhanced internally controlled universal 16S rDNA real-time polymerase chain reaction assay for detection of bacterial contamination in platelet concentrates. Transfusion. 2012;52:1423–1432. doi: 10.1111/j.1537-2995.2011.03484.x. [DOI] [PubMed] [Google Scholar]
- 41.Nocker A., Cheung C.Y., Camper A.K. Comparison of propidium monoazide with ethidium monoazide for differentiation of live vs. dead bacteria by selective removal of DNA from dead cells. J. Microbiol. Methods. 2006;67:310–320. doi: 10.1016/j.mimet.2006.04.015. [DOI] [PubMed] [Google Scholar]
- 42.World Health Organization . WHO Technical Report Series. N; 2000. General Requeriments for the Sterility of Biological Substance; pp. 69–74. [Google Scholar]
- 43.U.S. Pharmacopoeia . 2015. USP< 85> Bacterial Endotoxins Test. https://www.usp.org/harmonization-standards/pdg/general-methods/bacterial-endotoxins. [Google Scholar]
- 44.Konno K. New chemical method to differentiate human-type tubercle bacilli from other mycobacteria. Science. 1956;124:985. doi: 10.1126/science.124.3229.985. [DOI] [PubMed] [Google Scholar]
- 45.Weber E., Pinkse M.W.H., Bener-Aksam E., Vellekoop M.J., Verhaert P.D.E.M. Miniaturized mass-spectrometry-based analysis system for fully automated examination of conditioned cell culture media. Int. J. Proteomics. 2012;2012:290457. doi: 10.1155/2012/290457. [DOI] [PMC free article] [PubMed] [Google Scholar]
- 46.Baradez M.O., Biziato D., Hassan E., Marshall D. Application of Raman spectroscopy and univariate modelling as a process analytical technology for cell therapy bioprocessing. Front. Med. (Lausanne) 2018;5:47. doi: 10.3389/fmed.2018.00047. [DOI] [PMC free article] [PubMed] [Google Scholar]
- 47.Seiner D.R., Hegde S.S., Blanchard J.S. Kinetics and inhibition of nicotinamidase from Mycobacterium tuberculosis. Biochemistry. 2010;49:9613–9619. doi: 10.1021/bi1011157. [DOI] [PMC free article] [PubMed] [Google Scholar]
- 48.Harden S.L., Zhou J., Gharanei S., Diniz-da-Costa M., Lucas E.S., Cui L., Murakami K., Fang J., Chen Q., Brosens J.J., Lee Y.H. Exometabolomic analysis of decidualizing human endometrial stromal and perivascular cells. Front. Cell Dev. Biol. 2021;9:626619. doi: 10.3389/fcell.2021.626619. [DOI] [PMC free article] [PubMed] [Google Scholar]
- 49.Cui L., Lee Y.H., Thein T.L., Fang J., Pang J., Ooi E.E., Leo Y.S., Ong C.N., Tannenbaum S.R. Serum metabolomics reveals Serotonin as a predictor of Severe dengue in the early phase of dengue fever. PLoS Negl. Trop. Dis. 2016;10:E0004607. doi: 10.1371/journal.pntd.0004607. [DOI] [PMC free article] [PubMed] [Google Scholar]
- 50.Chan K.R., Gan E.S., Chan C.Y.Y., Liang C., Low J.Z.H., Zhang S.L.-X., Ong E.Z., Bhatta A., Wijaya L., Lee Y.H., et al. Metabolic perturbations and cellular stress underpin susceptibility to symptomatic live-attenuated yellow fever infection. Nat. Med. 2019;25:1218–1224. doi: 10.1038/s41591-019-0510-7. [DOI] [PubMed] [Google Scholar]
- 51.Zhu W., Stevens A.P., Dettmer K., Gottfried E., Hoves S., Kreutz M., Holler E., Canelas A.B., Kema I., Oefner P.J. Quantitative profiling of tryptophan metabolites in serum, urine, and cell culture supernatants by liquid chromatography-tandem mass spectrometry. Anal. Bioanal. Chem. 2011;401:3249–3261. doi: 10.1007/s00216-011-5436-y. [DOI] [PubMed] [Google Scholar]
- 52.Overbeek R., Begley T., Butler R.M., Choudhuri J.V., Chuang H.Y., Cohoon M., de Crécy-Lagard V., Diaz N., Disz T., Edwards R., et al. The subsystems approach to genome annotation and its use in the project to annotate 1000 genomes. Nucleic Acids Res. 2005;33:5691–5702. doi: 10.1093/nar/gki866. [DOI] [PMC free article] [PubMed] [Google Scholar]
- 53.Tamura K., Stecher G., Peterson D., Filipski A., Kumar S. MEGA6: molecular evolutionary genetics analysis version 6.0. Mol. Biol. Evol. 2013;30:2725–2729. doi: 10.1093/molbev/mst197. [DOI] [PMC free article] [PubMed] [Google Scholar]
- 54.Letunic I., Bork P. Interactive tree of life (iTOL) v3: an online tool for the display and annotation of phylogenetic and other trees. Nucleic Acids Res. 2016;44:W242–W245. doi: 10.1093/nar/gkw290. [DOI] [PMC free article] [PubMed] [Google Scholar]
- 55.Sumner L.W., Amberg A., Barrett D., Beale M.H., Beger R., Daykin C.A., Fan T.W.M., Fiehn O., Goodacre R., Griffin J.L., et al. Proposed minimum reporting standards for chemical analysis. Metabolomics. 2007;3:211–221. doi: 10.1007/s11306-007-0082-2. [DOI] [PMC free article] [PubMed] [Google Scholar]
- 56.Cui L., Lu H., Lee Y.H. Challenges and emergent solutions for LC-MS/MS based untargeted metabolomics in diseases. Mass Spectrom. Rev. 2018;37:772–792. doi: 10.1002/mas.21562. [DOI] [PubMed] [Google Scholar]
Associated Data
This section collects any data citations, data availability statements, or supplementary materials included in this article.