Abstract
In view of the characteristics of high content of SO42−, Fe2+ and Mn2+ in acid mine drainage and low pH value, based on the microbial immobilization technology, the single factor test and the orthogonal test were set respectively to determine the optimum alkaline H2O2 modification conditions for corncob. Then combining with sulfate reducing bacteria sludge, the modified corncob immobilized SRB sludge particles were prepared to treat acid mine drainage. On this basis, three dynamic column test models, including Column 1 without corncob particles, Column 2 with unmodified corncob particles, and Column 3 with modified corncob particles, were constructed. Through dynamic experiments, the three dynamic columns were compared to study the efficacy of AMD and their ability to resist changes in pollution load. The results of the orthogonal experiment showed that: when the corncob modified time was 24 h, the concentration of NaOH was 6% and the concentration of H2O2 was 1.5%, the prepared immobilized particles performed best. The results of the dynamic test showed that the treatment effect of Column 3 on AMD was better than that of Column 1 and 2. In the dynamic tests before and after the increase of pollution load, the highest removal percentages of SO42−, Mn2+, Fe2+ in Column 3 were 72.65%, 56.72%, 62.47% and 62.58%, 30.07%, 46.87% respectively, the average COD emission was 234 mg L−1 and 102.75 mg L−1, the effluent pH value was 6.96 and 6.65. In the dynamic tests before and after the increase of pollution load, the highest removal percentages of SO42−, Mn2+, Fe2+ in Column 2 were 52.94%, 46.93%, 72.55% and 48.92%, 26.43%, 43.23% respectively, the average COD emission was 508.14 mg L−1 and 152.88 mg L−1, the effluent pH value was 6.56 and 6.36. The high COD value of Column 2 is due to the organic matter leakage and poor metabolic activity of SRB contained in immobilized particles. Therefore, it indicated that Column 3 could better treat pollutants and resist changes of pollution load.
A cost-effective system for acid mine drainage removal was developed with the key role of alkaline H2O2 modified corncob and sulfate reducing bacteria.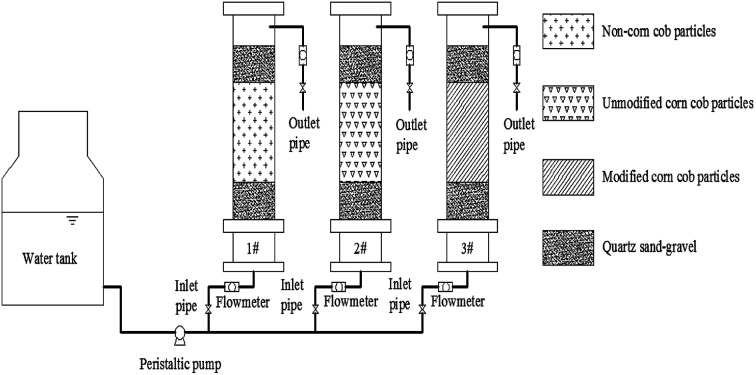
Introduction
Acid Mine Drainage (AMD) has the pollution characteristics of acidic pH, high heavy metal ions and high sulfate concentration. Arbitrary disposal of AMD will cause great pressure on water resources, and will also cause extremely serious consequences for the ecological environment.1–3 In view of the pollution problem caused by AMD, the relevant scholars have carried out a lot of research work on governance and restoration. At present, the basic methods of treatment are the neutralization method,4 the artificial wetland method5 and the microbial method.6 The application of the neutralization method and the artificial wetland method has been limited due to the production of a large amount of solid waste or poisonous and harmful gases.7,8 The Sulfate Reducing Bacteria (SRB) immobilization technology overcomes the limitations of traditional repair technology. Allowing the SRB and nutrients to be highly aggregated, the SRB immobilization technology has the advantages of strong adaptability, low processing cost, less pollution caused by secondary pollution, recyclable element metal ions and simple operation,9 so it has attracted much attention from academia, at present.
The research of SRB immobilization technology focuses on immobilized materials. Zhang Mingliang10 prepared SRB immobilized particles with heavy metal resistance from polyvinyl alcohol (PVA), sodium alginate, iron powder and silica sand. The particles have a good removal effect on Fe, Cu, Zn and Cd. However, the particle still uses the conventional carbon source lactic acid as a carbon source for the growth of the immobilized microorganism, so it cannot effectively release the carbon source slowly. Therefore, selection and optimization of slow-release organic carbon source materials have become a difficult point in the research of SRB immobilization methods. Microbial growth requires a carbon source, and it is susceptible to external conditions.11 In order to get a better treatment effect, cohesive carbon source is an ideal method. Jiang Fu12 prepared SRB sludge immobilized particles with corncob as the carbon source to deal with AMD. According to the results, the removal percentages of SO42− and Mn2+ in AMD were 94.13% and 84.39% respectively, and the pH value of effluent was 7.03. The results showed that this method had some effect on AMD treating. But the COD value of the effluent after treatment was still high, indicating that the corncob could not be fully utilized, and the corncob did not achieve the desirable sustained release effect.
Corncob is mainly composed of cellulose, hemicellulose, lignin, ash and pectin.13 Since the microbes can use the soluble carbon source and the easily decomposable substance in the corncob at the beginning of the reaction, the microbial metabolic rate is higher during the time. But hemicellulose is easy to hydrolyze, and the amount of carbohydrate released is large and concentrated, so it is unfavorable to slow release control of biomass carbon source.14 The carbon source required for the microorganism at the later stage of the reaction must be obtained by decomposing insoluble cellulose. But because of the influence of lattice structure, and the cross-linking effect of cellulose, hemicellulose and lignin, which is not conducive to the decomposition of carbon source,15 of the carbon supply is inappropriate in the later. Therefore, SRB metabolic rate decreased, and it is not conducive to treatment of AMD. Relevant scholars transformed organic matter components such as cellulose, hemicellulose and lignin in corncob with modified methods to improve the utilization rate of organic matter in corncob and control the release of carbon source. Until now they have achieved good results. R. L. Tseng16 studied the adsorption properties of phenol and methylene blue by modifying the corncob with KOH solution as an activator. The results show that the regular surface shape of corncob honeycomb was favorable for the formation of micropores and increased surface area. So the performance of pollutants adsorption was significantly enhanced. Zhao Wenli17 modified corncob by combining alkaline hydrogen peroxide (containing 1.5% of H2O2 NaOH solution) and UV irradiation to investigate the carbon release from corncob, denitrification and microbial attachment. The results showed that the availability and denitrification efficiency of modified corncob were improved remarkably, and the removal percentage of nitrate still kept more than 90% after 41 days of static denitrification.
Based on the above, this paper proposed to modify corncob with alkaline H2O2 to obtain an effective slow release carbon source. Alkaline H2O2 modified corncob material was prepared by single factor test and orthogonal test. The modified corncob fixed SRB sludge particles were prepared by using modified corncob and SRB as materials. The above immobilized particles were used to treat AMD. The optimal modification conditions of modified corncob material required for the preparation of immobilized particles was determined by the changes of COD release, SO42− removal percentage and Fe2+ removal percentage in the solution. By modifying the corncob material in the immobilized particles, the treatment efficiency of the immobilized particles is enhanced, the adaptability of the immobilized particles is improved, and the carbon source in the particles can be released long-term, effectively and slowly. And on this basis, three groups of dynamic columns, containing non-corncob, unmodified corncob and modified corncob were constructed. The effects of three particle systems on AMD treatment and their impact load resistance were compared and analyzed under different pollution load conditions. Finally, the internal mechanism of pollutant removal by the immobilized particles was further studied by XRD and SEM analysis of the particles before and after the reaction. The study is expected to provide some scientific theoretical basis for the practical application of modified corncob SRB sludge immobilized particles.
Methods
Experimental materials and water samples
Modified Starkey medium: 0.5 g Na2SO4, 1.0 g NH4Cl, 0.5 g K2HPO4, 0.1 g CaCl2 H2O, 2.0 g MgSO4·7H2O, 1.2 g (NH4)2Fe(SO4)2·6H2O, 0.1 g ascorbic acid, 4.0 mL sodium lactate, 1.0 g yeast extract, 1 L distilled water, pH = 7.0, sterilized at 121 °C for 30 min. Among them, (NH4)2Fe(SO4)2·6H2O and ascorbic acid cannot be sterilized at high temperature, and were sterilized by a 0.22 μm filter membrane.
SRB sludge: the thick active sediment of a river in Fuxin City was taken as seed mud. Then it was inoculated into sterilized modified Starkey medium for anaerobic culture. By analyzing the black sediment amount and H2S smell in the medium, the SRB with strong activity was enriched and cultured for use.
Corncob: the corncob in the new local farmland was taken. After drying and pulverizing, the corncob particles with a particle size of about 0.15 mm are sieved for use.
In the single factor and orthogonal experiments, the experimental water samples were simulated water samples. The mass concentrations of characteristic pollutants on SO42−, Mn2+ and Fe2+ were 816 mg L−1, 6 mg L−1 and 14 mg L−1, respectively, and the pH value was 4.0.
In the dynamic column tests, the characteristic pollutants of AMD were simulated at low and high concentrations, which were carried out in two stages of Test I and II, and the concentration was increased on the 8th day. The characteristic pollutant concentration indexes of each stage are shown in Table 1.
Two-stage water quality index of dynamic test.
| Project | SO42−/(mg L−1) | Fe2+/(mg L−1) | Mn2+/(mg L−1) | pH |
|---|---|---|---|---|
| Stage I | 800–850 | 14.5–15 | 8.5–9 | 4–4.5 |
| Stage II | 1450–1500 | 24.5–25 | 13.5–14 | 3–3.5 |
Experimental apparatus and method
Based on single factor experiment, orthogonal experiment, dynamic experiment and reaction kinetics experiment, the modified corncob SRB sludge immobilized particles were prepared by using alkaline H2O2 modified corncob and SRB sludge as experimental materials. By analyzing the treatment effect of granule on AMD, the method of optimal preparation of modified corncob SRB sludge immobilized particles was determined. The specific experimental methods are as follows.
Preparation method of modified corncob
5 g of corncobs were placed in different concentration of alkaline H2O2 solutions at a solid–liquid ratio of 1 : 10 (m : V, g mL−1), which were modified by the oscillating reaction for a certain time. Then modified corncob material was formed.
Preparation method of fixed SRB sludge particles
Single factor experiment, orthogonal experiment, dynamic experiment and reaction dynamics experiment all take modified corncob fixed SRB sludge particle as materials, so the preparation methods of immobilized particles are introduced as follows:
Preparation method of modified corncob fixed SRB sludge particles: based on the preliminary results of the research group, the preparation method of modified corncob fixed SRB sludge particles is as follows:12 the mass fraction of 9% of PVA and 0.5% of sodium alginate were dissolved in distilled water and sealed at room temperature. After 24 hours of full swelling, it was placed in a constant temperature water bath and stirred at 90 °C until no bubbles were present. The modified corncob powder with a mass fraction of 5% was slowly added to the gel, stir well until it was evenly distributed, sealed at temperature to 37 ± 1 °C. The cultured SRB sludge suspension was centrifuged at 3000 rpm for 10 min and the supernatant was removed. The 30 mg L−1 SRB was added to the prepared gel mixture and stirred evenly. The gel mixture was dropped into 2% CaCl2 saturated boric acid solution with a specific syringe and the particles were removed after 4 hours of cross-linking and stirring with a 100 rpm agitator. Finally, the particles were washed with 0.9% of saline. Before the particles were used, they were activated in an anaerobic environment with an improved Starkey medium solution without organic ingredients for 12 h. The method was used in the follow-up experiments to prepare immobilized particles.
Preparation method of unmodified corncob fixed SRB sludge particles: compared with the modified corncob fixed SRB sludge particle preparation method, the modified corncob material was replaced by the unmodified corncob material, and the other steps were the same.
Preparation method of SRB sludge fixed particles without corncob: compared with the modified corncob fixed SRB sludge particle preparation method, no modified corncob material was added in the gel, and other steps were the same.
Single factor experimental method
Factors and levels of single-factor experiment: in the single factor test, alkaline H2O2 modification time, NaOH concentration and H2O2 concentration were selected as the single factors. The modification time was set to 6 h, 12 h, 18 h, 24 h and 30 h respectively. NaOH concentration was set at 3%, 4%, 5%, 6% and 7% respectively. H2O2 concentration was set at 0.5%, 1%, 1.5%, 2% and 2.5% respectively.
Method: NaOH solution and H2O2 solution with different concentrations were prepared according to the factors and levels of the single-factor experiment. Different concentration of NaOH solution was added to different concentration of H2O2 solution to form different concentration of alkaline H2O2 solution. According to the modified corncob preparation method mentioned above, the corncob was placed in different concentrations of alkaline H2O2 solution to form the modified corncob material required by single-factor experiment. Then modified corncob fixed SRB sludge particles were prepared according to the preparation method mentioned above. The corncob fixed SRB sludge particles prepared under different modification conditions were placed in 200 mL wastewater respectively, and the water quality indexes were measured by sampling after reaction for a period of time. With COD release and SO42− removal percentage as the main evaluation indicators, the optimal conditions for corncob modification were analyzed and determined to guide orthogonal tests.Removal percentage = [(C0 − Ct)/C0] × 100%where, C0 and Ct are the initial concentration of ions and the concentration after treatment (mg L−1) respectively.
Orthogonal experimental method
The optimal preparation conditions for the alkaline H2O2 modified corncob were determined by L9 (33) orthogonal test. Nine extractions were carried out at the modification time was 18 h, 24 h, 30 h, the NaOH concentration was 4%, 5%, 6%, and the H2O2 concentration was 0.5%, 1%, 1.5% on the basis of the single-factor test. The optimal modification conditions of corncob were determined by using SO42− removal percentage, Mn2+ removal percentage, Fe2+ removal percentage, COD release amount and pH value. Among them, the calculation formula for the removal percentage of SO42−, Fe2+ and Mn2+ was the same as that of the single-factor experiment.
Dynamic experimental method
Fixed SRB sludge particles without corncob, unmodified corncob fixed SRB sludge particles and modified corncob fixed SRB sludge particles were prepared by using the preparation method of immobilized particles mentioned above (modified corncob conditions: modification time was 24 h, NaOH concentration was 6%, H2O2 concentration was 1.5%).
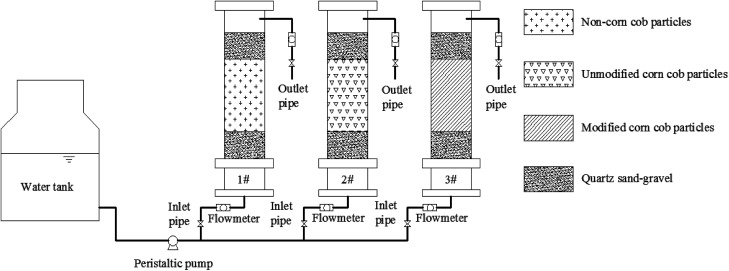
The dynamic tests adopted three groups of organic glass tube with inner diameter of 60 mm and height of 400 mm. The three dynamic tubes were constructed into 3 columns, including Column 1 filled with SRB sludge fixed particles without corncob, Column 2 filled with unmodified corncob fixed SRB sludge particles, Column 3 filled with modified corncob fixed SRB sludge particles. The immobilized particles were filled with 20 mm quartz sand of 3–5 mm in diameter on the top and bottom, which could fix and protect the particles. The water flew in from the bottom and out from the top. The water inlet was conducted according to Table 1. Flow rate was controlled with the peristaltic pump and the flow meter as 1 × 10⁻⁵ m3 s−1. The test device is shown in Fig. 1. The test was carried out continuously, and sampled regularly once a day to analyze and determine water quality indicators. At 8:00 every morning, the residual SO42− concentration, Fe2+ concentration, Mn2+ concentration, COD concentration and pH value in the effluent water of the three dynamic columns were measured, and the removal percentage of SO42−, Fe2+ and Mn2+ in the influent water of AMD were calculated by the three dynamic columns. Among them, the calculation formula of the removal percentage of SO42−, Fe2+ and Mn2+ is the same as the single-factor experiment.
Fig. 1. System diagram of dynamic testing device.
Kinetic analysis of immobilized particles
1# modified corncob fixed SRB sludge particles (modification conditions: modification time: 24 h, NaOH concentration: 6%, H2O2 concentration: 1.5%) and 2# unmodified corncob fixed SRB sludge particles were prepared by using the immobilized particle preparation method mentioned above. Modified corncob fixed SRB sludge particles (1#) and unmodified corncob fixed SRB sludge particles (2#) of 20 g were added to 200 mL simulated wastewater respectively according to the solid–liquid ratio of 1 : 10 (m : V, g mL−1), and placed in a constant temperature shaker of 100 rpm and 25 °C. The residual SO42−, Fe2+ and Mn2+ concentrations in the wastewater were measured by sampling at 24 h intervals, and the removal percentage and adsorption capacity of the immobilized particles to SO42−, Fe2+ and Mn2+ were calculated. Among them, the calculation formula of the removal percentage of SO42−, Fe2+ and Mn2+ is the same as the single-factor experiment. The calculation formula of adsorption capacity q is as follows:Adsorbing capacity q = [(C0− Ct) × V]/mwhere, q is the adsorption capacity of immobilized particles to ions (mg g−1), C0 is the initial concentration (mg L−1), Ct is the residual concentration after treatment (mg L−1), V is solution volume (L), m is the mass of immobilized particles (g).
Water quality monitoring methods
SO42−: barium chromate spectrophotometry; Mn2+: potassium periodate spectrophotometry; Fe2+: phenanthroline spectrophotometry; COD: rapid digestion spectrophotometry; pH: glass electrode method.
Results and discussion
Single factor test
Determination of the optimal modification time
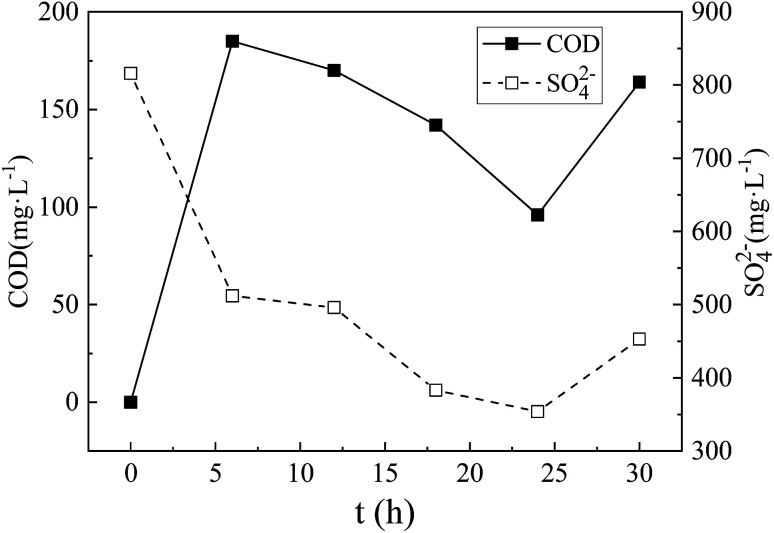
The test results are shown in Fig. 2. From Fig. 2, with the extension of the modification time, COD release increased first, then decreased and then increased, while residual concentration of SO42− decreased first and then increased slightly. This indicates that the reaction time had a great effect on the transformation degree of hemicellulose, cellulose and lignin in corncob. The hemicellulose, cellulose and lignin in corncob could not be completely dissolved and transformed in a short modification time, which affects the performance of corncob as a slow-release carbon source for further hydrolysis.18 However, the long time of modification will further destroy the internal structure of hemicellulose, cellulose and lignin in corncob, which will result in the poor hydrolysis of carbon source such as glucose and fructose, which are easy to be used by SRB, and affect the activity of SRB dissimilation SO42−. From Fig. 2, the COD emission reached the maximum value when the modification time was 6 h, which is consistent with the study results of Su Yapeng et al.19 Studies have shown that lignin in corncobs will detach from solution during the first 6 h in modification corncob with alkaline hydrogen peroxide.19 Therefore, COD value reached the highest level at 6 h. When the reaction time was 24 h, both COD release amount and the SO42− residual concentration reached the lowest level, indicating that hemicellulose, cellulose and lignin in corncob were dissolved and transformed in large quantities, which improved the further hydrolysis of the corncob to form small molecules organic matter and promoted the dissimilatory reduction activity of SRB. SRB used organic matter to carry out dissimilation and reduction metabolism, which reduced both COD release and SO42− residual concentration in the solution. At 30 h, the biological activity of SRB was reduced. The ability of SRB to reduce SO42− by organic metabolism was reduced, resulting in the increase of COD and SO42− in the system. In summary, the optimal modification time for this experiment was 24 h.
Fig. 2. COD release and SO42− residual concentration at different modification time. The NaOH concentration was 5%, the H2O2 concentration was 1.5%.
Determination of optimum NaOH concentration
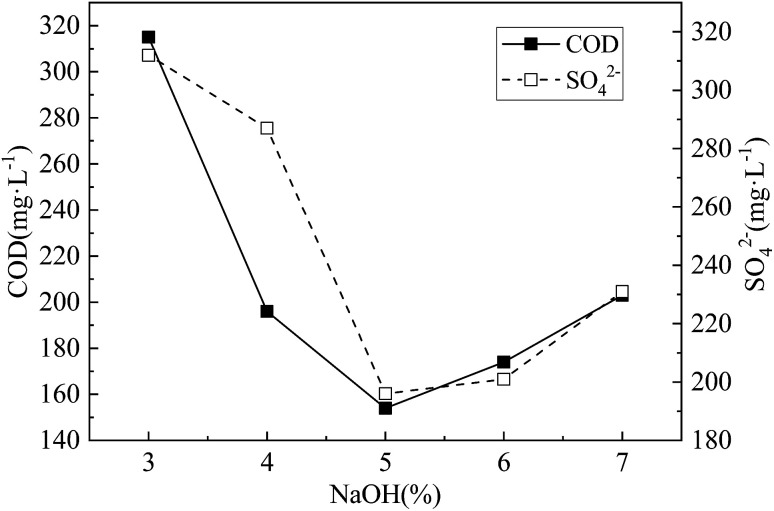
The test results are shown in Fig. 3.
Fig. 3. COD release and SO42− residual concentration under different NaOH concentration. The H2O2 concentration was 1.5%.the modification time was 24 h.
From Fig. 3, with the increase of NaOH concentration, both COD release and SO42− residual concentration decreased first and then increased. This may be due to the fact that alkali can use OH− to break the lignin ether bond, and OH− can saponity the ester bond between hemicellulose and lignin, which can dissolve most of lignin, and dissolve part of hemicellulose.20 Thus the internal structure of the corncob was changed and the ability of further hydrolysis of corncob to form small molecular organic matter was improved too. However, when the NaOH concentration was too high, on the basis of further removal of lignin and hemicellulose, the degree of crystallinity and polymerization of the cellulose were further reduced or even decomposed, resulting in the loss of degradable substances, and insufficient carbon supply for SRB dissimilation reduction. Moreover, high concentration of NaOH inhibited the activity of SRB dissimilation SO42− to a certain extent, resulting in the decrease of SO42− removal percentage. The research of Nicolas Le Moigne21 shows that lignocellulose can be dissolved by continuous dismantling and breaking in NaOH solution. When the concentration of NaOH is 5%, the amount of COD release and the residual concentration of SO42− are both at the lowest level. This also shows that the hemicellulose, cellulose and lignin in the corncob are dissolved and transformed in large quantities, which enhances the ability of corncob to hydrolyze to form small molecular organic matter and promotes the dissimilatory reduction activity of SRB. In summary, the optimal NaOH concentration was 5%.
Determination of optimal H2O2 concentration
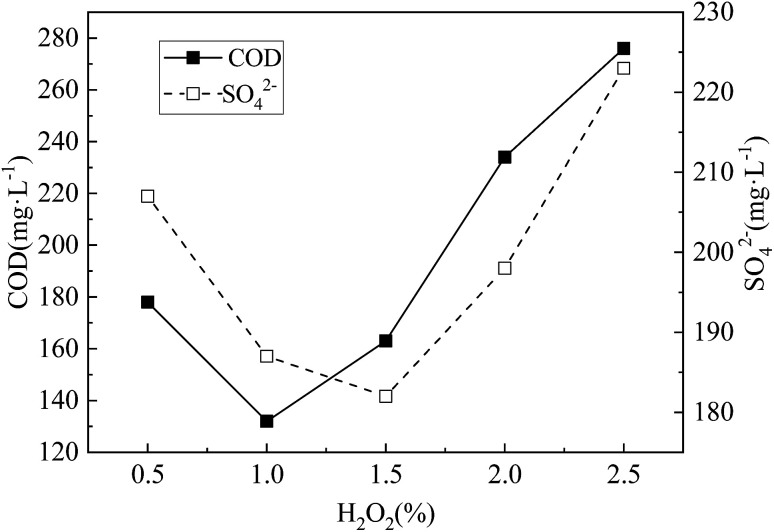
The test results are shown in Fig. 4. From Fig. 4, with the increase of H2O2 concentration, both COD release and SO42− residual concentration decreased first and then increased. This is mainly because H2O2 could degrade lignin with its own peroxidic ion oxidation and destroy the complex structure of lignin. However, due to the easy decomposition of H2O2, the effect of using H2O2 along to treat waste water is not ideal. When alkali and H2O2 are used simultaneously, the alkali can activate H2O2, enhance the removal of lignin, and improve the bioavailability of corncob,22 which is beneficial to SRB heterogeneous reduction. Thus the amount of COD release and the residual concentration of SO42− decreased with the increase of concentration of H2O2. When the content of H2O2 was too high, H2O2 and NaOH easily form Na2O2, which reduced the ability of NaOH to dissolve and the ability of H2O2 to oxidize hemicellulose, cellulose and lignin in corncob, and formed a material structure that is not conducive to SRB utilization. The amount of COD release and the residual concentration of SO42− increased as the concentration of H2O2 increased. When the concentration of H2O2 was 1%, both COD release and SO42− residual concentration reached a lower level, indicating that the lignin in the corncob was fully oxidized, which improved the ability of the corncob to further hydrolyze to form small molecular organic matter, and promoted the dissimilatory reduction activity of SRB. In summary, the optimal H2O2 concentration was 1%.
Fig. 4. COD release and SO42− residual concentration under different H2O2 concentration. The NaOH concentration was 5%, the modification time was 24 h.
Orthogonal experimental study
Based on the composition of the single factor tests and the test results, taking the modification time, NaOH concentration and H2O2 concentration as three factors, according to the orthogonal experiment table, the orthogonal experiment of L9 (33) was carried out to determine the optimum modification condition of corncob.
Orthogonal test settings and test results are shown in Table 2.
L9 (33) Orthogonal test design and results.
| Test number | Time A/h | NaOH B/% | H2O2 C/% | The removal percentage of SO42−/% | The removal percentage of Mn2+/% | The removal percentage of Fe2+/% | pH | COD/(mg L−1) |
|---|---|---|---|---|---|---|---|---|
| 1 | 18 | 4 | 0.5 | 86.20 | 76.44 | 93.57 | 7.89 | 296 |
| 2 | 18 | 5 | 1 | 89.69 | 66.25 | 86.64 | 7.77 | 267 |
| 3 | 18 | 6 | 1.5 | 81.65 | 80.93 | 82.42 | 8.07 | 254 |
| 4 | 24 | 4 | 1 | 82.07 | 72.53 | 87.42 | 7.79 | 252 |
| 5 | 24 | 5 | 1.5 | 79.06 | 75.38 | 84.85 | 7.84 | 240 |
| 6 | 24 | 6 | 0.5 | 85.44 | 79.22 | 86.00 | 7.91 | 227 |
| 7 | 30 | 4 | 1.5 | 90.17 | 75.06 | 89.92 | 7.74 | 280 |
| 8 | 30 | 5 | 0.5 | 82.94 | 69.18 | 90.14 | 7.87 | 305 |
| 9 | 30 | 6 | 1 | 87.33 | 68.61 | 84.78 | 7.91 | 282 |
According to Table 2, combined with visual analysis and analysis of variance, the best combination of SO42− removal percentage, Mn2+ removal percentage, Fe2+ removal percentage, COD release amount, and pH adjustment ability were A3B1C2, A2B3C3, A3B1C1, A2B3C3, and A1B3C1, respectively. After comprehensive consideration, the optimal proportion of immobilized particles was A2B3C3, that is, the modification time was 24 h, the NaOH concentration was 6%, and the H2O2 concentration was 1.5%. The immobilized particles prepared by the modified corncob under these conditions had the best AMD treatment effect.
Dynamic experimental study
Combined with the results of the previous orthogonal test, the AMD dynamic experiment of immobilized particle treatment was carried out by constructing 3 dynamic columns. The experimental results and analysis are as follows. The “Influent” in Fig. 5–9 indicates the influent concentrations of various ions in AMD during the dynamic experiment, which were tested each morning at 8:00.
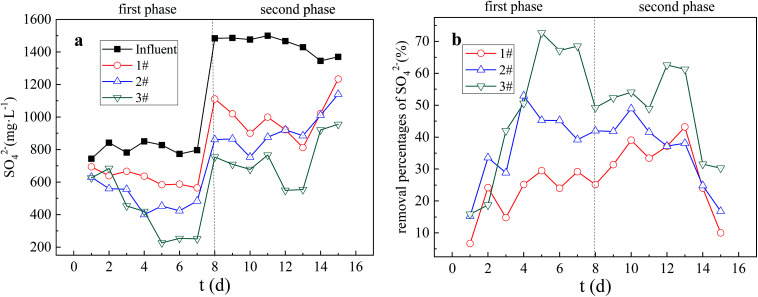
Fig. 5. (a) SO42− residual concentration in Columns 1, 2, 3 (b) Removal percentage of SO42− in Columns 1, 2, 3. Influent is the SO42− concentration in influent water of AMD. 1#, 2# and 3# in (a) are the residual SO42− concentration in AMD after repairing AMD with Column 1, Column 2 and Column 3 respectively. 1#, 2# and 3# in (b) are the removal percentage of SO42− in AMD by the three dynamic columns corresponding to (a) respectively.
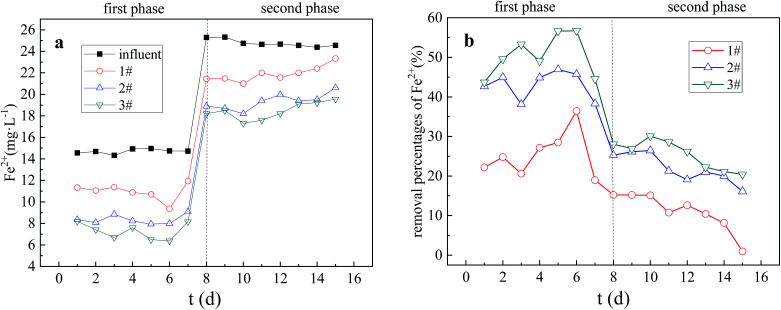
Fig. 6. (a) Fe2+ residual concentration in Columns 1, 2, 3. (b) The removal percentage of Fe2+ in Columns 1, 2, 3. Influent is the Fe2+ concentration in influent water of AMD. 1#, 2# and 3# in (a) are the residual Fe2+ concentration in AMD after repairing AMD with Column 1, Column 2 and Column 3 respectively. 1#, 2# and 3# in (b) are the removal percentage of Fe2+ in AMD by the three dynamic columns corresponding to (a) respectively.
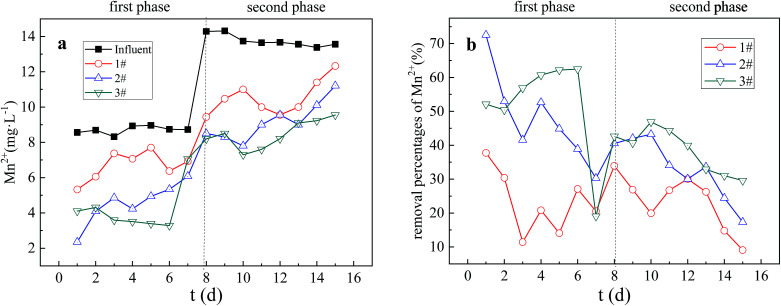
Fig. 7. (a) Mn2+ residual concentration in Columns 1, 2, 3 (b) The removal percentage of Mn2+ in Columns 1, 2, 3. Influent is the Mn2+ concentration in influent water of AMD. 1#, 2# and 3# in (a) are the residual Mn2+ concentration in AMD after repairing AMD with Column 1, Column 2 and Column 3 respectively. 1#, 2# and 3# in (b) are the removal percentage of Mn2+ in AMD by the three dynamic columns corresponding to (a) respectively.
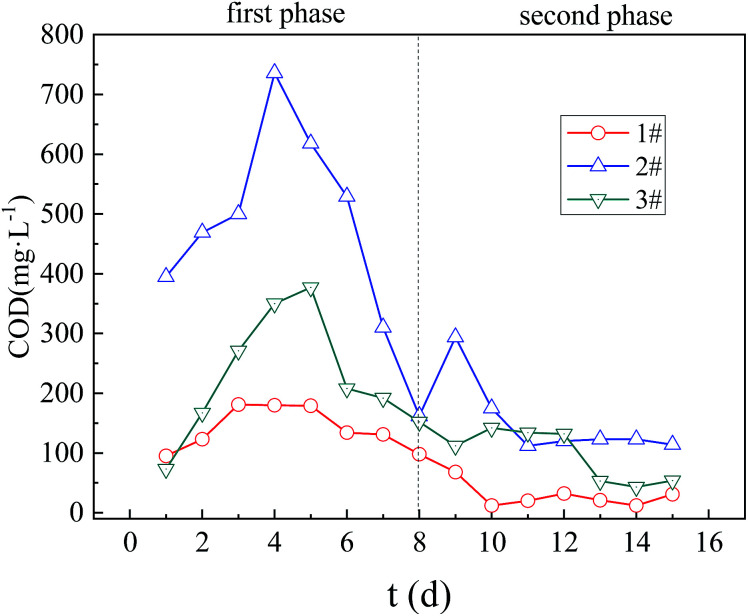
Fig. 8. The changes of COD in Columns 1, 2, 3. 1#, 2# and 3# are the COD concentration in AMD after repairing AMD with Column 1, Column 2 and Column 3 respectively.
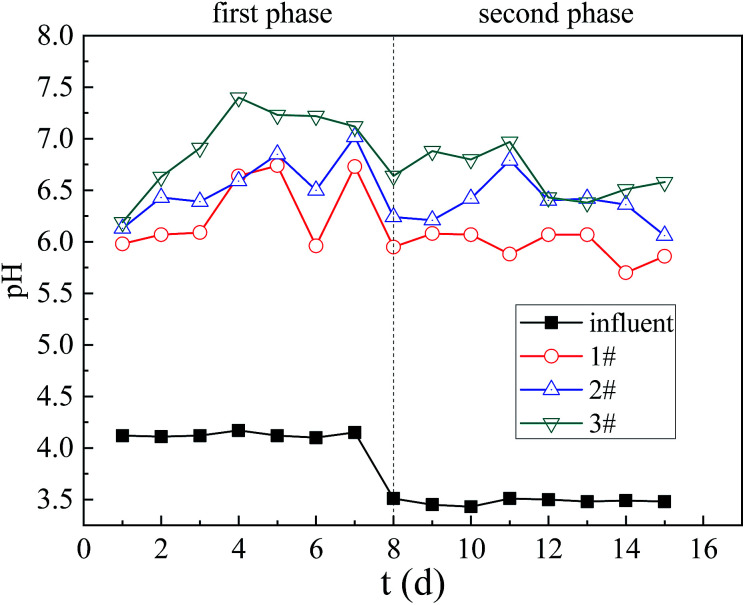
Fig. 9. The changes of pH in Columns 1, 2, 3. Influent is the pH value in influent water of AMD. 1#, 2# and 3# are the pH value in AMD after repairing AMD with Column 1, Column 2 and Column 3 respectively.
Analysis on the change rules of SO42-
According to Fig. 5(a) and (b), in the first stage of the test, the residual amount of SO42− in the dynamic Columns 1, 2 and 3 showed a downward trend. By the 5–6 d, the residual amount of SO42− in the three columns all reached the lowest level. At the 1–7 d, the average residual amount of SO42− were 624.1 mg L−1, 500.8 mg L−1 and 416.3 mg L−1 respectively, and the average removal percentages of SO42− were 21.9%, 37.2% and 47.9% respectively. In the second stage of the test, with the increase of pollutant load, the residual amount of SO42− in the Columns 1, 2 and 3 decreased first and then increased. At the 12–13 d, the residual amount of SO42− in the three columns reached the lowest level. At the 8–15 d, the average residual amount of SO42− were 1002.4 mg L−1, 914.2 mg L−1 and 735.8 mg L−1 respectively, and the corresponding SO42− average removal percentages were 30.4%, 36.4% and 48.8% respectively.
In the first stage of the reaction, the SO42− removal percentage increased rapidly in the three columns. This may be due to the fact that at the beginning of the reaction, with sufficient carbon source, SRB metabolic activity was strong, which was able to resist the low pollution load on its activity inhibition and can have a good dissimilation reduction on SO42−.23 So the removal effect was more obvious. In the second stage of the reaction, the removal percentage of SO42− in three columns showed a trend of first increasing and then significantly decreasing. At the same time, the increase and decrease of SO42− removal percentage in the three columns were different. This may be due to the fact that the increasing pollution load in the initial phase had not great impact on SRB activity, and SRB could still have a good dissimilation reduction on SO42−. However, as the reaction progressing, the carbon source in the particles is continuously consumed by the SRB, and the COD/SO42− ratio decreased below 0.67,24 the optimum carbon and sulfur ratio required for microbial growth. In addition, the toxicity and inhibition of SRB by persistent high concentration Mn2+ and acidic pH resulted in a significant decrease in SO42− removal percentage at the second stage of the reaction.25
The removal capacity of SO42− and the resistance to pollution load change of three dynamic columns are Columns 3, 2 and 1 in order from strong to weak. The main reason was that after the corncob in Column 3 was modified, the alkaline H2O2 could swell the cellulose, remove most of the lignin and part of the hemicellulose, increase the inner surface area of the corncob, and reduce the crystallinity and polymerization degree of the cellulose. The ability of the corncob to further hydrolyze to form small molecular organic substances such as glucose and fructose in the immobilized particles was improved, which provided sufficient carbon source for SRB growth and metabolism, and could well resist the inhibition of high concentration pollution load on its activity. So the catalytic activity of SRB in dissimilation reduction of SO42− was promoted. Therefore, Column 3 had the strongest ability to remove SO42− and resist the change of pollution load. The unmodified corncob, in Column 2, contained lignin and cellulose, which were difficult to be decomposed and cannot form fermentable sugars. Only part of hemicellulose was easily degraded into small molecular organic substances, such as monosaccharides, to supply SRB growth. In Column 1, the particle activity was inhibited due to the absence of the external carbon source, so it had the worst ability to remove SO42− and resist change of pollution load.
Analysis on the change rules of Fe2+
It can be seen from Fig. 6(a) and (b) that in the first stage of the test, the residual amount of Fe2+ in the dynamic columns 1, 2 and 3 showed a downward trend. At the 1–7 d, the average residual amount of Fe2+ in the three columns were 10.95 mg L−1, 8.36 mg L−1 and 7.28 mg L−1 respectively, and the average removal percentages of Fe2+ were 22.51%, 43.08% and 50.49% respectively. In the second stage of the experiment, the residual amount of Fe2+ in the three dynamic columns showed an upward trend. At the 8–15 d, the average residual amount of Fe2+ were 21.90 mg L−1, 19.34 mg L−1 and 18.46 mg L−1 respectively, and the corresponding Fe2+ average removal percentages were 11.05%, 21.91% and 25.45% respectively.
In the first stage, the removal percentage curves of Fe2+ in the three columns showed an upward trend. This is because Fe2+ removal in the dynamic columns is mainly the results of the adsorption of immobilized particles, SRB dissimilation reduction SO42− genesis of metal sulfide precipitation and SRB biosorption flocculation.26 In the initial stage of the reaction, the particle adsorption capacity was large and the SRB biological activity was strong. Therefore, the Fe2+ removal effect was significant in the initial stage of the reaction. In the second stage, the Fe2+ removal percentage curves of the three columns decreased, which may be due to the increase of the pollution load in the second stage and the gradual saturation of the particle adsorption capacity. At the same time, high concentration of Mn2+ entered the SRB cells, destroyed the enzyme proteins and deactivated them, inhibited the biological activity of SRB and produced toxic effects on them, thus weakening the dissimilation and reduction process of SO42− by sulfate-reducing bacteria, and affecting the precipitation of reduction product S2− and the removal of Mn2+ by biosorption flocculation. So the removal percentage of Fe2+ decreased significantly.
The ability of the three dynamic columns to remove Fe2+ and resist pollution load changes was Columns 3, 2 and 1 in order from strong to weak. Due to the increase in the specific surface area of the corncob and the OH− content of the granules in the immobilized particles of Column 3, which were modified by alkaline H2O2, the adsorption capacity of the particles increased, and it is easy to from hydroxides and carbonate precipitation, which enhanced the removal of Fe2+. So Column 3 had the strongest ability to remove Fe2+ and resist pollution load change. In the Column 1, however, the biological activity was inhibited due to the absence of additional carbon source. At the same time, the process of S2− precipitation and biosorption flocculation to remove Fe2+ was weak, and the adsorption capacity of the immobilized particles was low, so Column 1 had the worst ability to remove Fe2+ and resist pollution load changes.
Analysis on the change rules of Mn2+
It can be seen from Fig. 7(a) and (b) that the Mn2+ residuals in the three dynamic columns showed different fluctuation in the first stage of the experiment. At the 1–7 d, the average residual amount of Mn2+ in the three systems were 6.69 mg L−1, 4.56 mg L−1 and 4.18 mg L−1 respectively. At this time, the corresponding Mn2+ removal percentages were 23.15%, 47.68% and 51.96% respectively. In the second stage of experiment (8–15 d), the residuals of Mn2+ in the three dynamic columns fluctuated and increased, and the average residual amount of Mn2+ in the three systems were 10.53 mg L−1, 9.19 mg L−1 and 8.46 mg L−1 respectively. At this time, the corresponding Mn2+ removal percentages were 23.46%, 33.16% and 38.48% respectively.
In the first stage, the Mn2+ removal percentage curves of Columns 1 and 2 showed a downward trend, while Mn2+ removal percentage curve of Column 3 showed an upward trend. In the second stage, the Mn2+ removal percentage curves of the three columns fluctuated and decreased. The SRB immobilized particles have the same mechanism of action for removing heavy metals Fe2+ and Mn2+ from AMD. However, the average removal percentage of Fe2+ in the first stage was slightly higher than the average removal percentage of Mn2+, while the average removal percentage of Fe2+ in the second stage was slightly lower than the average removal percentage of Mn2+. Karathanasis27 found through experiments that it is difficult to from Mn2+ sulfides, when other metal ions are present in the bioreactor. The removal of Mn2+ relies mainly on adsorption to form oxides, hydroxides or carbonates. Therefore, in the first stage of strong SRB biological activity, the average removal percentage of Fe2+ was slightly higher than the average removal percentage of Mn2+ due to the influence of Fe2+ on the S2− precipitation and biosorption flocculation removal of Mn2+. However, in the second stage, due to the increase of pollution load, gradual saturation of the particle adsorption capacity, inhibit of the biological activity, the weakening of biological removal process of Fe2+, and the replace of Fe2+ with the Mn2+ entering the particle by ion exchange, the average removal percentage of Fe2+ was slightly lower than the average removal percentage of Mn2+.
Analysis on the change rules of COD
It can be seen from Fig. 8 that in the first stage of the experiment, the COD release of effluent in the three dynamic columns increased first and then decreased (1–7 d), and the average releases were 146.14 mg L−1, 508.14 mg L−1 and 234 mg L−1 respectively. In the second stage of the experiment (8–15 d), the concentration of effluent COD in the three dynamic columns decreased steadily, and the average COD release of the three systems were 36.75 mg L−1, 152.88 mg L−1 and 102.75 mg L−1 respectively.
The concentration of effluent COD in the dynamic columns was related to the leakage of organic matters and its biological metabolites in the immobilized particles. In Column 1, the effluent COD was mainly caused by the leakage of SRB sludge and its metabolites in the immobilized particles. While in Columns 2 and 3, the effluent COD was mainly produced both by the leakage of the SRB sludge, and the corncob and its hydrolyzed products in the immobilized particles. In the initial stage of the first stage reaction, the SRB metabolic activity utilized less organic matters, resulting in a large amount of organic matter leakage in the immobilized particles, thus the effluent COD concentration gradually increased. However, when the SRB activity gradually increased, and the organic matter required for its metabolism also increased, the effluent COD concentration gradually decreased. In the second stage, with the increase in pollution load, the concentration of COD release gradually decreased, due to excessive consumption of organic matter in the immobilized particles.
The COD concentration values of the three columns were Columns 2, 3 and 1 in order. Since the immobilized particles in Column 1 only contained the SRB sludge carbon source, the organic mass of the leakage was small, and thus the effluent COD concentration of Column 1 was always the smallest. Column 3 had the strongest bioactivity, and the amount of organic matters needed for SRB metabolic growth was large. Therefore, the organic matter leakage was less. So the COD concentration of effluent of Column 3 was less than that of Column 2.
Analysis on the change rules of pH
It can be seen from Fig. 9 that in the beginning initial stage of the first stage of the test, the pH values of the effluent of the 3 dynamic columns all increased rapidly, and then decreased slightly. The first stage of the test (1–7 d), the average pH of the effluent were 6.32, 6.56 and 6.96 respectively. In the second stage of the experiment (8–15 d), the pH values of the effluent in the 3 dynamic columns all decreased to varying degrees, and the average effluent pH were 5.96, 6.36 and 6.65 respectively.
The process of raising the pH of the solution in the dynamic columns is mainly the effect of particles on the adsorption of H+ and the regulation of microbial growth and metabolism.28 The main reason for the rapid increase of pH in the beginning of stage I is the adsorption of H+ by particles. As the reaction progresses to the second stage, the soluble carbon source continuously decreases, the SRB dissimilatory reduction activity decreases as well, and the high-concentration heavy metal ions and high acidity inhibit the metabolic activity of SRB in the particles,29 resulting in the amount of alkaline substances produced by microorganisms is reduced. Therefore, the pH of the effluent decreased to varying degrees.
The order of pH improvement capacity and resistance to load capacity of 3 columns was Column 3, 2 and 1. Column 3 had the strongest biological activity, the largest ability to adjust the acid, and the corncob in the particles was modified by alkaline H2O2, which contained a large amount of alkaline substances which could be neutralized with H+. So Column 3 was strongest in improving pH of solution and resisting the impact load. While Column 1 had the weakest biological activity, so it performed the worst pH in improvement and impact load resistance.
Kinetic analysis of immobilized particles
Kinetic analysis of reduction of SO42− by immobilized particles
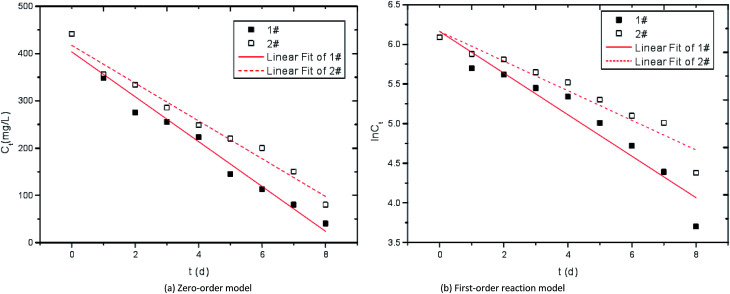
Zero-order reaction kinetics equation ct = c0 − k0t and first-order reaction kinetics equation ln ct = ln c0 − k1t were used to fit the curves of SO42− reduction by modified corncob fixed SRB sludge particles (1#) and unmodified corncob fixed SRB sludge particles (2#). The fitting curves of SO42− reaction kinetics were obtained as shown in Fig. 10 and Table 3. Where, c0 is the initial SO42− concentration (mg L−1), ct is the SO42− concentration at a certain time (mg L−1), k0 is the zero-order reaction rate constant ((mg L−1) h−1), k1 is the first-order reaction rate constant (h−1).
Fig. 10. Kinetic curves of SO42− reduction by immobilized particles. 1# is modified corncob fixed SRB sludge particles, 2# is unmodified corn cob fixed SRB sludge particles.
Coefficients of kinetic models.
| Sample | Zero-order reaction | First-order reaction | ||
|---|---|---|---|---|
| k 0 | R 2 | k 1 | R 2 | |
| 1# | 47.46 | 0.9269 | 0.262 | 0.9706 |
| 2# | 39.96 | 0.9268 | 0.187 | 0.9736 |
It can be seen from Table 3 that the correlation coefficient R2 of the first-order reaction models of the two particle materials are both large, indicating that the reduction process of SO42− by modified corncob fixed SRB sludge particles (1#) and unmodified corncob fixed SRB sludge particles (2#) conforms to first-order kinetics. As the first-order reaction kinetics process is mainly affected by electron acceptor, this model can well prove the process of SRB dissimilation reduction of SO42−. In the first-order reduction kinetic model, the reaction rate constant of 1# particle is greater than that of 2# particle, indicating that the dissimilation reduction rate of modified corncob particle to SO42− is higher than that of unmodified corncob particle, and the synergistic effect of corncob and SRB in immobilized particles improves the dissimilation reduction rate of SRB to SO42−.
Kinetic analysis of Fe2+ adsorption by immobilized particles
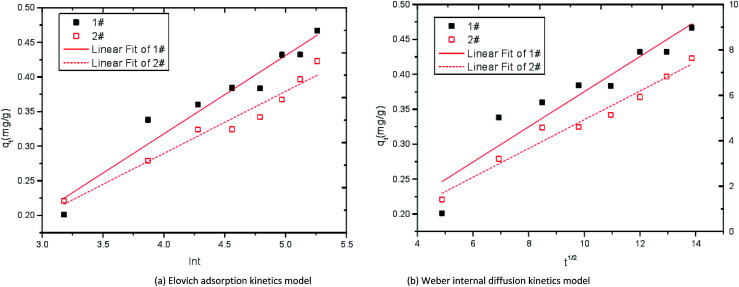
Elovich adsorption kinetics model qe = (2.303/β)ln[t + 1/(αβ)] − (2.303/β)ln[1/(αβ)] and Weber internal diffusion kinetics model qt = kt1/2 + c were used to fit the adsorption curves of Fe2+ by modified corncob fixed SRB sludge particles (1#) and unmodified corncob fixed SRB sludge particles (2#). The adsorption kinetics fitting curves of Fe2+ were obtained as shown in Fig. 11 and Table 4. Where, α is the adsorption rate constant (g (mg h)−1), β is the desorption rate constant (mg h−1), qe is the adsorption amount at adsorption equilibrium (mg g−1), qt is the adsorption amount at adsorption time t (mg g−1), k is the rate constant of in-particle diffusion (g (mg h1/2)−1), c is a constant related to the boundary thickness (mg g−1).
Fig. 11. Kinetic curves of adsorption Fe2+ by immobilized particles. 1# is modified corncob fixed SRB sludge particles, 2# is unmodified corn cob fixed SRB sludge particles.
Kinetic parameters of adsorption Fe2+ by immobilized particles.
| Sample | Elovich adsorption kinetics model | Weber internal diffusion kinetics model | |||||
|---|---|---|---|---|---|---|---|
| q e | α | β | R 2 | q t | k | R 2 | |
| 1# | 0.642 | 0.034 | 0.012 | 0.925 | 0.849 | 0.023 | 0.874 |
| 2# | 0.581 | 0.028 | 0.015 | 0.902 | 0.760 | 0.017 | 0.846 |
It can be seen from Table 4 that the correlation coefficient R2 of Elovich adsorption kinetics model is larger than that of Weber internal diffusion kinetics model in both the 1# particle and 2# particle, indicating that Elovich adsorption kinetics model can better describe the Fe2+ adsorption process. In the Elovich adsorption kinetics model, the adsorption rate constant of 1# particle is higher than that of 2# particle, indicating that the adsorption rate of modified corncob particles to Fe2+ is higher than that of unmodified corn cob particles.
Kinetic analysis of Mn2+ adsorption by immobilized particles
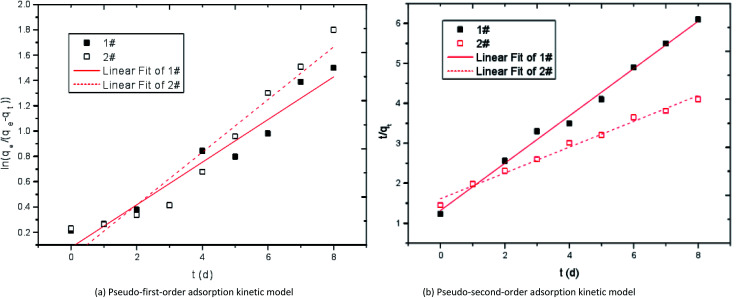
Lagergren pseudo-first-order adsorption kinetic model ln(qe − qt) = ln qe − (k1/2.323)t and McKay pseudo-second-order adsorption kinetic model t/qt = 1/(k2qe2) + t/qe were used to fit the adsorption curves of Mn2+ by modified corncob fixed SRB sludge particles (1#) and unmodified corncob fixed SRB sludge particles (2#). The adsorption kinetics fitting curves of Mn2+ were obtained as shown in Fig. 12 and Table 5. Where, qe is the adsorption amount at adsorption equilibrium (mg g−1), qt is the adsorption amount at adsorption time t (mg g−1), k1 is the first-order kinetic rate constant (h−1), k2 is the second-order kinetic rate constant (g (mg h)−1).
Fig. 12. Kinetic curves of adsorption Mn2+ by immobilized particles. 1# is modified corncob fixed SRB sludge particles, 2# is unmodified corn cob fixed SRB sludge particles.
Kinetic parameters of adsorption Mn2+ by immobilized particles.
| Sample | q e | Pseudo-first-order adsorption kinetic | Pseudo-second-order adsorption kinetic | ||
|---|---|---|---|---|---|
| k 1 | R 2 | k 2 | R 2 | ||
| 1# | 0.425 | 0.168 | 0.93267 | 0.5920 | 0.99302 |
| 2# | 0.386 | 0.208 | 0.93354 | 0.3229 | 0.98803 |
It can be seen from Table 5 that the correlation coefficient R2 of the pseudo-second-order adsorption kinetic model is larger than that of the pseudo-first-order adsorption kinetic model in both the 1# particle and 2# particle, indicating that the pseudo-second-order adsorption kinetic model can better describe the adsorption process of Mn2+ and the adsorption of Mn2+ by particles is dominated by chemical adsorption. In the pseudo-second-order adsorption kinetic model, k2 of 1# particle is larger than that of 2# particle, indicating that the adsorption rate of modified corncob particles to Mn2+ is higher than that of unmodified corncob particles. The pore structure of corncob modified by alkaline H2O2 is large, SRB has strong reducing activity, and alkaline substances exist in the particles, so the removal effect of 1# particle on Mn2+ is better than that of 2# particle.
By comparison with Tables 4 and 5, it can be seen that the adsorption equilibrium capacity qe (0.642 mg g−1 and 0.581 mg g−1) of # 1 and # 2 particles on Fe2+ is higher than that of Mn2+ (0.425 mg g−1 and 0.386 mg g−1). In the solution where Fe2+ and Mn2+ coexist, immobilized particles will form a competitive adsorption effect of ions, so the removal effect of Fe2+ by particles is better than that of Mn2+, and the adsorption equilibrium capacity of Fe2+ is higher than that of Mn2+.
Instrumental analysis
XRD analysis
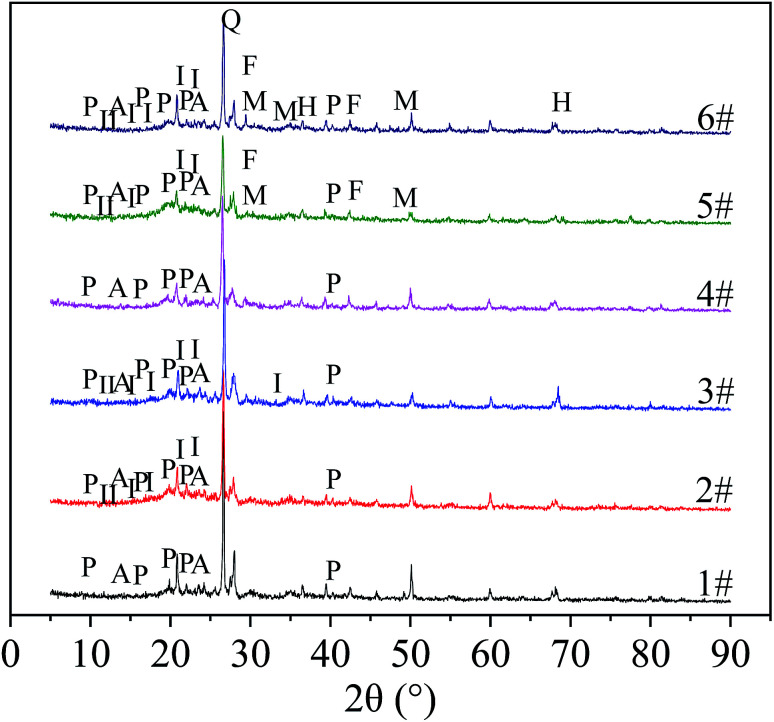
The particles before and after the above dynamic test reaction were dried and ground to a 200 mesh powder, and subjected to XRD analysis. The results are shown in Fig. 13.
Fig. 13. XRD results of particles before and after treatment. No. 1 and No. 4 were XRD patterns before and after treatment of AMD without corncob particles, respectively. No. 2 and No. 5 were XRD patterns before and after treatment of AMD with unmodified corncob particles, respectively, No. 3 and No. 6 were XRD patterns of modified corncob particles before and after treatment of AMD. P: polyvinyl alcohol, A: sodium alginate, I: cellulose I, II: cellulose II, Q: quartz, F: FeS, M: MnS, H: Mn(OH)2.
From Fig. 13, the particles (No. 1 to No. 6) before and after the treatment of the wastewater contained polyvinyl alcohol and sodium alginate. Among them, diffraction peaks of polyvinyl alcohol appeared when 2θ was 9.6°, 11.1°, 16.2°, 19.7°, 20.2°, 22.3°, 27.4°, and 40.7°. This result is consistent with the findings of Hai T. A. P. and R. Ricciardi. They found that the diffraction peaks of PVA at 2θ values of 19.68, 22.31, and 40.65°, which correspond to the (101), (200), and (111) planes of the monoclinic unit cell.30,31 At the same time, M. Hema32 found that there is a correlation between the diffraction peak height of pure vinyl alcohol and the crystallinity of vinyl alcohol at 19.7° of 2θ. The diffraction peak of sodium alginate appeared at 13.7° and 23.0° of 2θ,33 but the intensity of the diffraction peak was not strong, indicating that the crystallinity of sodium alginate was low. According to Xuan D. et al., the peak associated with sodium alginate in the XRD pattern was not obvious due to the amorphous nature of sodium alginate.34 Hemicellulose and lignin in corncobs are amorphous components, while cellulose is a crystalline component,35 so the focus of the XRD pattern of corncobs is to analyze changes in cellulose. Comparing the XRD patterns of No. 2 and No. 5, the intensity of the diffraction peak at 12°, 15°, 21°, 23°, 27°, and 34° of 2θ after the treatment of AMD by the unmodified corncob particles decreased. The XRD patterns of No. 3 and No. 6 showed that the intensity of the diffraction peaks at 12°, 17°, 21°, and 27° decreased after the modified corncob particles were treated with AMD. Studies have shown that diffraction peak is a typical cellulose I-type structure36,37 when occured at 2θ = 15° (101 planes), 17° (101 planes), 21° (021 planes), 23° (002 planes) and 34° (004 planes), the peak at 12° is a characteristic peak of cellulose II, and the peak at about 27° corresponds to the (002 plane) of carbon.38 Therefore, after processing the AMD, the cellulose and C contained in the corncob in the particles had a decrease in crystallinity, indicating that the corncob could slowly release organic matter for SRB growth and metabolism while the particles were repairing AMD. The difference in peak reduction might be related to the modification process of the corncob. At the same time, in the XRD patterns of No. 5 and No. 6, MnS and FeS peaks appeared at 30°, 34.2°, and 49.1° of 2θ, indicating that SRB can utilize the carbon source released by corncob for self metabolism, and produce S2−, which formed sulfide precipitation with the heavy metal ions in the AMD. In addition, there was Mn(OH)2 in No. 6. It might be that the heavy metal ions in AMD react with NaOH in the modified corncob particles to form hydroxide precipitation, or that modified corncob promoted SRB metabolism to produce alkalinity, which converted heavy metal ions into hydroxide precipitation.
SEM analysis
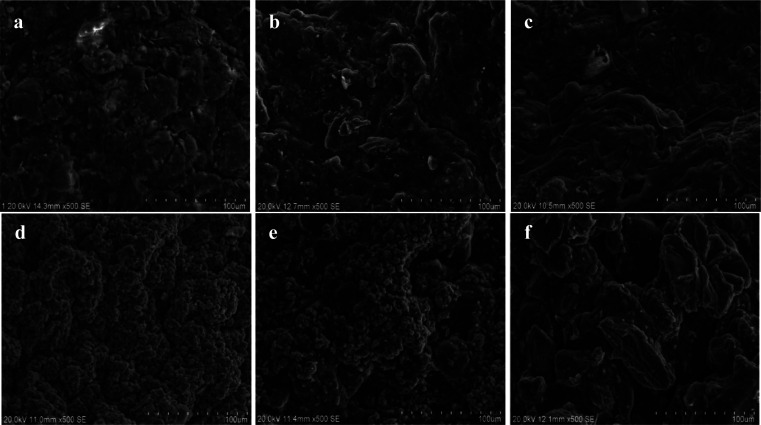
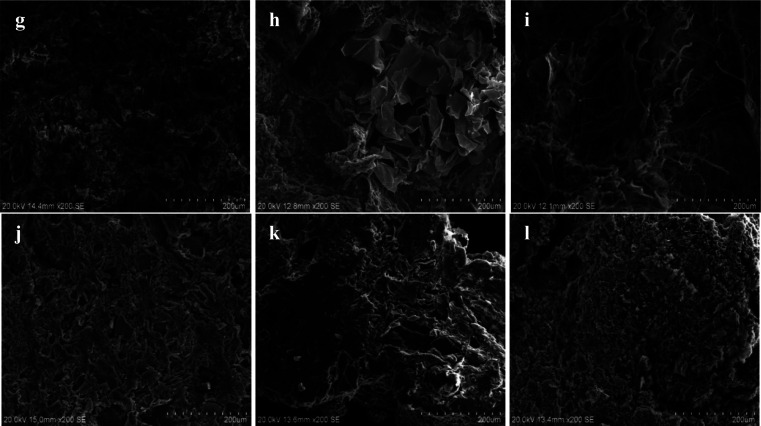
The particles before and after the dynamic test were dried and the surface and the internal structure of the particles were scanned by SEM. The microstructures of the particles were observed before and after the reaction, and the mechanism of particle co-treatment of AMD was further revealed. SEM micrographs are shown in Fig. 14 and 15.
Fig. 14. Three kinds of particle surface electron microscopy before and after the dynamic experimental reaction. (a) SEM surface structure micrographs of SRB sludge fixed particles without corncob before the dynamic experimental reaction. (b) SEM surface structure micrographs of unmodified corncob fixed SRB sludge particles before the dynamic experimental reaction. (c) SEM surface structure micrographs of modified corncob fixed SRB sludge particles before the dynamic experimental reaction. (d) SEM surface structure micrographs of SRB sludge fixed particles without corncob after the dynamic experimental reaction. (e) SEM surface structure micrographs of unmodified corncob fixed SRB sludge particles after the dynamic experimental reaction. (f) SEM surface structure micrographs of modified corncob fixed SRB sludge particles after the dynamic experimental reaction.
Fig. 15. Three kinds of particle inside electron microscopy before and after the dynamic experimental reaction. (g) SEM inside structure micrographs of SRB sludge fixed particles without corncob before the dynamic experimental reaction. (h) SEM inside structure micrographs of unmodified corncob fixed SRB sludge particles before the dynamic experimental reaction. (i) SEM inside structure micrographs of modified corncob fixed SRB sludge particles before the dynamic experimental reaction. (j) SEM inside structure micrographs of SRB sludge fixed particles without corncob after the dynamic experimental reaction. (k) SEM inside structure micrographs of unmodified corncob fixed SRB sludge particles after the dynamic experimental reaction. (l) SEM inside structure micrographs of modified corncob fixed SRB sludge particles after the dynamic experimental reaction.
Fig. 14(a), (b) and (c) are SEM surface structure micrographs of SRB sludge fixed particles without corncob, unmodified corncob fixed SRB sludge particles and modified corncob fixed SRB sludge particles before the dynamic experimental reaction respectively. Fig. 14(d), (e) and (f) are SEM surface structure micrographs of SRB sludge fixed particles without corncob, unmodified corncob fixed SRB sludge particles and modified corncob fixed SRB sludge particles after the dynamic experimental reaction respectively.
From Fig. 14(a–c), the surface of particles without corncob was rough, and the concavo-convex was obvious. There were large cracks and less irregular pores. The surface of the particles with unmodified corncob was more rough, and the concavo-convex were more obvious. There were small pieces of cracks and a large number of irregular large pores. The surface of the particles with modified corncobs had a complex, porous interstitial filamentous structure with large pores and fissures, and each gap penetrated and was closely connected. This suggested that the addition of corncobs increased the roughness and porosity of the particles. The modification process of alkaline H2O2 destroyed a large amount of cellulose crystal structure and lignin in corncobs, resulting in a low molecular weight fibrous structure.
According to Fig. 14(d–f), a large amount of particles were deposited on the surface of particles without corncob after the reaction, and less were deposited on the surface of particles with unmodified corncob after the reaction. Nearly none were deposited on the surface of particles with modified corncob after the reaction, and the filamentous structure disappeared, resulting in larger pores and cracks. This indicates that due to the smaller pores and weaker SRB activity, the metal ions were adsorbed on the surface and deposited on the particles without corncobs. While particles containing modified corncobs had a large pore structure and strong SRB biological activity, metal ions can successfully enter the inside of particles and the reaction deposition occurred. And because the SRB used the organic carbon sources, the fibrous structure of the particle surface disappeared.
Fig. 15(g), (h) and (i) are SEM inside structure micrographs including of SRB sludge fixed particles without corncob, unmodified corncob fixed SRB sludge particles and modified corncob fixed SRB sludge particles before the dynamic experimental reaction respectively. Fig. 15(j), (k) and (l) are SEM inside structure micrographs of SRB sludge fixed particles without corncob, unmodified corncob fixed SRB sludge particles and modified corncob fixed SRB sludge particles after the dynamic experimental reaction respectively.
From Fig. 15(g–i), the pore distribution of the inside of particles without corncob was relatively uniform and the pores were small, and no obvious large block material structure. The pore distribution of particles with unmodified corncob was not uniform, the pores were large, and the block material structure existed. The distribution of pores in the particles with modified corncob was more uneven and the pores were larger, and the cross-network structure was obvious. This indicated that the addition of corncobs enlarged and increased the internal pores of the particles, and increased the inhomogeneity of the pore structure. The obvious block structure might be the added corncob. Alkaline H2O2 modification process changed the structure of corncob, which presented the crossover material structure of particles with modified corncob.
From Fig. 15(j–l), we can see that the internal structure of particles without corncob did not change much. The massive material of particles with unmodified corncob disappeared and the pores became smaller and less. And the internal crossover material structure of the particles with modified corncob disappeared, and a large number of honeycomb small voids appeared. This indicated that particles with corncob (including both unmodified and modified corncob), were easier to exchange material within and outside the granular system due to the well-developed pores and good permeability, which could guarantee the free access of nutrients and metabolic products needed by the growth of microorganisms and was conducive to promoting the adsorption of particles and SRB dissimilation and reduction activity. While the particles with modified corncob contained organic carbon sources, available to SRB, and richer pore channels. Therefore, the change of the internal structure of the particles with the modified corncob was the most significant, which further proved the superiority of the modified corncob as the internal carbon source.
Conclusions
The single factor test was used to study the modification conditions of corncob. The optimum conditions for the determination of modified corncob were as follows: the modification time was 24 h, the concentration of NaOH was 6% and the concentration of H2O2 was 1.5%.
Combined with single factor test results, using the orthogonal test of L9 (33), the optimum modification conditions of corncob were determined by analysis of variance and range analysis. The optimum modification conditions were as follows: the modification time was 24 h, the concentration of NaOH was 6% and the concentration of H2O2 was 1.5%. The modified corncob prepared under these conditions had the best effect on the immobilized SRB particles.
The three constructed dynamic columns had certain ability to remove and resist change of the impact load of SO42−, Mn2+ and Fe2+ in AMD solution. Dynamic Column 3 was strongest in removing ability and resisting impact load change, and its ability to control the effluent COD release and increase the solution pH value was better than those of Column 1 and 2. This suggests that modified corncobs are more suitable as internal carbon source for SRB to treat AMD than unmodified corncobs.
The reduction reaction process of particles to SO42− in wastewater is mainly affected by electron acceptor, and the first-order reaction model can well describe the reduction process. The adsorption process of Fe2+ by particles is in accordance with Elovich adsorption kinetics model, and the adsorption process of Mn2+ is in accordance with pseudo-second-order adsorption kinetics model. In the waste where Fe2+ and Mn2+ coexist, immobilized particles will form a competitive adsorption effect of ions, so the removal effect of Fe2+ by particles is better than that of Mn2+.
XRD and SEM analysis showed that the chemical composition and spatial structure of the three immobilized particles changed significantly before and after the reaction. The particles with modified corncob showed various precipitates such as MnS, FeS and Mn(OH)2 after the reaction, which indicated the main mechanism of the removal of heavy metal ions. The particles with modified corncob had multi-porous cross-filament structure on the surface and inside before the reaction, and there were large pores and cracks as well. After the reaction, the surface and the internal filament structure disappeared, and larger pores and cracks appeared on the surface, while a large number of small honeycomb-like voids appeared inside, and the internal structure changed greatly.
Conflicts of interest
The authors declare that there is no conflict of interests regarding the publication of this article.
Supplementary Material
Acknowledgments
The project is funded by the National Natural Science Foundation of China (41672247, 41102157), Liaoning Province's “Program for Promoting Liaoning Talents” (XLYC1807159), Liaoning Provincial Natural Science Foundation of China (2015020619), Liaoning Provincial Department of Education (LJYL031) and State Key Laboratory of Pollution Control and Resource Reuse Foundation (PCRRF12015).
Notes and references
- Hwang S. K. Jho E. H. Sci. Total Environ. 2018;635:1308–1316. doi: 10.1016/j.scitotenv.2018.04.231. [DOI] [PubMed] [Google Scholar]
- Kefeni K. K. Msagati T. A. M. Mamba B. B. J. Cleaner Prod. 2017;151:475–493. doi: 10.1016/j.jclepro.2017.03.082. [DOI] [Google Scholar]
- Giachini A. J. Sulzbach T. S. Pinto A. L. Armas R. D. Cortez D. H. Silva E. P. Buzanello E. B. Soares A. G. Soares C. Rossi M. J. Arch. Microbiol. 2018;200:1227–1237. doi: 10.1007/s00203-018-1534-y. [DOI] [PubMed] [Google Scholar]
- Qureshi A. Jia Y. Maurice C. Ohlander B. Environ. Sci. Pollut. Res. Int. 2016;23:17083–17094. doi: 10.1007/s11356-016-6862-3. [DOI] [PubMed] [Google Scholar]
- Sheoran A. S. Sheoran V. Miner. Eng. 2006;19:105–116. doi: 10.1016/j.mineng.2005.08.006. [DOI] [Google Scholar]
- Nordstrom D. K. Blowes D. W. Ptacek C. J. Appl. Geochem. 2015;57:3–16. doi: 10.1016/j.apgeochem.2015.02.008. [DOI] [Google Scholar]
- Perez-Lopez R. Quispe D. Castillo J. Nieto J. M. Am. Mineral. 2011;96:781–791. doi: 10.2138/am.2011.3685. [DOI] [Google Scholar]
- Oberholster P. J. De Klerk A. R. De Klerk L. Chamier J. Botha A.-M. Ecol. Indic. 2016;62:106–116. doi: 10.1016/j.ecolind.2015.11.025. [DOI] [Google Scholar]
- Wei T. T. Yu Y. Hu Z. Q. Cao Y. B. Gao Y. Yang Y. Q. Wang X. J. Wang P. J. Appl. Mech. Mater. 2013;409–410:214–220. [Google Scholar]
- Zhang M. Wang H. Miner. Eng. 2016;92:63–71. doi: 10.1016/j.mineng.2016.02.008. [DOI] [Google Scholar]
- Berggren M. del Giorgio P. A. J. Geophys. Res.: Biogeosci. 2015;120:989–999. doi: 10.1002/2015JG002963. [DOI] [Google Scholar]
- Jiang F., MPhil, Liaoning Technical University, 2015 [Google Scholar]
- Yu N. Zhu Z.-Y. Liu Y. Zhang J.-Y. Zhang Y.-M. Ind. Crops Prod. 2017;95:163–169. doi: 10.1016/j.indcrop.2016.10.024. [DOI] [Google Scholar]
- Huang C. Yang X. Y. Xiong L. Guo H. J. Luo J. Wang B. Zhang H. R. Lin X. Q. Chen X. D. Appl. Biochem. Biotechnol. 2015;175:1678–1688. doi: 10.1007/s12010-014-1407-z. [DOI] [PubMed] [Google Scholar]
- Guo X. Y. Zhang L. Shu S. T. Hao J. Y. Appl. Mech. Mater. 2014;672–674:154–158. [Google Scholar]
- Tseng R. L. Tseng S. K. J. Colloid Interface Sci. 2005;287:428–437. doi: 10.1016/j.jcis.2005.02.033. [DOI] [PubMed] [Google Scholar]
- Zhao W. Hao R. Li B. Zhang W. Du P. Environ. Sci. 2014;35(3):987–994. [PubMed] [Google Scholar]
- Jiang Z. He T. Li J. Hu C. Green Chem. 2014;16:4257–4265. doi: 10.1039/C4GC00620H. [DOI] [Google Scholar]
- Su Y. Du R. Guo H. Cao M. Wu Q. Su R. Qi W. He Z. Food Bioprod. Process. 2015;94:322–330. doi: 10.1016/j.fbp.2014.04.001. [DOI] [Google Scholar]
- Li G. Chen J. Yang T. Sun J. Yu S. Water Sci. Technol. 2012;65:1238–1243. doi: 10.2166/wst.2012.960. [DOI] [PubMed] [Google Scholar]
- Le Moigne N. Navard P. Cellulose. 2009;17:31–45. doi: 10.1007/s10570-009-9370-5. [DOI] [Google Scholar]
- Evstigneyev E. I. Yuzikhin O. S. Gurinov A. A. Ivanov A. Y. Artamonova T. O. Khodorkovskiy M. A. Bessonova E. A. Vasilyev A. V. J. Wood Chem. Technol. 2016;36:259–269. doi: 10.1080/02773813.2015.1137945. [DOI] [Google Scholar]
- Zhang M. Wang H. Han X. Chemosphere. 2016;154:215–223. doi: 10.1016/j.chemosphere.2016.03.103. [DOI] [PubMed] [Google Scholar]
- van den Brand T. P. H. Roest K. Chen G.-H. Brdjanovic D. van Loosdrecht M. C. M. Environ. Eng. Sci. 2015;32:858–864. doi: 10.1089/ees.2014.0307. [DOI] [Google Scholar]
- Yoo K. Sasaki K. Hiroyoshi N. Tsunekawa M. Hirajima T. Mater. Trans. 2004;45:2429–2434. doi: 10.2320/matertrans.45.2429. [DOI] [Google Scholar]
- Di J. An W. Wang M. Zhao W. Guo J. Han H. China Water Wastewater. 2016;32:120–124. [Google Scholar]
- Karathanasis A. D. Edwards J. D. Barton C. D. Mine Water Environ. 2010;29:144–153. doi: 10.1007/s10230-009-0095-3. [DOI] [Google Scholar]
- Di J. An W. Dai N. Zhu Z. Jiang F. Ren Y. Zhao Q. Chin. J. Environ. Eng. 2016;10:1103–1108. [Google Scholar]
- Kikot P. Viera M. Mignone C. Donati E. Hydrometallurgy. 2010;104:494–500. doi: 10.1016/j.hydromet.2010.02.026. [DOI] [Google Scholar]
- Ricciardi R. Auriemma F. Rosa C. D. Lauprêtre F. Macromolecules. 2004;37:1921–1927. doi: 10.1021/ma035663q. [DOI] [Google Scholar]
- Hai T. A. P. Sugimoto R. Synth. Met. 2018;240:37–43. doi: 10.1016/j.synthmet.2018.03.017. [DOI] [Google Scholar]
- Hema M. Selvasekarapandian S. Arunkumar D. Sakunthala A. Nithya H. J. Non-Cryst. Solids. 2009;355:84–90. doi: 10.1016/j.jnoncrysol.2008.10.009. [DOI] [Google Scholar]
- Wang Q. Zhang N. Hu X. Yang J. Du Y. J. Biomed. Mater. Res., Part A. 2007;82:122–128. doi: 10.1002/jbm.a.31075. [DOI] [PubMed] [Google Scholar]
- Xuan D. Zhou Y. Nie W. Chen P. Carbohydr. Polym. 2017;155:40–48. doi: 10.1016/j.carbpol.2016.08.052. [DOI] [PubMed] [Google Scholar]
- Ghose T. K. Pure Appl. Chem. 1987;59:257–268. [Google Scholar]
- Silvério H. A. Flauzino Neto W. P. Dantas N. O. Pasquini D. Ind. Crops Prod. 2013;44:427–436. doi: 10.1016/j.indcrop.2012.10.014. [DOI] [Google Scholar]
- Flauzino Neto W. P. Silvério H. A. Dantas N. O. Pasquini D. Ind. Crops Prod. 2013;42:480–488. doi: 10.1016/j.indcrop.2012.06.041. [DOI] [Google Scholar]
- Mohamed I. M. A. Yasin A. S. Barakat N. A. M. Song S. A. Lee H. E. Kim S. S. Appl. Surf. Sci. 2018;435:122–129. doi: 10.1016/j.apsusc.2017.11.076. [DOI] [Google Scholar]


