Abstract
Molecularly imprinted polymers (MIPs) prepared using conventional functional monomers exhibit poor specific extraction of scopolamine from tropane alkaloids, which hinders their application in separation and purification. In this paper, a novel molecularly imprinted polymer (MIP) was prepared by precipitation polymerization using scopolamine as the template, monoethyl fumarate (MFMA) as a functional monomer, and ethylene dimethacrylate (EGDMA) as a cross-linker. The advantages of the supercritical fluid technology for the removal of the template were verified by comparing the efficiency of the swelling method and the Soxhlet extraction method. The prepared MFMA-based MIPs (MFMA-MIPs) showed a high adsorption capacity (49.75 mg g−1) and high selectivity toward scopolamine with a selectivity coefficient of 3.5. 1H NMR spectroscopy was performed to demonstrate the interactions between the two functional groups of the functional monomer and the template. Lastly, MFMA-MIPs were used as solid phase extraction (SPE) sorbents for scopolamine analysis. It was found that 97.0–107.0% of the template had been extracted using the SPE column from the complex of scopolamine, atropine and anisodamine. The mean recoveries of scopolamine from plant samples were 96.0–106.0% using the established method, which showed a good linearity in the range of 8.0–4.0 × 10⁴ μg L−1. The results showed that MFMA-MIPs could be applied for the separation of scopolamine from tropane alkaloids.
Monoethyl fumarate with two functional groups was introduced to prepare a MIP for the separation of scopolamine from tropane alkaloids.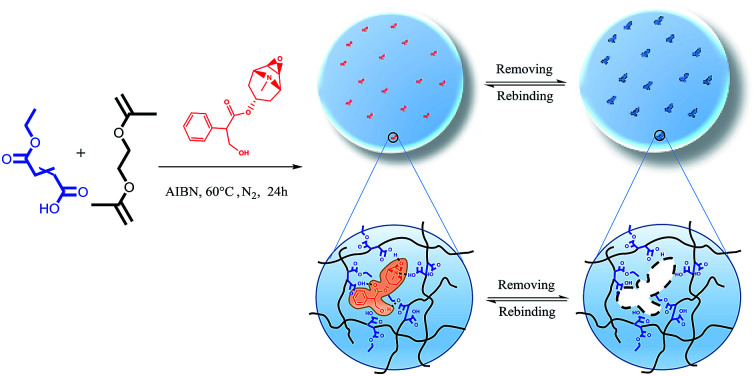
Introduction
Scopolamine is a tropane alkaloid with various pharmacological properties, such as for use as an anticholinergic and for mydriasis, anaesthesia and analgesia. Compared with other tropane alkaloids, scopolamine has the characteristics of a higher curative effect and lower side effects.1–3 However, the lack of a strong chromophore in the tropane alkaloid molecules necessitates detection at low UV wavelengths.4 Under these wavelengths, different kinds of tropane alkaloids strongly interfere with the UV absorption peak signal for scopolamine, which means purification is required prior to high performance liquid chromatography (HPLC) analysis.5,6 Therefore, investigating a method to separate scopolamine from a mixture of tropane alkaloids would be beneficial.
Molecular imprinting is a rapidly developing technique for preparing polymers with specific recognition properties. Firstly, the template and monomer form a stable template–monomer complex before polymerization; the complex is then copolymerized with a cross-linker. The prepared molecularly imprinted polymers (MIPs) will possess specific cavities for capturing the template.7–9 However, it was found that the structures and energies of the stable complex between the conventional functional monomers (methyl acrylate, methyl methacrylate, acrylic acid, etc.) and the tropane alkaloids were similar via theoretical simulations,10,11 which indicated that MIPs prepared using conventional functional monomers have a poor specific extraction ability for scopolamine from tropane alkaloids.12,13 Thus, it is necessary to find a novel functional monomer, instead of a conventional functional monomer, for the separation of scopolamine.
According to previous research, MIPs produced using a bifunctional monomer as a functional monomer have been demonstrated to possess a better recognition ability.14–16 Simultaneously, because of the steric effect of the two adjacent functional groups, the spatial structure of the imprinting surface is more complex after introduction of the cross-linker.17,18 Therefore, it can be inferred that a molecularly imprinted polymer (MIP) produced using monoethyl fumarate (MFMA) as a functional monomer would exhibit a better selectivity and spatial memory effect towards the template.
Moreover, the removal of the template from the complex microcavities is inefficient using Soxhlet extraction,19,20 therefore to solve this problem supercritical carbon dioxide (scCO2) was selected as a substitute for conventional organic solvents owing to their particular physicochemical properties.21 As one of the most widely used fluids in supercritical fluids, scCO2 has many advantages, including being non-toxic, non-flammable, having a low critical point and easy storage.22–24 Most importantly, scCO2 can efficiently extract unreacted monomers, initiators, template molecules and oligomers from the reaction product.25,26 Therefore, utilizing scCO2 as an eluent will be favourable for facilitating the adsorption capacity and selectivity of the MFMA-MIP.
In this work, a novel MIP was prepared by precipitation polymerization using scopolamine as the template, MFMA was used as the functional monomer, and ethylene dimethacrylate (EGDMA) as the cross-linker. The adsorption capacity and selectivity of MFMA-MIP has been investigated. 1H NMR spectroscopy was performed to demonstrate the interactions between the two functional groups of the functional monomer and the template. Finally, MFMA-based MIPs (MFMA-MIPs) were used as a solid phase extraction (SPE) sorbent for scopolamine analysis. The SPE combined with the HPLC method was applied to research a complex of tropane alkaloids and plant samples. This is the first time that MFMA has been introduced as a new functional monomer to prepare a MIP for the separation of scopolamine from tropane alkaloids.
Experimental
Materials and chemicals
Scopolamine (99% purity), atropine (99% purity) and anisodamine (99% purity) were bought from Sigma-Aldrich (Merck KGaA, Darmstadt, Germany). Maleic anhydride (MAH), acrylic acid (AA), ethyl acrylate (EAA), EGDMA, 2,2-azobisisobutylnitrile (AIBN) and anhydrous sodium sulfate (Na2SO4) were bought from Aladdin Bio-Chem Technology Co., Ltd (Shanghai, China). Methanol, ethanol, triethylamine, acetonitrile, acetic acid and hydrochloric acid were supplied by Aladdin Reagent Company (Shanghai, China).
Apparatus
A 5 L self-made supercritical fluid extraction device was used to remove the template from the crude product. 1H NMR spectroscopy were measured using a Bruker Avance 400 MHz NMR spectrometer (Switzerland). Scanning electron microscopy (SEM, Sirion200, USA) was used to observe the morphology of the MIP and the non-molecularly imprinted polymer (NIP). A Nicolet 6700 Fourier Transform Spectrometer (Thermo Fisher Scientific, USA) was used for recording the Fourier transform infrared spectra (FT-IR). UV-Vis absorption spectra were obtained using a UV-3600Plus UV-VIS spectrophotometer (Shimadzu, Japan). The content of the complex and plant samples was determined using a HPLC-UV (HP1100).
Synthesis of MFMA
After maleic anhydride (0.98 g, 10 mmol) was dissolved in ethanol (25 mL), triethylamine (1 mL) was added dropwise and the mixture heated to reflux. The reaction was continued for 6 h and then cooled to room temperature. After that, the residual solvent was removed at low pressure. The residue was dissolved in 10 mL of water and the mixture was then acidified with 2 mL of concentrated hydrochloric acid. The aqueous phase was extracted with a large amount of dichloromethane, and the operation was repeated three times before collection of the lower organic phase, which was dried over anhydrous Na2SO4, filtrated and evaporated to obtain pure MFMA.27 The structure of the synthetic functional monomer was identified using 1H NMR spectra. 1H NMR (400 MHz, DMSO-d6) δ: 1.21 (t, J = 8 Hz, 3H), 4.14 (dd, J1 = 4 Hz, J2 = 8 Hz, 2H), 6.36 (q, J = 12 Hz, 2H), 12.97 (s, 1H), as seen in Fig. S1,† which proved that MFMA had been successfully synthesized.
Synthesis of MIPs
Preparation of MFMA-MIP
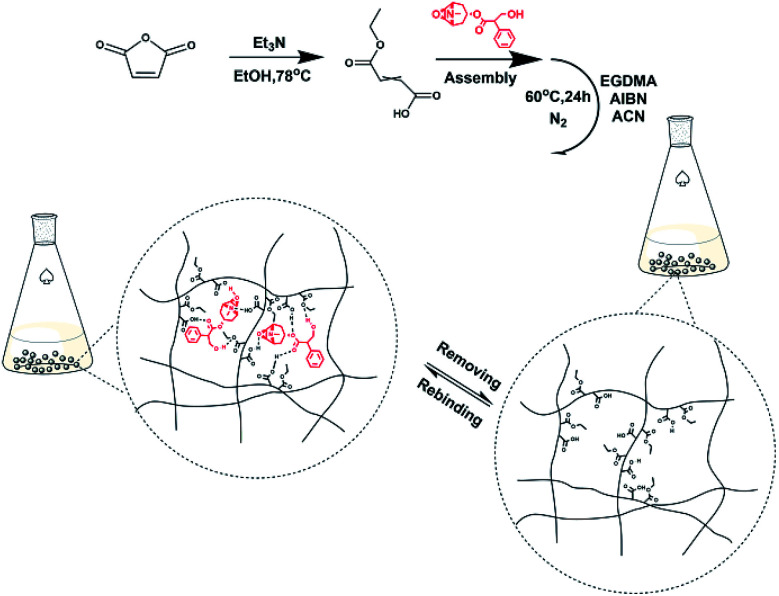
MFMA-MIP was synthesized by precipitation polymerization using scopolamine (30.3 mg, 0.1 mmol) as the template, MFMA (57.6 mg, 0.4 mmol) as the functional monomer, EGDMA (317.1 mg, 1.6 mmol) as a cross-linker, AIBN (16.4 mg, 0.1 mmol) as an initiator and acetonitrile (25 mL) as the reaction solvent. The synthetic procedures of MFMA and MFMA-MIP are depicted in Fig. 1. Before polymerization, the mixture of the template and the functional monomer was stored in the refrigerator for 12 h to strengthen the combination. It took 30 min to remove the dissolved oxygen from the solution by purification with dry nitrogen. After that, the reaction solution was transferred into a three-necked flask, and heated to 60 °C at 200 rpm for 24 h. After the polymerization reaction, the crude polymers were transferred into the self-made supercritical fluid extraction device, and rinsed with a stream of pure scCO2 until UV detection showed no remaining residue.28 As a blank sample conducted in parallel, MFMA-based NIP (MFMA-NIP) was prepared using the same protocol without the addition of scopolamine.
Fig. 1. Schematic illustration of MFMA-MIP and the mechanism for its selective removal of scopolamine.
Preparation of AA-co-EAA-based MIP (AA-co-EAA-MIP)
The synthetic route for AA-co-EAA-MIP was similar to MFMA-MIP, using AA (28.8 mg, 0.4 mmol) and EAA (40.0 mg, 0.4 mmol) instead of MFMA (57.6 mg, 0.4 mmol). As a control, AA-co-EAA-based NIP (AA-co-EAA-NIP) was prepared without adding the template.
Adsorption isotherms
The absorbance of the scopolamine gradient solution was measured at 210 nm using an ultraviolet spectrophotometer. A standard curve was drawn in a suitable absorbance range to obtain a linear relationship between the concentration and the absorbance, and the concentration of scopolamine was derived by the absorbance in the linear range. 5 mg of MIPs or non-molecularly imprinted polymers (NIPs) with scopolamine as the template were added to 2 mL of different concentrations of scopolamine solution, and the centrifuge tube, which oscillates in a constant temperature oscillator (25 °C) for 6 h, was sealed. After adsorption the solution was first centrifuged at 5000 rpm for 10 min, and then the supernatant was taken to determine the concentration. The difference in solution concentration before and after the adsorption equilibrium was calculated. The adsorption properties of the MIPs or NIPs with scopolamine as a template are depicted using eqn (1):29
 |
1 |
In which Qe (mg g−1) is the equilibrium adsorption capacity associated with the MIPs or NIPs with scopolamine as a template, and C0 and Ce (mg mL−1) are the initial and equilibrium concentrations of the template solutions, respectively. V (mL) is the volume of the complex solution, and m (g) is the mass of the MIPs or NIPs with scopolamine as a template.
Selectivity
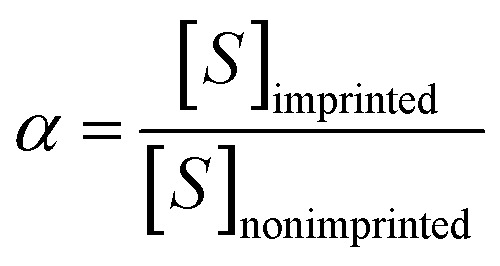
In order to study the selectivity of the imprinted MIPs and NIPs, atropine and anisodamine, which have a similar structure to scopolamine, were selected as the controls. The MIP or NIP (10 mg) was put into a 10 mL centrifuge tube containing the standard solution with 200 mg L−1 of scopolamine, atropine and anisodamine, respectively. The conditions and steps of the isotherm adsorption experiment were duplicated to obtain the solution concentration before and after the selectivity adsorption equilibrium. The data above were substituted into the following eqn (2)–(4) (ref. 30 and 31) to obtain the parameters of the distribution coefficient ([Sb]), selectivity coefficient (α) and the relative selectivity coefficient (β).
 |
2 |
 |
3 |
 |
4 |
In which [S]imprinted and [S]nonimprinted are the distribution coefficient of the scopolamine-imprinted MIPs and NIPs, respectively, and αT and αX are the selectivity coefficient for scopolamine and its analogues.
Procedures for molecularly imprinted SPE (MISPE)
MFMA-MIPs (100 mg) were filled into a SPE column with organic filter screens at the top and the bottom to avoid the leakage of MIPs. After conditioning with methanol (10 mL), the MISPE was then washed with dichloromethane (5 mL) for removal of the interfering compounds.32 Under optimized conditions, methanol solution (10 mL) containing the samples was added into the MISPE column. 5.0 mL of methanol–ethyl acetate (10 : 90, v/v) was used for the removal of the interfering matrix. After this, the column was eluted using 2 mL of methanol : 2% acetic acid aqueous solution (60 : 40, v/v). The eluted solvent was concentrated to a dry powder, and then dissolved in dichloromethane (1 mL). The components of the above described solvent were investigated using HPLC on a Diamonsil C18 reversed-phase column (4.6 mm × 250 mm, 5 μm) at a temperature of 30 °C. The mobile phase used for the HPLC analysis was methanol : 0.05 M ammonium acetate aqueous solution (40 : 60, v/v) with a flow rate of 1.0 mL min−1. The diode-array detector (DAD) was set at 210 nm to acquire the chromatograms.
Application
After drying for 24 h at 30 °C under vacuum, Hindu Datura, Belladonna and Hyoscyamus niger L were crushed to a powder. The powder (50 mg) was then dissolved in 2 mol L−1 hydrochloric acid solution (250 mL), and then ultrasound was applied for 2 h. 10 mL of the supernatant was added with ammonia to adjust the pH value to 8–9, and it was then extracted with dichloromethane, and dried and dissolved with methanol (50 mL).33 Finally, two aliquots of the methanol solution (10 mL), containing 0.05 and 0.10 mg L−1 scopolamine respectively, were loaded into the MFMA-MISPE column. The plant samples were loaded under optimized conditions, and the components of the eluent were detected using HPLC.
Results and discussion
Removal of the template on MFMA-MIP
Upon removal of the template, a large number of specific cavities, which match the shapes of the template, are exposed for capture of the target. Therefore, the degree of removal of the template has a significant influence on the saturated adsorption capacity and the selectivity of MIPs. According to reports, owing to the unique physicochemical properties of scCO2, it has a high potential for the extraction process, which means the extraction efficiency is ten times higher than traditional organic solvent processes.26,28 Compared with Soxhlet extraction, the swelling method using scCO2 is more likely to remove the molecules encapsulated in the crosslinked network. In order to evaluate the removal efficiency of scopolamine from MFMA-MIP, the Soxhlet extraction and the swelling method were applied to elute the polymers, respectively.
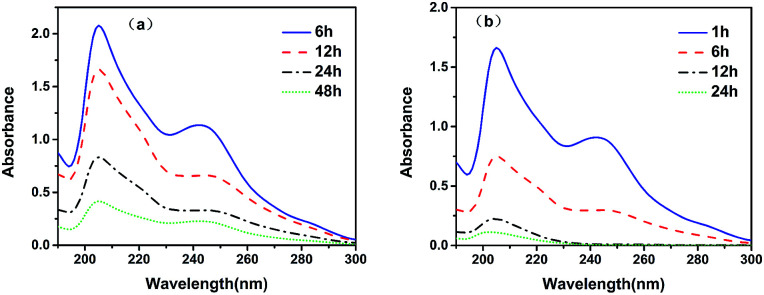
After extraction of the template, the eluate had two UV absorption peaks at 210 and 250 nm, respectively. The UV absorption peak of scopolamine generally appears close to 210 nm, while the UV absorption peak of unreacted functional monomers and oligomers appear close to 250 nm. As seen from Fig. 2a, with the increasing extraction time, the absorbance of the UV absorption peaks at 210 and 250 nm of the eluate after Soxhlet extraction decreases. However, after elution for 48 h, the elution solution still had significant absorbance at 210 and 250 nm, mainly due to the difficulty of extracting impurities encapsulated in the MIPs with conventional organic solvents. Fig. 2b shows that over 98% of the impurities were removed after extraction with scCO2 for 24 h. After 12 h of elution, the UV absorption peak at 250 nm disappeared, indicating that the scCO2 swelling extraction could efficiently remove impurities enclosed in the MIPs. Therefore, the swelling method using scCO2 can completely remove impurities, and improve the adsorption capacity and selectivity of MFMA-MIP.
Fig. 2. UV absorption spectrum of the removal of scopolamine with the elution time. (a) Soxhlet extraction; (b) the swelling method using scCO2.
Characterization
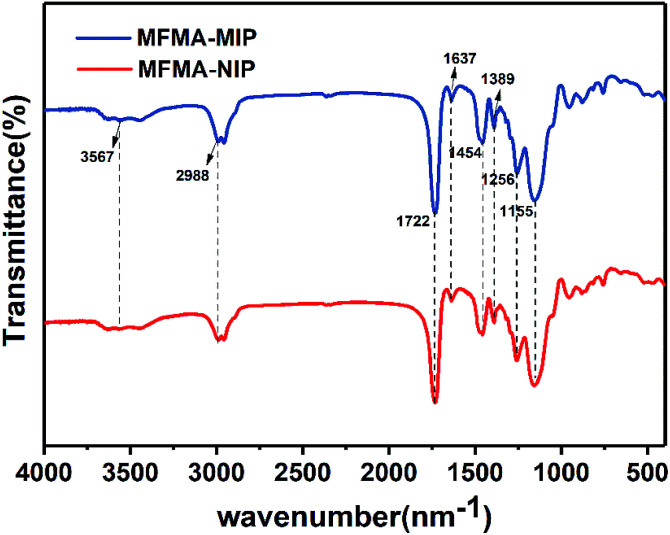
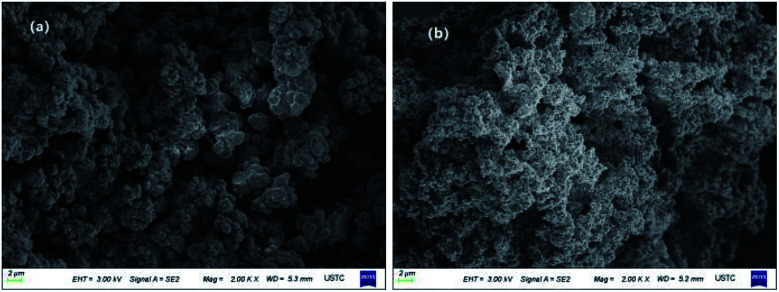
Fig. 3 shows the FT-IR spectra of MFMA-MIP and MFMA-NIP. The adsorption peaks at 1155 and 1256 cm−1 belong to the C–O symmetric stretching vibrations and asymmetric stretching vibrations of the ester bond in MFMA and EGDMA, respectively. The absorption peak at 1389 cm−1 can be attributed to the stretching vibrations of the C–C/C–O groups, while the adsorption peak at 1454 cm−1 is attributed to the stretching vibrations of the C–O–C groups.34 The characteristic peak for the carbonyl groups can be found at 1722 cm−1. The multiple adsorption peaks at 2988 cm−1 were assigned to the C–H stretching vibrations of the methyl groups. Owing to the intramolecular hydrogen bonding, the adsorption peak at 3567 cm−1 can be assigned to the O–H stretching vibrations of the carboxyl, which are distributed widely.35 As shown above, MFMA-MIP and MFMA-NIP were successfully synthesized. In addition, the characteristic peaks of MFMA-MIP and MFMA-NIP were not found in the FT-IR spectra, revealing that the templates had been completely removed. The SEM images showed that the microsphere structure of MIP and NIP were connected together, which could be attributed to the precipitation polymerization (Fig. 4).
Fig. 3. FT-IR spectra of MFMA-MIP and MFMA-NIP.
Fig. 4. SEM images of the polymers: (a) MFMA-NIP; and (b) MFMA-MIP.
Binding isotherms
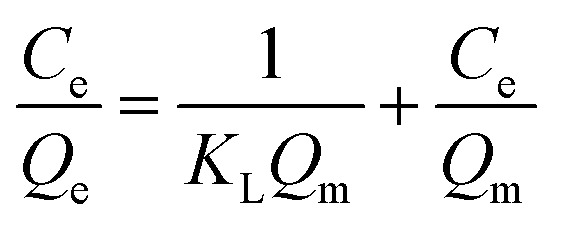
In order to determine the isothermal adsorption capacity of MIP and NIP, a scopolamine gradient solution (10–250 mg L−1) was utilized for obtaining the amount of adsorption for the polymers (5 mg). The Langmuir and Freundlich isotherm models (eqn. 5 and 6)36 were established to investigate the saturation adsorption capacity and adsorption mechanism of MIP and NIP:
 |
5 |
 |
6 |
In which Ce is the equilibrium concentration of scopolamine (mg L−1), Qe and Qm are the equilibrium and maximum adsorption capacity (mg g−1), KL is the Langmuir constant, and KF (mg g−1) and n are the Freundlich constants.
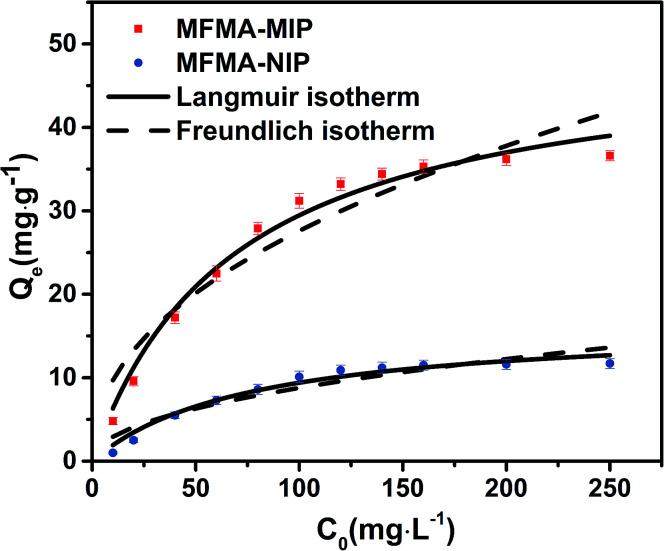
As depicted in Fig. 5, the adsorption capacity of MFMA-MIP was obviously enhanced as the concentration of scopolamine increased. In contrast, the Qe of MFMA-NIP did not change significantly with increasing C0. The maximum Qe of MFMA-MIP in the experiment was 36.6 mg g−1, while that of MFMA-NIP was 11.7 mg g−1. The results indicate that MFMA-MIP has a better adsorption capacity towards scopolamine. Therefore, MFMA-MIP could be a good candidate to separate scopolamine from the plant samples.
Fig. 5. Langmuir isotherm and Freundlich isotherm of MFMA-MIP and MFMA-NIP.
The binding capacity and mechanism of MIP and NIP were described using the Langmuir and Freundlich models. It can be seen from Table 1 that the coefficients of determination (R2) for scopolamine adsorption by MFMA-MIP were 0.9814 and 0.9055, while for scopolamine adsorption by MFMA-NIP the results were 0.9673 and 0.8834. The results show that the binding isotherms from MFMA-MIP and MFMA-NIP can be better fitted using the Langmuir model. The Langmuir model indicates that binding with scopolamine for MIP and NIP occurs on a homogeneous surface.37 Furthermore, the maximum adsorption capacity of MFMA-MIP (49.75 mg g−1) and MFMA-NIP (16.57 mg g−1) was obtained from the Langmuir model prediction, which indicated that MFMA-MIP exhibited a better adsorption performance than MFMA-NIP. The results described above show that MFMA-MIP has a sufficiently high specific binding capacity to establish SPE as an adsorbent for scopolamine analysis.
Isotherm parameters for scopolamine binding by MFMA-MIP and MFMA-NIP from the two isotherm models.
| T (K) | Sorbent | Langmuir isotherm | Freundlich isotherm | ||||
|---|---|---|---|---|---|---|---|
| R 2 | Q m (mg g−1) | K L (L mg−1) | R 2 | K F (mg g−1) | 1/n | ||
| 298 | MFMA-MIP | 0.9814 | 49.75 | 0.0145 | 0.9055 | 3.4134 | 0.4539 |
| MFMA-NIP | 0.9673 | 16.57 | 0.0131 | 0.8834 | 0.9730 | 0.4779 | |
Selectivity study
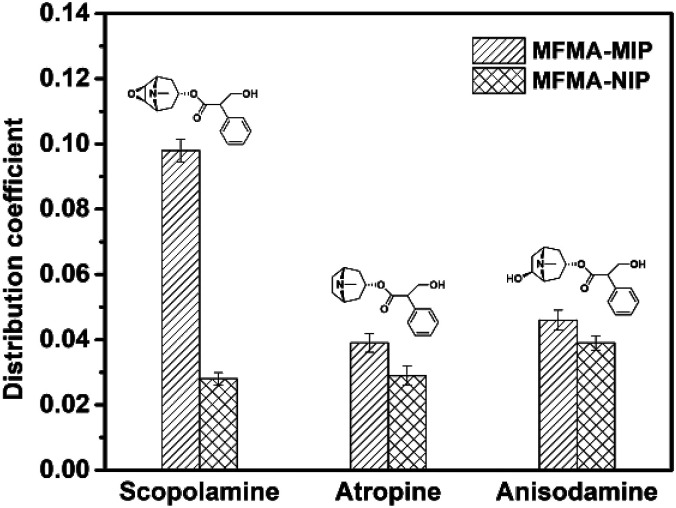
The selectivity of MIPs and NIPs was evaluated using atropine and anisodamine as the structural analogues of scopolamine. Fig. 6 shows that the distribution coefficients of MFMA-MIP for scopolamine, atropine and anisodamine were 0.098, 0.039 and 0.046, respectively. However, the distribution coefficients of MFMA-NIP were 0.028, 0.029 and 0.038. As seen from Table 2, the selectivity coefficients of MFMA-MIP for scopolamine, atropine and anisodamine were 3.5, 1.3 and 1.2. The above described experimental data demonstrates that MFMA-MIP possesses a better specific recognition toward scopolamine compared to its analogues.
Fig. 6. Distribution coefficient of MFMA-MIP and MFMA-NIP towards different substrates.
α and β of MFMA-MIP and AA-co-EAA-MIP towards different substrates.
| Substrate | MFMA-MIP | AA-co-EAA-MIP | ||
|---|---|---|---|---|
| α | β | α | β | |
| Scopolamine | 3.5 | 1.0 | 3.0 | 1.0 |
| Atropine | 1.3 | 2.7 | 2.4 | 1.3 |
| Anisodamine | 1.2 | 2.9 | 1.8 | 1.7 |
As a control, AA-co-EAA-MIP was prepared with the conventional functional monomers to verify the selectivity of MFMA-MIP. It can be seen from Table 2 that the selectivity coefficients of AA-co-EAA-MIP for scopolamine, atropine and anisodamine were 3.0, 2.4 and 1.8. The relative selectivity coefficients of MFMA-MIP for scopolamine, atropine and anisodamine were 1.0, 2.7 and 2.9, while those of AA-co-EAA-MIP for scopolamine, atropine and anisodamine were 1.0, 1.3 and 1.7. The abovementioned results demonstrate that MFMA-MIP has a better specific adsorption capacity towards scopolamine than AA-co-EAA-MIP. In this work, MFMA was utilized as a new functional monomer for the preparation of MIPs and successfully facilitated the specific recognition of polymers for scopolamine.
Binding mechanism
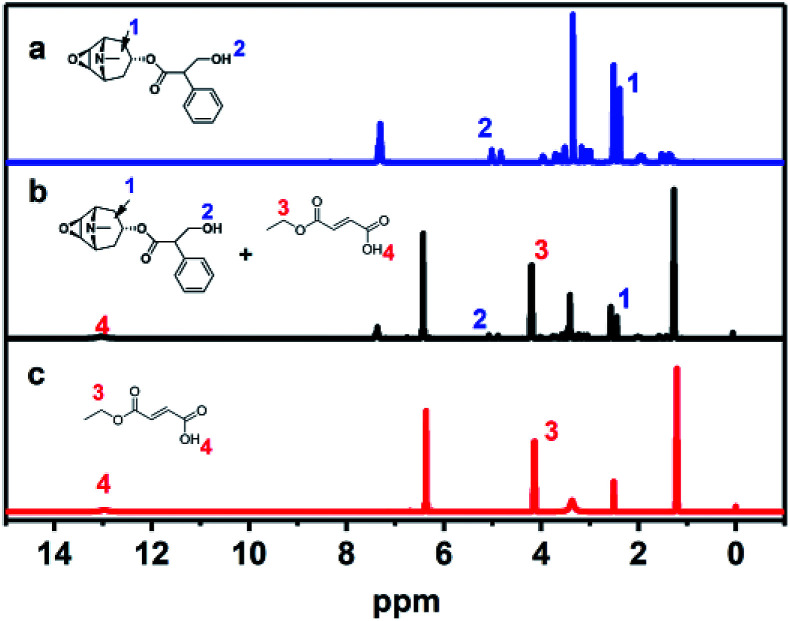
To investigate the adsorption mechanism of MFMA-MIP, scopolamine solution (0.05 mmol L−1, DMSO-d6), MFMA solution (0.20 mmol L−1, DMSO-d6) and a mixture of scopolamine (0.05 mmol L−1) + MFMA (0.20 mmol L−1) in DMSO-d6 were prepared to obtain the chemical shifts of the protons. As shown in Fig. 7, the O–C–H proton (1) on the naphthenic hydrocarbon of scopolamine was shifted downfield from 3.510 to 3.645 ppm in the mixture of scopolamine + MFMA, while the proton (4) on the carboxyl group of MFMA shifted downfield from 12.970 to 13.010 ppm in the mixture of scopolamine + MFMA. The abovementioned data indicated that the ether group of scopolamine could pair with MFMA to form hydrogen bonds, and the carboxyl group of MFMA was involved in template recognition. Simultaneously, the proton (2) of scopolamine was shifted from 5.010 to 5.120 ppm in the mixture of scopolamine + MFMA, and the proton (3) of MFMA moved from 4.135 4.240 ppm in the mixture of scopolamine + MFMA. These downfield signals suggested that the ester group of the MFMA participates in hydrogen bonding, and hydroxyl groups of scopolamine could pair with the esters of MFMA to form hydrogen bonds.38 The above described result indicates that the two functional groups of MFMA are involved in identifying different sites of the template, and contribute to the complexity of the spatial cavities. In addition, it can be seen from Fig. 1 that the cavity structure of the imprinting surface would be more complex upon introduction of the MFMA pair with EGDMA. These results suggest that MFMA as a functional monomer has contributed to the enhancement of the adsorption capacity and the selectivity of MIP owing to the unique monomer structure.
Fig. 7. 1H NMR spectra of scopolamine, scopolamine + MFMA and MFMA in DMSO: (a) scopolamine; (b) scopolamine + MFMA; and (c) MFMA.
Selectivity evaluation of MISPE
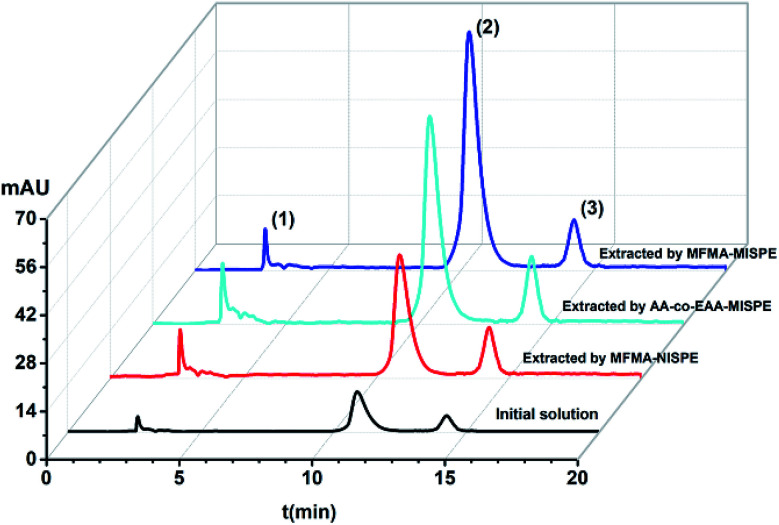
In order to evaluate the selectivity of MISPE and the non-molecularly imprinted SPE (NISPE) column, 10 mL methanol solution containing scopolamine (5.0 mg L−1), atropine (0.5 mg L−1) and anisodamine (0.5 mg L−1) was transferred to the MFMA-MISPE, MFMA-NISPE and AA-co-EAA-MISPE columns under optimized conditions. The content of the initial mixed solution and the eluent was detected using HPLC. As seen from Fig. 8, the signal strength for peak 2 of scopolamine was obviously enhanced after extraction using the MFMA-MISPE column. The recovery of scopolamine (97.0–107.0%) was significantly higher than that of atropine or anisodamine (33.0–39.0%). For comparison, the recovery of the three components in the complex were all below 31.0% after extraction using the MFMA-NISPE column. In addition, the recovery of scopolamine (76.0–82.0%) after extraction using the AA-co-EAA-MISPE column was obviously lower compared to that of scopolamine after extraction using the MFMA-MISPE column. The abovementioned experimental data demonstrate that MFMA-MISPE can be successfully applied for the enrichment of scopolamine recovery in a multi-component mixture, and has the potential for template analysis in real samples.
Fig. 8. Chromatograms obtained for the mixture of scopolamine (peak 2), anisodamine (peak 1) and atropine (peak 3).
Method validation
To verify the MISPE system integrated with HPLC, a favorable linear response was achieved within the scope of 8.0–4.0 × 10⁴ μg L−1with a R2 of 0.9982. Furthermore, the limit of detection (LOD), which represents the minimum detectable concentration, was 2.2 μg L−1. The limit of quantification (LOQ), which represents the smallest amount of analyte measured with a reasonable accuracy, was 6.5 μg L−1. To evaluate the precision of the MISPE for scopolamine analysis, three Hindu Datura samples (each containing added scopolamine, 0.1 mg L−1) were analysed using the MISPE system and a relative standard deviation (RSD) of 2.4% was obtained.
In order to further evaluate the MISPE system, a previously established non-aqueous SPE method using a silica based strong cation exchange39 (SCX-SPE) was used to study the Hindu Datura and Belladonna samples. The data summarized in Table S1† show that the recovery obtained using the MFMA-MISPE method (96.0–106.0%) was higher than that of the SCX-SPE method (78.0–85.0%). The above described results indicate that the MFMA-MISPE method is more advantageous compared to the SCX-SPE method for the extraction of scopolamine from plants samples. Therefore, the MFMA-MISPE system integrated with HPLC is more desirable for the extraction and detection of scopolamine in a mixture of tropane alkaloids.
Analysis of real samples
To verify the application of MISPE for the extraction of scopolamine from plant samples, three aliquots of methanol solution (10 mL) from a mixture of Hindu Datura, Belladonna and Hyoscyamus niger L were loaded into MFMA-MISPE under the optimized conditions, and the components of the eluent were detected using HPLC. The recovery (%), RSD (%) and the amount detected (mg L−1) are summarized in Table 3. It was observed that scopolamine could not be detected in the initial samples of solution without the added template. In the spiked Hindu Datura, Belladonna and Hyoscyamus niger L samples, the recovery of scopolamine was 96.0–106.0%, and the RSD was less than 4.1%. The above described results indicate that the prepared MFMA-MISPE combined with the detection of HPLC can be efficiently applied for the determination and separation of scopolamine in plant samples.
Determination of scopolamine in spiked plant samples using the MFMA-MISPE method.
| Samples | Amount added (mg L−1) | Detected (mg L−1) | Recovery (%) | RSD (%) |
|---|---|---|---|---|
| Hindu Datura | — | NDa | — | — |
| 0.050 | 0.051 | 102 | 3.4 | |
| 0.100 | 0.096 | 96 | 2.7 | |
| Belladonna | — | ND | — | — |
| 0.050 | 0.053 | 106 | 4.1 | |
| 0.100 | 0.099 | 99 | 3.5 | |
| Hyoscyamus niger L | — | 0.011 | — | — |
| 0.050 | 0.060 | 98 | 2.9 | |
| 0.100 | 0.107 | 96 | 4.0 |
ND is not detected.
Reusability
The MFMA-MISPE system built using MFMA-MIP must have the ability to repeatedly extract scopolamine from plant samples containing scopolamine. Therefore, the MFMA-MISPE column was washed with a fresh stream of scCO2 on a stainless steel reactor for 0.5 h to achieve column regeneration, and then the spiked samples were loaded according to the previous experimental conditions. The extraction recovery of scopolamine obtained was above 96.0% after 25 cycles, which indicated that the MFMA-MISPE column had a good repeatability and stability. In summary, the established MFMA-MISPE system is practical for the separation of scopolamine from plant samples.
Conclusions
In this paper, MFMA was introduced to prepare a novel molecular imprinted polymer using scCO2 as the eluent for scopolamine analysis in tropane alkaloids. Up to 98% of the impurities were removed after extraction with scCO2 for 24 h. 1H NMR spectroscopy indicated that both functional groups of MFMA are involved in template recognition. The MFMA-MIP was found to show a high adsorption capacity and selectivity toward scopolamine in a mixture of tropane alkaloids. Finally, the MFMA-MISPE column was successfully applied for the detection and separation of trace amounts of scopolamine in plant samples with recoveries of 96.0–106.0%, and the established MFMA-MISPE system showed good regeneration and reusability. Thus, the MFMA-MISPE method could provide a better solution for the separation of scopolamine from tropane alkaloids.
Conflicts of interest
There are no conflicts to declare.
Supplementary Material
Acknowledgments
This work was financially supported by the Natural Science Foundation of Anhui Provincial Science and Technology Major Project of China (No. 16030801111) and the Anhui Provincial Natural Science Foundation (No. 1808085MC77).
Electronic supplementary information (ESI) available. See DOI: 10.1039/c9ra03542g
Notes and references
- Lochner M. Thompson A. J. Neuropharmacology. 2016;108:220–228. doi: 10.1016/j.neuropharm.2016.04.027. [DOI] [PMC free article] [PubMed] [Google Scholar]
- Wohleb E. S. Gerhard D. Thomas A. Duman S. R. Curr. Neuropharmacol. 2017;15:11–20. doi: 10.2174/1570159X14666160309114549. [DOI] [PMC free article] [PubMed] [Google Scholar]
- Clissold S. P. Heel R. C. Drugs. 1985;29:189–207. doi: 10.2165/00003495-198529030-00001. [DOI] [PubMed] [Google Scholar]
- Miraldi E. Masti A. Ferri S. Comparini I. B. Fitoterapia. 2001;72:644–648. doi: 10.1016/S0367-326X(01)00291-X. [DOI] [PubMed] [Google Scholar]
- Humam M. Shoul T. Jeannerat D. Muñoz O. Christen P. Molecules. 2011;16:7199–7209. doi: 10.3390/molecules16097199. [DOI] [PMC free article] [PubMed] [Google Scholar]
- Cirlini M. Demuth T. M. Biancardi A. Rychlik M. Dall'Asta C. Bruni R. Food Chem. 2018;239:141–147. doi: 10.1016/j.foodchem.2017.06.028. [DOI] [PubMed] [Google Scholar]
- Ye L. Mosbach K. Chem. Mater. 2008;20:859–868. doi: 10.1021/cm703190w. [DOI] [Google Scholar]
- Niu M. Pham-Huy C. He H. Microchim. Acta. 2016;183:2677–2695. doi: 10.1007/s00604-016-1930-4. [DOI] [Google Scholar]
- Qiao F. Sun H. Yan H. Row K. H. Chromatographia. 2006;64:625–634. doi: 10.1365/s10337-006-0097-2. [DOI] [Google Scholar]
- Bujak R. Gadzała-Kopciuch R. Nowaczyk A. Raczak-Gutknecht J. Kordalewska M. Struck-Lewicka W. Buszewski B. Talanta. 2016;146:401–409. doi: 10.1016/j.talanta.2015.08.066. [DOI] [PubMed] [Google Scholar]
- Romera-Torres A. Romero-González R. Vidal J. L. M. Frenich A. G. J. Chromatogr. A. 2018;1564:1–15. doi: 10.1016/j.chroma.2018.06.004. [DOI] [PubMed] [Google Scholar]
- Theodoridis G. Kantifes A. Manesiotis P. Raikos N. Tsoukali-Papadopoulou H. J. Chromatogr. A. 2003;987:103–109. doi: 10.1016/S0021-9673(02)02048-4. [DOI] [PubMed] [Google Scholar]
- Nakamura M. Ono M. Nakajima T. Ito Y. Aketo T. Haginaka J. J. Pharm. Biomed. Anal. 2005;37:231–237. doi: 10.1016/j.jpba.2004.10.017. [DOI] [PubMed] [Google Scholar]
- Lettau K. Warsinke A. Katterle M. Danielsson B. Scheller F. W. Angew. Chem., Int. Ed. 2006;45:6986–6990. doi: 10.1002/anie.200601796. [DOI] [PubMed] [Google Scholar]
- Duan F. Chen C. Zhao X. Yang Y. Liu X. Qin Y. Environ. Sci.: Nano. 2016;3:213–222. doi: 10.1039/C5EN00198F. [DOI] [Google Scholar]
- Araki K. Goto M. Furusaki S. Anal. Chim. Acta. 2002;469:173–181. doi: 10.1016/S0003-2670(02)00664-5. [DOI] [Google Scholar]
- Luckham and P. F. Adv. Colloid Interface Sci. 1991;34:191–215. doi: 10.1016/0001-8686(91)80051-K. [DOI] [Google Scholar]
- Guo H. C. Ye E. Li Z. Han M. Y. Loh X. J. Mater. Sci. Eng., C. 2017;70:1182–1191. doi: 10.1016/j.msec.2016.01.093. [DOI] [PubMed] [Google Scholar]
- Ang Q. Y. Chan F. Tan P. C. Low S. C. J. Sol-Gel Sci. Technol. 2018;86:226–238. doi: 10.1007/s10971-018-4608-z. [DOI] [Google Scholar]
- Behbahani M. Hassanlou P. G. Amini M. M. Moazami H. R. Abandansari H. S. Bagheri A. Zadeh S. H. Food Anal. Methods. 2015;8:558–568. doi: 10.1007/s12161-014-9924-5. [DOI] [Google Scholar]
- Kiran E. J. Supercrit. Fluids. 2016;110:126–153. doi: 10.1016/j.supflu.2015.11.011. [DOI] [Google Scholar]
- Crespi F. Gavagnin G. Sánchez D. Martínez G. S. Appl. Energy. 2017;195:152–183. doi: 10.1016/j.apenergy.2017.02.048. [DOI] [Google Scholar]
- Wang S. Javadpour F. Feng Q. Fuel. 2016;181:741–758. doi: 10.1016/j.fuel.2016.05.057. [DOI] [Google Scholar]
- Lu Y. Ao X. Tang J. Jia Y. Zhang X. Chen Y. J. Nat. Gas Sci. Eng. 2016;30:268–275. doi: 10.1016/j.jngse.2016.02.011. [DOI] [Google Scholar]
- Rebocho S. Cordas C. M. Viveiros R. Casimiro T. J. Supercrit. Fluids. 2018;135:98–104. doi: 10.1016/j.supflu.2018.01.006. [DOI] [Google Scholar]
- Lee J. C. Kim C. R. Byun H. S. Korean J. Chem. Eng. 2014;31:2266–2273. doi: 10.1007/s11814-014-0178-0. [DOI] [Google Scholar]
- Volonterio A. Ramirez de Arellano C. Zanda M. J. Org. Chem. 2005;70:2161–2170. doi: 10.1021/jo0480848. [DOI] [PubMed] [Google Scholar]
- Marcelo G. Ferreira I. C. Viveiros R. Casimiro T. Int. J. Pharm. 2018;542:125–131. doi: 10.1016/j.ijpharm.2018.03.010. [DOI] [PubMed] [Google Scholar]
- Saad E. M. Madbouly A. Ayoub N. El Nashar R. M. Anal. Chim. Acta. 2015;877:80–89. doi: 10.1016/j.aca.2015.03.047. [DOI] [PubMed] [Google Scholar]
- An F. Q. Li H. F. Guo X. D. Gao B. J. Hu T. P. Gao J. F. RSC Adv. 2019;9:2431–2440. doi: 10.1039/C8RA09948K. [DOI] [PMC free article] [PubMed] [Google Scholar]
- Li G. R. Xu M. Y. Li J. K. Yang Y. RSC Adv. 2018;8:37401–37409. doi: 10.1039/C8RA06992A. [DOI] [PMC free article] [PubMed] [Google Scholar]
- Xie J. Zhou B. Zhang T. Zeng X. Yang M. Wang W. Yang J. Anal. Methods. 2018;10:3637–3644. doi: 10.1039/C8AY00616D. [DOI] [Google Scholar]
- Jakabová S. Vincze L. Farkas Á. Kilár F. Boros B. Felinger A. J. Chromatogr. A. 2012;1232:295–301. doi: 10.1016/j.chroma.2012.02.036. [DOI] [PubMed] [Google Scholar]
- Wei J. R. Ni Y. L. Zhang W. Zhang Z. Q. Zhang J. Anal. Chim. Acta. 2017;960:110–116. doi: 10.1016/j.aca.2016.12.046. [DOI] [PubMed] [Google Scholar]
- Cormack P. A. Elorza A. Z. J. Chromatogr. B: Anal. Technol. Biomed. Life Sci. 2004;804:173–182. doi: 10.1016/j.jchromb.2004.02.013. [DOI] [PubMed] [Google Scholar]
- Xue G. Gao M. Gu Z. Luo Z. Hu Z. Chem. Eng. J. 2013;218:223–231. doi: 10.1016/j.cej.2012.12.045. [DOI] [Google Scholar]
- Fan J. P. Tian Z. Y. Tong S. Zhang X. H. Xie Y. L. Xu R. Ouyang X. K. Food Chem. 2013;141:3578–3585. doi: 10.1016/j.foodchem.2013.06.040. [DOI] [PubMed] [Google Scholar]
- Desai R. K. Streefland M. Wijffels R. H. Eppink M. H. Green Chem. 2014;16:2670–2679. doi: 10.1039/C3GC42631A. [DOI] [Google Scholar]
- Long Z. Wang C. Guo Z. Zhang X. Nordahl L. Zeng J. Liang X. Analyst. 2012;137:1451–1457. doi: 10.1039/C2AN15824H. [DOI] [PubMed] [Google Scholar]
Associated Data
This section collects any data citations, data availability statements, or supplementary materials included in this article.


