

Abstract
Aims
It has been reported that a staging system combining N‐terminal pro‐B‐type natriuretic peptide and high‐sensitivity troponin T (hs‐cTnT) or estimated glomerular filtration rate (eGFR) is useful in patients with wild‐type transthyretin amyloid cardiomyopathy (ATTRwt‐CM). However, these studies were mainly conducted in Western countries, and their usefulness for the Japanese population is unclear. We examined and validated the staging system using hs‐cTnT, eGFR, and B‐type natriuretic peptide (BNP) in Japanese patients with ATTRwt‐CM.
Methods and results
We retrospectively evaluated 176 patients with ATTRwt‐CM. The cut‐off values of hs‐cTnT and eGFR were selected as 0.05 ng/mL and 45 mL/min/1.73 m2, respectively, based on a previous report. The optimal cut‐off value of BNP was 255.6 pg/mL to predict all‐cause mortality (sensitivity, 75%; specificity, 58%; area under the curve, 0.69; 95% confidence interval [CI], 0.61–0.78; P < 0.001) based on a receiver operating characteristic curve. We defined the cut‐off value of BNP as 250 pg/mL. Increased hs‐cTnT (>0.05 ng/mL) and BNP (>250 pg/mL) and decreased eGFR (<45 mL/min/1.73 m2) were significant predictors of poor prognosis (P < 0.05). We calculated the score by adding 1 point if hs‐cTnT and BNP levels increased or eGFR decreased by more than the cut‐off value. The hazard ratio of all‐cause death adjusted by age and sex, using score 0 as a reference, was 0.44 (95% CI 0.08–2.49, P = 0.44) for score 1, 3.69 (95% CI 1.21–11.21, P = 0.02) for score 2, and 5.40 (95% CI 1.57–18.54, P = 0.007) for score 3. We divided patients into a low score group (0–1 point) and high score group (2–3 points). Kaplan–Meier analyses revealed significant differences in all‐cause death and rehospitalization for heart failure (log rank test; P < 0.001), and after adjusting for sex and age, the hazard ratio of all‐cause death was 6.96 (95% Cl 2.88–16.83, P < 0.001) and that for rehospitalization for heart failure was 4.27 (95% Cl 2.26–8.07, P < 0.001) in the high‐risk group, compared with those in the low‐risk group. The median survival period was 32.0 months in the high‐risk group.
Conclusions
This simple staging system, which combines hs‐cTnT, BNP, and eGFR, was useful for predicting prognosis in Japanese patients with ATTRwt‐CM. This system can objectively evaluate the disease progression of ATTRwt‐CM and may be useful for patient selection for disease‐modifying therapy.
Keywords: Transthyretin, Amyloid cardiomyopathy, Staging, Biomarker
Introduction
Amyloidosis is a disease of protein misfolding that leads to amyloid fibril deposition in organs and tissues throughout the body. Transthyretin amyloid cardiomyopathy (ATTR‐CM) is a progressive and fatal infiltrative cardiomyopathy that leads to heart failure. 1 , 2 ATTR is classified into two subtypes depending on the presence or absence of transthyretin (TTR) gene mutations: hereditary ATTR (ATTRv) and wild‐type ATTR (ATTRwt). Wild‐type transthyretin amyloid cardiomyopathy (ATTRwt‐CM) is considered a rare disease; however, recent studies have shown that the disease is more common in the elderly than originally considered, and several post‐mortem studies found cardiac amyloid deposition in up to 25% of individuals >80 years of age. 3 In addition, non‐invasive imaging evaluations, bone scintigraphy, and cardiac magnetic resonance imaging make diagnosis easier. 4 , 5 , 6 Thus, the number of cases diagnosed with ATTRwt‐CM is increasing dramatically. 7 , 8
It is known that early diagnosis and treatment are important for the improvement of clinical outcomes in patients with ATTRwt‐CM. 9 , 10 Therefore, it is important to evaluate the stage of ATTRwt‐CM to predict prognosis and consider the indications for disease‐modifying treatments such as tafamidis. Previous reports suggested a staging system for ATTRwt‐CM using N‐terminal pro‐B‐type natriuretic peptide (NT‐proBNP), high‐sensitivity troponin T (hs‐cTnT), or estimated glomerular filtration rate (eGFR). 11 , 12 However, these staging systems were mainly conducted in Western countries, and it is necessary to validate the clinical utility of ATTRwt‐CM in Japanese patients. It is important to determine the optimal cut‐off value of B‐type natriuretic peptide (BNP), which is commonly used for the evaluation of heart failure in Japan.
Thus, the aim of this study was to validate and modify the staging system using BNP, hs‐cTnT, and eGFR for the prognosis of Japanese patients with ATTRwt‐CM.
Methods
Study population
We retrospectively analysed 188 consecutive patients who had been diagnosed with ATTRwt‐CM at Kumamoto University Hospital between December 2012 and March 2021. Of these patients, 12 were excluded from the analysis because of missing data for hs‐cTnT or BNP. Finally, we evaluated 176 consecutive patients with ATTRwt‐CM. The data on clinical and laboratory findings and echocardiography parameters were obtained.
The study was performed in accordance with the principles outlined in the Declaration of Helsinki. This study was approved by the institutional review board and ethics committees of Kumamoto University (No. 1590). The requirement for informed consent was waived because of the low risk of this retrospective study and the inability to obtain consent directly from all subjects. Further, we extensively promoted this study protocol at Kumamoto University Hospital and on our website (http://www.kumadai‐junnai.com) and gave patients the opportunity to withdraw from the study.
Biomarker analysis
Biomarker analysis was performed while the patient was in a clinically stable condition after diuretic therapy, if needed during the diagnosis process. Serum hs‐cTnT levels (normal cut‐off value 0.014 pg/mL) were measured during diagnosis using the Elecsys 2010 Troponin T hs kit (Roche Diagnostics, Indianapolis, IN, USA) with fifth generation assay. Plasma BNP (normal cut‐off value 18.4 pg/mL) levels were measured using the MI02 Shionogi BNP kit (Abbott Japan, Matsudo, Japan). The glomerular filtration rate was calculated using the level‐modified Modification of Diet in Renal Disease study equation which was modified for Japanese patients. 13
Diagnosis of wild‐type transthyretin amyloid cardiomyopathy
The diagnosis of amyloid deposition was based on the detection of apple‐green birefringence using cross‐polarised light microscopy after Congo red staining. To confirm that the amyloid deposition was TTR, we performed immunohistochemical staining using antibodies that reacted with TTR. We diagnosed ATTRwt based on the absence of mutation in the TTR gene, which was revealed by genetic testing, or the absence of family history of amyloidosis in the elderly patients if genetic testing was not performed.
ATTR‐CM was diagnosed by (i) presence of TTR deposition in the myocardium, (ii) presence of TTR deposition in extracardiac tissue, such as subcutaneous or gastrointestinal tract tissue with positive 99mTc‐labelled pyrophosphate (99mTc‐PYP) scintigraphy findings, or (iii) positive 99mTc‐PYP scintigraphy findings without confirmation of pathological TTR deposition and with exclusion of light chain (AL) amyloidosis by serum and urine protein electrophoresis, immunofixation electrophoresis, and evaluation of serum free light chains (Freelite, The Binding Site Group Ltd., Birmingham, UK). According to the Japanese Circulation Society 2020 guideline on diagnosis and treatment of cardiac amyloidosis, processed (i) and (ii) could diagnose ‘definite’ ATTR‐CM, and (iii) could diagnose ‘probable’ ATTR‐CM. 14
Clinical follow‐up and prognosis
Mortality and hospitalization for heart failure were identified by a search of the medical records and were confirmed by a questionnaire and direct contact via a telephone interview of the patient, or if deceased, of a family member. Hospitalization for heart failure was defined as an unexpected hospitalization for heart failure.
Statistical analysis
The last date of data collection was in March 2021. Parameters were expressed as median with interquartile range (IQR). Categorical variables were presented as numbers (percentages). The optimal cut‐off value of hs‐cTnT was 0.056 ng/mL (sensitivity, 75%; specificity, 61%; area under the curve, 0.70; 95% confidence interval [CI], 0.61–078; P < 0.001) and eGFR was 47 mL/min/1.73 m2 (sensitivity, 71%; specificity, 61%; area under the curve, 0.70; 95% CI, 0.62–0.79; P < 0.001) to predict all‐cause mortality as binary endpoint based on a receiver operating characteristic curve (Figure 1A, B ). These cut‐off values were close to those in previous studies. 9 , 10 Therefore, we selected the cut‐off values of hs‐cTnT and eGFR as 0.05 ng/mL and 45 mL/min/1.73 m2. The optimal cut‐off value of BNP was 255.6 pg/mL to predict all‐cause mortality (sensitivity, 75%; specificity, 58%; area under the curve, 0.69; 95% CI, 0.61–0.78; P < 0.001) based on a receiver operating characteristic curve (Figure 1C ). We defined the cut‐off value of BNP as 250 pg/mL (sensitivity 71%, specificity 48%). Kaplan–Meier curves for all‐cause mortality and rehospitalization due to worsening heart failure and univariate and multivariate Cox regression analyses adjusted for age and sex were used to assess the prognostic association. Statistical significance was set at P < 0.05. All statistical analyses were performed using SPSS version 26 (SPSS Inc., Chicago, IL, USA) software.
Figure 1.
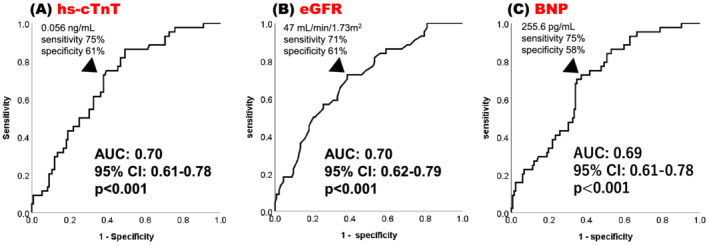
Receiver operating characteristic curve analyses to determine the optimal cut‐off value to predict all‐cause mortality for hs‐cTnT (A), eGFR (B), and BNP (C).
AUC, area under the curve; BNP, B‐type natriuretic peptide; CI, confidence interval; eGFR, estimated glomerular filtration rate; hs‐cTnT, high‐sensitivity cardiac troponin T.
Results
The baseline characteristics of all patients in the test cohort are shown in Table 1 . The median age at diagnosis was 78 years (IQR: 73–83 years), and 149 (85%) patients were men. Almost all patients were symptomatic (New York Heart Association [NYHA] classification ≥II, 86%). In the laboratory data, the median hs‐cTnT, BNP, and eGFR were 0.0551 ng/mL (IQR: 0.0391–0.0850 ng/mL), 255.6 pg/mL (IQR: 152.6–442.3 pg/mL), and 50.0 mL/min/1.73 m2 (IQR: 40.8–61.8 mL/min/1.73 m2), respectively. Ninety‐nine (56%) patients were diagnosed with ATTR‐CM due to amyloid deposition on endomyocardial biopsy. Thirty‐three (19%) patients were pathologically diagnosed using tissues from other organs and positive 99mTc‐PYP scintigraphy findings. These two groups (75%) were categorised into the ‘definite’ diagnosis group, and 44 (25%) patients were in the ‘probable’ diagnosis group. A total of 133 (76%) patients underwent genetic testing, and all of them were diagnosed with ATTRwt based on the absence of TTR mutations.
Table 1.
Baseline clinical characteristics of ATTRwt‐CM patients in this study
| N or N (%) | Median value | (Q1–Q3) | |
|---|---|---|---|
| Age at diagnosis | 176 | 78 | 73–83 |
| Male | 149 (85) | ||
| Past medical history | |||
| Hypertension | 89 (51) | ||
| Diabetes | 40 (23) | ||
| Dyslipidaemia | 53 (30) | ||
| Atrial fibrillation | 89 (51) | ||
| Carpal tunnel syndrome | 87 (56, n = 154) | ||
| Prior HF hospitalization | 69 (39) | ||
| Biomarkers | |||
| hs‐cTnT (ng/mL) | 176 | 0.0551 | 0.0391–0.0850 |
| >0.05 ng/mL | 99 (56) | ||
| BNP (pg/mL) | 176 | 255.6 | 152.6–442.3 |
| >250 pg/mL | 93 (53) | ||
| Creatinine (mg/dL) | 176 | 1.04 | 0.88–1.27 |
| eGFR (mL/min/1.73 m2) | 176 | 50.0 | 40.8–61.8 |
| <45 mL/min/1.73 m2 | 58 (33) | ||
| Sodium (mEq/L) | 176 | 140 | 138–141 |
| Echocardiography | |||
| LVEF (%) | 176 | 53.4 | 44.5–59.7 |
| LVDd (mm) | 176 | 40.7 | 37.7–44.8 |
| LVDs (mm) | 176 | 30.9 | 27.1–35.5 |
| IVSd (mm) | 176 | 15.5 | 13.7–17.1 |
| LVPWd (mm) | 176 | 15.7 | 13.6–17.7 |
| Diagnosis | |||
| Definite | 132 (75) | ||
| Probable | 44 (25) | ||
| NYHA | 172 | ||
| I | 24 (14) | ||
| II | 77 (45) | ||
| III | 68 (40) | ||
| IV | 3 (2) | ||
| Treatment | |||
| RAS‐I | 74 (42) | ||
| MRA | 53 (30) | ||
| Beta‐blocker | 45 (26) | ||
| Diuretics | 123 (70) | ||
| Clinical outcome | |||
| Readmission for worsening heart failure | 55 (31) | ||
| Freedom of rehospitalization (month) | 176 | 35.3 | 14.7–77.7 |
| Mortality | 44 (25) | ||
| Cardiac death | 32 (18) | ||
| Survival period (months) | 176 | 59.7 | 26.2–91.1 |
ATTRwt‐CM, wild‐type transthyretin amyloid cardiomyopathy; BNP, B‐type natriuretic peptide; EF, ejection fraction; eGFR, estimated glomerular filtration rate; HF, heart failure; hs‐cTnT, high‐sensitivity cardiac troponin T; IVSd, interventricular septum diameter; LVDd, left ventricular diastolic diameter; LVDs, left ventricular systolic diameter; LVPWd, left ventricular posterior wall diameter; MRA, mineralocorticoid receptor antagonist; NYHA, New York Heart Association; RAS‐I, renin–angiotensin system inhibitor.
Data are expressed as median [interquartile range] or n (%).
The median follow‐up period was 21.0 months (IQR: 9.2–35.6 months) and 44 patients (25%) died during the observation period, of which 32 were related to cardiac deaths. The median survival of these patients was 59.7 months (IQR: 26.2–91.1 months). In addition, 55 patients (31%) required hospitalization due to exacerbation of heart failure, and the median freedom from rehospitalization period was 35.3 months (IQR: 14.7–77.7 months). Kaplan–Meier analysis of survival probabilities and event‐free periods for heart failure stratified by hs‐cTnT (cut‐off: 0.05 ng/mL), BNP (cut‐off: 250 pg/mL), and eGFR (cut‐off: 45 mL/min/1.73 m2) are shown in Figure 2A–C and Figure 3A–C , respectively. Hs‐cTnT >0.05 ng/mL, BNP > 250 pg/mL, and eGFR <45 mL/min/1.73 m2 were predicted to have poor clinical outcomes (log rank: P < 0.05). We calculated the score by adding 1 point if hs‐cTnT and BNP levels increased or eGFR decreased by more than the cut‐off value. The percentage of the population who met these cut‐off values were 56%, 53%, and 33%, and scores of 0, 1, 2, and 3 were obtained by 26%, 27%, 26%, and 21% of patients, respectively. Survival probabilities and event‐free periods for heart failure assessed by Kaplan–Meier analysis and stratified by this score are shown in Figures 4A, B . The hazard ratio for all‐cause mortality adjusted by age and sex, using score 0 as a reference, was 0.44 (95% CI 0.08–2.49, P = 0.44) for score 1, 3.69 (95% CI 1.21–11.21, P = 0.02) for score 2, and 5.40 (95% CI 1.57–18.54, P = 0.007) for score 3. In addition, the hazard ratio for rehospitalization was 1.86 (95% CI 0.57–6.16, P = 0.31) for score 1, 5.36 (95% CI 1.82–15.80, P = 0.002) for score 2, and 8.54 (95% CI 2.38–30.74, P = 0.001) for score 3 (Table 2 ).
Figure 2.
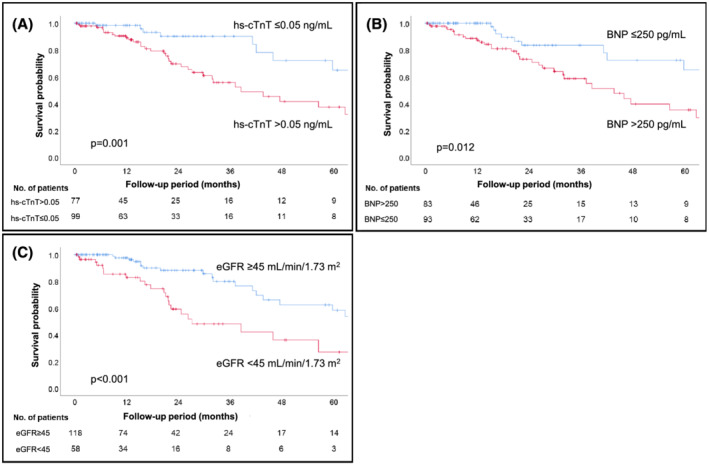
Kaplan–Meier analyses show that the cut‐off values of each biomarker (A: hs‐cTnT >0.05 ng/mL, B: BNP > 250 pg/mL, C: eGFR <45 mL/min/1.73 m2) were useful for predicting all‐cause mortality. BNP, B‐type natriuretic peptide; eGFR, estimated glomerular filtration rate; hs‐cTnT, high‐sensitivity cardiac troponin T.
Figure 3.
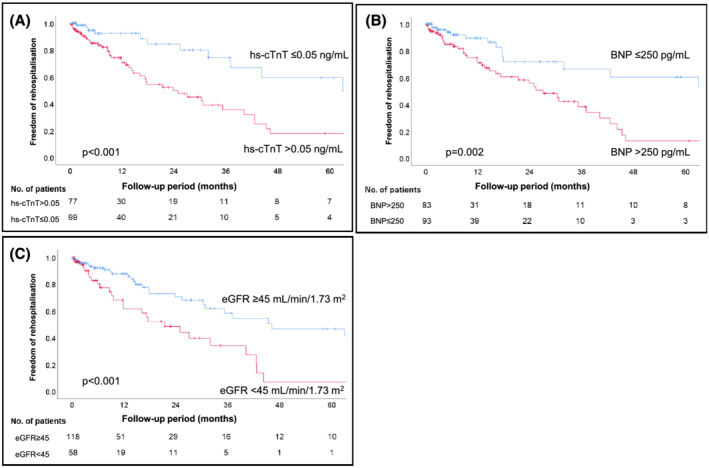
Kaplan–Meier analyses show that the cut‐off values of each biomarker (A: hs‐cTnT >0.05 ng/mL, B: BNP > 250 pg/mL, C: eGFR <45 mL/min/1.73 m2) and scoring system were useful for predicting freedom from rehospitalization for heart failure. BNP, B‐type natriuretic peptide; eGFR, estimated glomerular filtration rate; hs‐cTnT, high‐sensitivity cardiac troponin T.
Figure 4.
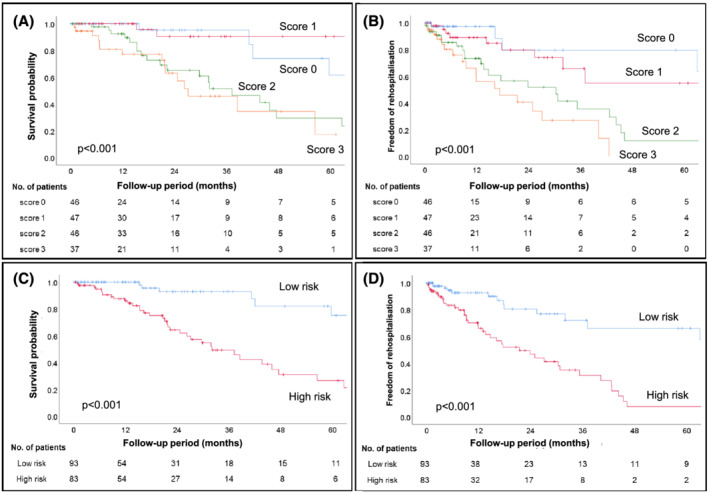
Each score and risk group (low‐risk group, scores 0–1 and high‐risk group, scores 2–3) was analysed by Kaplan–Meier analyses, and there were clear differences in their all‐cause mortality (A, C) and freedom from rehospitalization for heart failure (B, D).
Table 2.
Multivariate Cox hazard analysis adjusted for age and sex by score and risk group
| Survival probability | Freedom from rehospitalization for heart failure | |||
|---|---|---|---|---|
| Hazard ratio (95% CI) | P‐value | Hazard ratio (95% CI) | P‐value | |
| Score | ||||
| 0 | Ref. | Ref. | ||
| 1 | 0.438 (0.077–2.494) | 0.438 | 1.860 (0.566–6.115) | 0.307 |
| 2 | 3.688 (1.213–11.209) | 0.021 | 5.364 (1.821–15.800) | 0.002 |
| 3 | 5.400 (1.573–18.536) | 0.007 | 8.544 (2.375–30.738) | 0.001 |
| Adjusted for age and sex. | ||||
| Risk group | ||||
| Low risk | Ref. | Ref. | ||
| High risk | 6.958 (2.877–16.827) | <0.001 | 4.273 (2.262–8.070) | <0.001 |
| Adjusted for age and sex. | ||||
95% CI, 95% confidence interval; Ref., reference.
We then divided the study patients into two groups by score totals: low‐risk group (0–1 scores) and high‐risk group (2–3 scores). Survival probabilities and freedom from rehospitalization for heart failure by Kaplan–Meier analysis of the stratified low/high‐score groups are shown in Figures 4C, D . The high‐score group had significantly poorer clinical outcomes than the low‐score group (log rank test; P < 0.01). Although the median survival period for all‐cause mortality by Kaplan–Meier analysis was 59.7 months (IQR: 26.2–91.1 months) in all patients, it was low in the high‐risk group (32.0 months, IQR: 20.6–62.7 months). Similarly, the median freedom from rehospitalization for heart failure was 35.3 months (IQR: 14.7–77.7 months) in all patients, but it was 21.4 months (32.0 months, IQR: 9.2–42.6 months) in the high‐risk group. Subsequently, we performed Kaplan–Meier analysis by dividing into cardiovascular death (CV death) and non‐CV death (Figure 5A, B ). Kaplan–Meier analysis for CV death revealed significant difference between low‐risk group and high‐risk group (log rank P < 0.001). On the other hand, there was no significant difference for non‐CV death (log rank P = 0.158).
Figure 5.
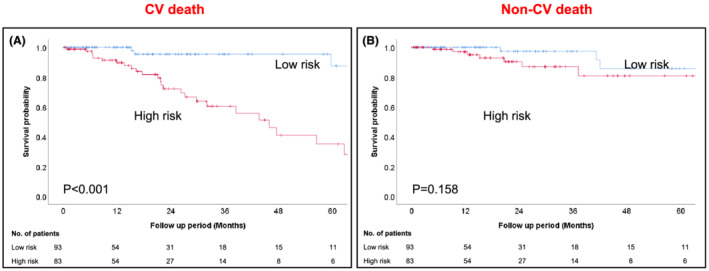
Kaplan–Meier analysis shows significant differences between low‐risk group and high‐risk group in cardiovascular death (A), but not in non‐cardiovascular death (B).
Furthermore, we performed Cox proportional analysis to evaluate the impact of this staging system on all‐cause mortality and heart failure rehospitalization. After adjusting for age and sex, the hazard ratio of all‐cause death was 6.96 (95% Cl: 2.88–16.83, P < 0.001) and for freedom from rehospitalization for worsening heart failure was 4.27 (95% Cl: 2.26–8.07, P < 0.001) in the high‐risk group, compared with those in the low‐risk group (Table 2 ).
Based on the Mayo staging system, 11 the patients were divided into three staging groups according to the cut‐off values of BNP and hs‐cTnT; neither cut‐off value was satisfied in stage 1, either one was satisfied in stage 2, and both were satisfied in stage 3. Kaplan–Meier analysis was performed by adding eGFR to each stage. The patients in stage 2 were further stratified by adding eGFR to their survival probability (log rank P < 0.001, Figure 6B ), whereas those who were in stage 1 (Figure 6A ) and 3 (Figure 6C ) showed less difference in stratification (log rank P = 0.436 and P = 0.292, respectively). Similarly, according to the UK staging system, 12 which was staged using each cut‐off value of BNP and eGFR, patients in stage 2 were further stratified by adding hs‐cTnT to their survival probability (log rank; stage 1: P = 0.241, stage 2: P = 0.004, stage 3: P = 0.678, respectively) (Figure 6D–F ).
Figure 6.
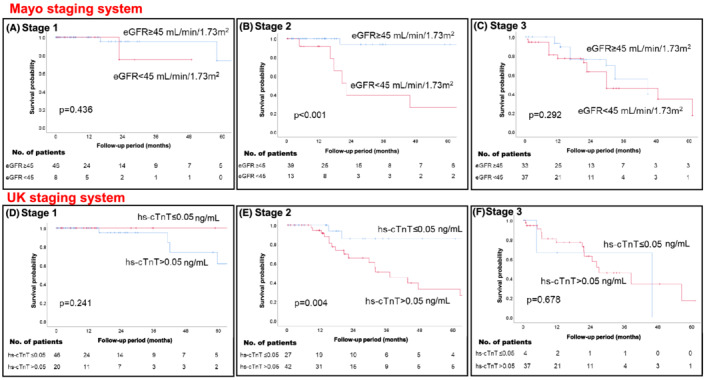
The patients were divided into three staging groups using BNP > 250 pg/mL and hs‐cTnT >0.05 ng/mL as per the Mayo staging system, and Kaplan–Meier analysis was performed for each stage with an additional parameter of eGFR <45 mL/min/1.73 m2 (stage 1: A, stage 2: B, and stage 3: C). Further, the patients were divided into three staging groups using BNP > 250 pg/mL and eGFR <45 mL/min/1.73 m2, as per the UK staging system; Kaplan–Meier analysis was performed for each stage with an additional parameter, hs‐cTnT >0.05 ng/mL (stage 1: D, stage 2: E, and stage 3: F). BNP, B‐type natriuretic peptide; eGFR, estimated glomerular filtration rate; hs‐cTnT, high‐sensitivity cardiac troponin T.
Discussion
In this study, we presented and validated a simple staging system using three universal biomarkers (hs‐cTnT for myocardial injury, BNP for heart failure, and eGFR for renal function) in Japanese patients with ATTRwt‐CM. This system is useful for risk stratification with high objectivity and repeatability and does not require any special diagnostic equipment. As previously reported in the Mayo 11 and UK staging systems, 12 hs‐cTnT >0.05 ng/mL and eGFR <45 mL/min/1.73 m2 were predictive of poor prognosis. A higher BNP level (>250 pg/mL) was also a poor prognostic factor in our study. The high‐risk group (≥2 score) had a higher probability of all‐cause death (median survival: 32.0 months) and rehospitalization for worsening heart failure compared with the low‐risk group (≤1 score). In addition, our staging system was especially useful for predicting the prognosis of cardiovascular death.
The novelty of our staging system was in stratifying using BNP instead of NT‐proBNP and clearly distinguishing the prognosis of the intermediate‐risk group using three biomarkers. The NT‐proBNP level is known to be more affected by renal function than BNP. 15 Most ATTRwt‐CM patients are elderly and often have impaired renal function. 7 Therefore, NT‐proBNP levels may increase with the severity of heart failure in patients with impaired renal function. The combination of BNP and eGFR as biomarkers is reasonable for the evaluation of heart failure and impaired renal function separately. The clarification of cut‐off value in BNP is meaningful for the management of ATTR‐CM patients among BNP users. In addition, the Mayo and UK staging systems are divided into three staging groups using two biomarkers (NT‐proBNP and hs‐cTnT or eGFR). 11 , 12 Clinically determining interventions for the intermediate‐risk group (stage 2) is often daunting, especially when it comes to expensive treatments such as tafamidis. Our study showed that adding one parameter to the approach used in each of the previous reports, such as eGFR for the Mayo staging system and hs‐cTnT for the UK staging system, clearly distinguished the prognosis of the intermediate‐risk group. Finally, the staging system that was established in previous studies were conducted in Western countries. We considered that it is important to validate the utility of the biomarker guide stating system in Japanese/Asian patients with ATTR‐CM.
The Mayo and UK staging systems had a cut‐off value of 3000 pg/mL for NT‐pro BNP. 11 , 12 Although it is difficult to generalize these values due to renal function and several factors in ATTRwt‐CM, it has been reported that NT‐pro BNP levels are 5–6 times higher than BNP levels. 15 Therefore, the cut‐off value of BNP is estimated to be 500–600 pg/mL, but our cut‐off value of BNP (250 pg/mL) was lower than that expected. The median NT‐proBNP levels in a previous study (Mayo study: 2838 pg/mL and UK study: 3036 pg/mL) and BNP levels in our study (255.6 pg/mL) were approximately equal to each cut‐off value. This discrepancy may be due to less advanced heart failure in our study patients compared with those in previous studies. The median survival period of our study patients was 59.7 months, which is longer than that of the Mayo (43 months) and UK studies (57 months). In addition, a higher ratio of NT‐proBNP to BNP caused by impaired renal function may have affected our lower‐than‐expected cut‐off level of BNP.
ATTRwt‐CM treatment has received increased attention recently because tafamidis (a TTR stabiliser) improved clinical outcomes in a transthyretin amyloidosis cardiomyopathy clinical trial. 10 However, there are several problems, such as the high cost of drugs and unproven efficacy in advanced heart failure. 16 Therefore, it is important to discuss the types of patients for whom the drug will be most effective and methods for evaluating ATTR‐CM progression. In ATTR‐ACT trial, the NYHA classification was used for the evaluation of heart failure severity and efficacy of tafamidis. However, it is difficult to estimate the NYHA functional class according to the progression of heart failure in ATTR‐CM because of comorbidities such as orthopaedic diseases, frailty, and respiratory dysfunction in the elderly. 17 Evaluation of ATTR‐CM progression based on clinical stages that are identified using biomarkers is desirable because of the objectivity and reproducibility of biomarkers. Further studies are warranted to evaluate the utility of the staging system using biomarkers for patient selection for tafamidis treatment and assessing the efficacy of disease‐modifying therapy.
This study has few limitations. First, our study was a retrospective single‐centre study and comprised a smaller number of cases than previous cohort studies. Nonetheless, this study is the only large‐scale study on ATTRwt‐CM in Asia. There is a risk of overfitting and lack of external validity; therefore, we need to perform external validity to evaluate the utility of our model. Second, genetic testing was not performed in 24% of the cases; therefore, a definite diagnosis of ATTRwt‐CM could not be established due to the absence of family history of amyloidosis in these cases. Third, biomarkers were evaluated only at the time of diagnosis. Serial changes in biomarkers and clinical stage and importance were not evaluated. Large prospective studies are warranted to clarify this deficiency. Fourth, we performed receiver operating characteristic curve and net reclassification improvement analyses to evaluate the superiority of our three‐variables model compared with the previous two‐variables risk models. 11 , 12 There was no statistical significance in prognostic utility; however, our findings suggested the potential benefits of risk stratification by using multiple variables. Finally, the median follow‐up period was shorter than that in two other studies.
In conclusion, our simple staging system using hs‐cTnT, BNP, and eGFR was useful for predicting clinical outcomes in Japanese patients with ATTRwt‐CM. This system can objectively evaluate the disease progression of ATTRwt‐CM and may be useful for predicting prognosis and patient selection for disease‐modifying therapy.
Conflict of interest
None declared.
Funding
This work was supported by the Japan Agency for Medical Research and Development (grant number 20ek0109466h0001) and JSPS KAKENHI (grant number 21K08131).
Nakashima, N. , Takashio, S. , Morioka, M. , Nishi, M. , Yamada, T. , Hirakawa, K. , Ishii, M. , Tabata, N. , Yamanaga, K. , Fujisue, K. , Sueta, D. , Kanazawa, H. , Hoshiyama, T. , Hanatani, S. , Araki, S. , Usuku, H. , Yamamoto, E. , Ueda, M. , Matsushita, K. , and Tsujita, K. (2022) A simple staging system using biomarkers for wild‐type transthyretin amyloid cardiomyopathy in Japan. ESC Heart Failure, 9: 1731–1739. 10.1002/ehf2.13847.
References
- 1. Izumiya Y, Takashio S, Oda S, Yamashita Y, Tsujita K. Recent advances in diagnosis and treatment of cardiac amyloidosis. J Cardiol. 2018; 71: 135–143. [DOI] [PubMed] [Google Scholar]
- 2. Garcia‐Pavia P, Rapezzi C, Adler Y, Arad M, Basso C, Brucato A, et al. Diagnosis and treatment of cardiac amyloidosis: a position statement of the ESC Working Group on Myocardial and Pericardial Diseases. Eur Heart J. 2021; 42: 1554–1568. [DOI] [PMC free article] [PubMed] [Google Scholar]
- 3. Mohammed SF, Mirzoyev SA, Edwards WD, Dogan A, Grogan DR, Dunlay SM, et al. Left ventricular amyloid deposition in patients with heart failure and preserved ejection fraction. JACC Heart Fail. 2014; 2: 113–122. [DOI] [PMC free article] [PubMed] [Google Scholar]
- 4. Syed IS, Glockner JF, Feng D, Araoz PA, Martinez MW, Edwards WD, et al. Role of cardiac magnetic resonance imaging in the detection of cardiac amyloidosis. JACC Cardiovasc Imaging. 2010; 3: 155–164. [DOI] [PubMed] [Google Scholar]
- 5. Karamitsos TD, Piechnik SK, Banypersad SM, Fontana M, Ntusi NB, Ferreira VM, et al. Noncontrast T1 mapping for the diagnosis of cardiac amyloidosis. JACC Cardiovasc Imag. 2013; 6: 488–497. [DOI] [PubMed] [Google Scholar]
- 6. Gillmore JD, Maurer MS, Falk RH, Merlini G, Damy T, Dispenzieri A, et al. Nonbiopsy diagnosis of cardiac transthyretin amyloidosis. Circulation. 2016; 133: 2404–2412. [DOI] [PubMed] [Google Scholar]
- 7. Yamada T, Takashio S, Arima Y, Nishi M, Morioka M, Hirakawa K, et al. Clinical characteristics and natural history of wild‐type transthyretin amyloid cardiomyopathy in Japan. ESC Heart Fail. 2020; 7: 2829–2837. [DOI] [PMC free article] [PubMed] [Google Scholar]
- 8. Lane T, Fontana M, Martinez‐Naharro A, Quarta CC, Whelan CJ, Petrie A, et al. Natural history, quality of life, and outcome in cardiac transthyretin amyloidosis. Circulation. 2019; 140: 16–26. [DOI] [PubMed] [Google Scholar]
- 9. Kittleson MM, Maurer MS, Ambardekar AV, Bullock‐Palmer RP, Chang PP, Eisen HJ, et al. American Heart Association Heart Failure and Transplantation Committee of the Council on Clinical Cardiology. cardiac amyloidosis: evolving diagnosis and management: a scientific statement from the American Heart Association. Circulation. 2020; 142: e7–e22. [DOI] [PubMed] [Google Scholar]
- 10. Maurer MS, Schwartz JH, Gundapaneni B, Elliott PM, Merlini G, Waddington‐Cruz M, et al. Tafamidis treatment for patients with transthyretin amyloid cardiomyopathy. N Engl J Med. 2018; 379: 1007–1016. [DOI] [PubMed] [Google Scholar]
- 11. Grogan M, Scott CG, Kyle RA, Zeldenrust SR, Gertz MA, Lin G, et al. Natural history of wild‐type transthyretin cardiac amyloidosis and risk stratification using a novel staging system. J Am Coll Cardiol. 2016; 68: 1014–1020. [DOI] [PubMed] [Google Scholar]
- 12. Gillmore JD, Damy T, Fontana M, Hutchinson M, Lachmann HJ, Martinez‐Naharro A, et al. A new staging system for cardiac transthyretin amyloidosis. Eur Heart J. 2018; 39: 2799–2806. [DOI] [PubMed] [Google Scholar]
- 13. Imai E, Horio M, Nitta K, Yamagata K, Iseki K, Hara S, et al. Estimation of glomerular filtration rate by the MDRD study equation modified for Japanese patients with chronic kidney disease. Clin Exp Nephrol. 2007; 11: 41–50. [DOI] [PubMed] [Google Scholar]
- 14. Kitaoka H, Izumi C, Izumiya Y, Inomata T, Ueda M, Kubo T, et al. JCS 2020 guideline on diagnosis and treatment of cardiac amyloidosis. Circ J. 2020; 84: 1610–1671. [DOI] [PubMed] [Google Scholar]
- 15. Weber M, Hamm C. Role of B‐type natriuretic peptide (BNP) and NT‐proBNP in clinical routine. Heart. 2006; 92: 843–849. [DOI] [PMC free article] [PubMed] [Google Scholar]
- 16. Kazi DS, Bellows BK, Baron SJ, Shen C, Cohen DJ, Spertus JA, et al. Cost‐effectiveness of tafamidis therapy for transthyretin amyloid cardiomyopathy. Circulation. 2020; 141: 1214–1224. [DOI] [PMC free article] [PubMed] [Google Scholar]
- 17. Bennett JA, Riegel B, Bittner V, Nichols J. Validity and reliability of the NYHA classes for measuring research outcomes in patients with cardiac disease. Heart Lung. 2002; 31: 262–270. [DOI] [PubMed] [Google Scholar]