

Abstract
Iron is not only essential but also a toxic trace element. Under iron repletion, ferritin maintains cellular iron homeostasis by storing iron to avoid iron toxicity. Under iron depletion, the ferritin‐specific autophagy adaptor NCOA4 delivers ferritin to lysosomes via macroautophagy to enable cells to use stored iron. Here, we show that NCOA4 also plays crucial roles in the regulation of ferritin fate under iron repletion. NCOA4 forms insoluble condensates via multivalent interactions generated by the binding of iron to its intrinsically disordered region. This sequesters NCOA4 away from ferritin and allows ferritin accumulation in the early phase of iron repletion. Under prolonged iron repletion, NCOA4 condensates can deliver ferritin to lysosomes via a TAX1BP1‐dependent non‐canonical autophagy pathway, thereby preventing relative iron deficiency due to excessive iron storage and reduced iron uptake. Together, these observations suggest that the NCOA4‐ferritin axis modulates intracellular iron homeostasis in accordance with cellular iron availability.
Keywords: autophagy, ferritin, iron metabolism, NCOA4, phase separation
Subject Categories: Autophagy & Cell Death
Iron‐dependent NCOA4 condensation regulates ferritin fate and cellular iron homeostasis by modulating ferritin autophagy pathways and interaction between NCOA4 and ferritin.

Introduction
Iron is an essential nutrient for almost all organisms because it is used in many biological processes, including DNA synthesis, energy production, and oxygen transport (Hentze et al, 2010). Meanwhile, excess iron is toxic because it induces the generation of reactive oxygen species, which oxidatively damage functional biomolecules such as proteins, lipids, and nucleic acids. Iron‐induced phospholipid peroxidation triggers ferroptosis, a form of programmed cell death (Dixon et al, 2012). Ferroptosis is involved in several pathological processes such as cancer and ischemic disease (Stockwell et al, 2017). Therefore, it is important to develop a precise understanding of the fine regulation of cellular iron metabolism.
Ferritin plays crucial roles in the regulation of cellular iron metabolism by storing iron in cages consisting of 24 subunits of the heavy (FTH1) and light (FTL) chains (Arosio et al, 2017). Ferritin expression is mainly controlled at the post‐transcriptional level by iron regulatory proteins (IRPs) 1 and 2 (Rouault, 2006; Iwai, 2019). When the cell is deprived of iron, IRPs bind to the iron‐responsive element (IRE) in the 5′UTRs of ferritin transcripts and repress their translation. By contrast, under iron‐replete conditions, IRPs lose their IRE‐binding activity, and ferritin expression is upregulated. Ferritin abundance is also post‐translationally regulated by autophagy: specifically, our group reported that ferritin is degraded in the lysosome via autophagy (Asano et al, 2011). Under iron‐depleted conditions, ferritin is delivered to lysosomes to allow the cell to use stored iron, a process mediated by ATG7‐dependent macroautophagy. Nuclear receptor coactivator 4 (NCOA4) is a ferritin‐specific autophagy adaptor in mammalian cells, and deletion of NCOA4 completely inhibits ferritin degradation under iron depletion (Dowdle et al, 2014; Mancias et al, 2014). In addition, NCOA4 delivers ferritin to lysosomes via an ATG7‐independent mechanism in iron‐depleted cells (Goodwin et al, 2017), confirming the essential role of NCOA4 for ferritin delivery to lysosomes under iron depletion. However, we also showed that ferritin is delivered to lysosomes even under iron‐replete conditions via an ATG7‐independent pathway (Asano et al, 2011). In light of the common notion that ferritin protects cells against iron toxicity, it would be of great interest to probe the mechanism underlying ferritin delivery to lysosomes under iron repletion and investigate the contribution of ferritin degradation for the maintenance of cellular iron homeostasis.
Several recent studies have reported that liquid–liquid phase separation (LLPS) and protein assemblies are engaged in a wide range of biological phenomena, including autophagy and environmental sensing (Banani et al, 2017; Shin & Brangwynne, 2017; Noda et al, 2020). LLPS is mediated by multivalent interaction between proteins, often involving their intrinsically disordered regions (IDRs) (Banani et al, 2017; Shin & Brangwynne, 2017). Biomolecular condensates can exhibit various states, such as droplets, gels, or solids, and their properties are important for performing distinct biological processes (Kaganovich, 2017). In autophagy, LLPS is involved in the formation of the pre‐autophagosomal structure (PAS) (Fujioka et al, 2020) and substrate condensation for selective autophagy in Saccharomyces cerevisiae (Yamasaki et al, 2020). Several studies also showed that the fluidic properties of cargo protein condensates (e.g., p62 in mammalian cells) are essential for the efficient engulfment of condensates by autophagosomes (Sun et al, 2018; Zaffagnini et al, 2018; Agudo‐Canalejo et al, 2021). However, relationships between the properties of the components in condensates and autophagic processes have not been fully elucidated. Moreover, little is known about the involvement of protein condensation in the regulation of cellular iron metabolism.
Here, we show that NCOA4 is required for ATG7‐independent autophagy of ferritin in iron‐replete cells. Iron modulates the biochemical properties of NCOA4 to form detergent‐insoluble solid‐like condensates by binding to NCOA4. In the early phase of iron treatment, ferritin accumulates in cells via sequestration from NCOA4 condensates due to attenuated interaction between ferritin and NCOA4. By contrast, under prolonged iron treatment, excess ferritin is delivered to lysosomes along with NCOA4 condensates via ATG7‐independent mechanisms. The NCOA4 condensates are recognized by TAX1BP1 and degraded in an ATG7‐independent manner. Meanwhile, detergent‐soluble ferritin and NCOA4 are targeted to the lysosome by the macroautophagy pathway, for which TAX1BP1 is dispensable. On the basis of these findings, we propose that the NCOA4‐ferritin axis fine‐tunes intracellular iron homeostasis by promoting the formation of biomolecular condensates and attenuating the ferritin interaction through the iron‐binding activity of NCOA4.
Results
NCOA4 forms detergent‐insoluble condensates in iron‐replete cells
We previously showed that ferritin is degraded in an ATG7‐independent manner in iron‐replete primary cells, including mouse embryonic fibroblasts (MEFs). To determine the mechanism underlying ferritin degradation under iron‐replete conditions, we established FACS‐based genome‐wide CRISPR screening using a probe that detects lysosomal delivery of ferritin (Fig EV1A). In cells expressing this probe, equal amounts of RFP and GFP‐Ferritin L chains (GFP‐FTL) are generated after self‐cleavage of RFP fused with GFP‐FTL at the ribosomal skipping 2A sequence. When GFP‐FTL is delivered to lysosomes, GFP fluorescence is quenched in the acidic lysosomal environment, leading to an increase in the fluorescence ratio of RFP over GFP. Thus, the RFP:GFP fluorescence ratio is reduced in cells where lysosomal trafficking of ferritin is inhibited. We infected MEFs stably expressing the probe with the GeCKO CRISPR library (Sanjana et al, 2014; Shalem et al, 2014) and sorted cells with low RFP:GFP ratios twice (Fig EV1B and C). NCOA4 was most highly enriched in this screen (Fig 1A). Hence, we generated NCOA4‐knockout (KO) MEFs using the CRISPR‐Cas9 system to examine the involvement of NCOA4 in ferritin degradation in iron‐replete cells. We treated cells with cycloheximide (CHX), an inhibitor of protein synthesis, and ferric ammonium citrate (FAC) to halt ferritin synthesis because iron increases ferritin production. Ferritin degradation was inhibited in iron‐treated NCOA4 KO MEFs (Fig 1B), suggesting that NCOA4 also plays critical roles in ferritin degradation in iron‐replete cells.
Figure EV1. NCOA4 forms insoluble condensates under iron‐replete conditions.
-
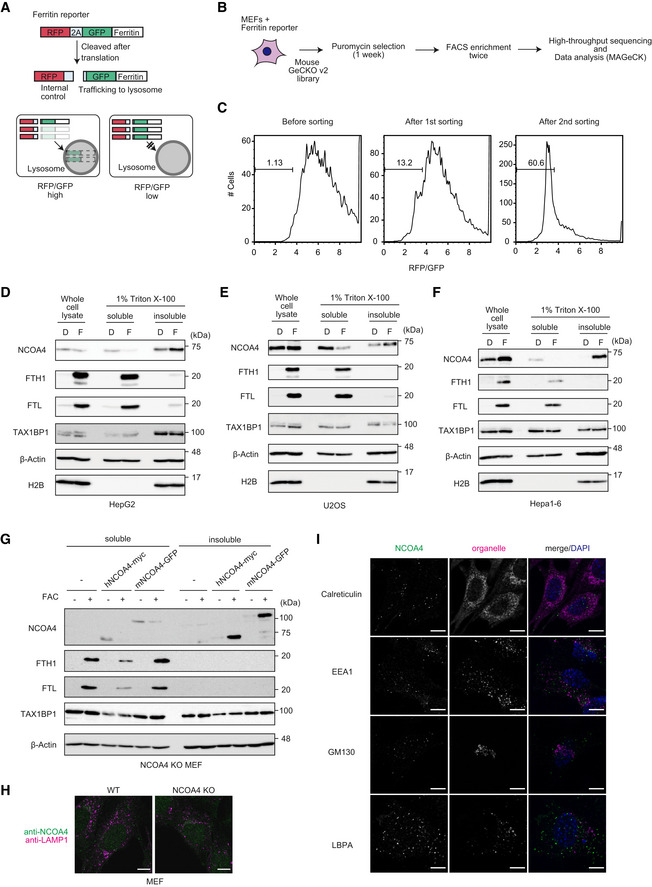
ASchematic diagram of ferritin reporter.
-
BSchematic representation of the CRISPR screening procedure.
-
CRFP/GFP ratio of MEFs expressing ferritin reporter in the CRISPR screen. Representative results from one of two screens are shown.
-
D–G(D) HepG2, (E) U2OS, (F) Hepa1–6, and (G) NCOA4 KO MEFs reconstituted with hNCOA4‐myc or mNCOA4‐GFP were treated or not treated with FAC (indicated as F) or Dfo (indicated as D) for 12 h. Cells were lysed with SDS‐containing sample buffer or Triton buffer and analyzed with immunoblotting with indicated antibodies.
-
HWild type MEFs and NCOA4 KO MEFs were treated with 10 μg/ml FAC for 12 h and then immunostained with anti‐NCOA4 and anti‐LAMP1 antibodies. Scale bar, 10 μm.
-
INCOA4 KO MEFs expressing myc‐hNCOA4 were treated with 10 μg/ml FAC for 12 h and then immunostained with anti‐myc and organelle‐specific antibodies. Scale bar, 10 μm.
Source data are available online for this figure.
Figure 1. NCOA4 forms detergent‐insoluble condensates in iron‐replete cells.

- Results of CRISPR screening analyzed by the MAGeCK algorithm.
- Wild type (WT) and NCOA4 KO MEFs were pretreated with 25 μg/ml ferric ammonium citrate (FAC) for 16 h and then chased with 20 μg/ml cycloheximide (CHX) for the indicated times. Soluble ferritin expression levels were determined by immunoblotting with the indicated antibodies.
- Wild type MEFs untreated or treated with 10 μg/ml FAC for 12 h were lysed with SDS‐containing sample buffer or Triton buffer, and analyzed by immunoblotting with the indicated antibodies.
- Schematic representation of fractionation procedures.
- Subcellular fractions of MEFs treated with 20 μM Dfo for 12 h, 10 μg/ml FAC for 12 h, or 100 μM Deferoxamine (Dfo) for 6 h after treatment with 10 μg/ml FAC for 12 h were prepared by differential centrifugation as described in (D). Each fraction was subjected to SDS–PAGE and analyzed by immunoblotting with the indicated antibodies.
- Wild type MEFs were untreated, treated with 10 μg/ml FAC for 12 h or treated with 10 μg/ml FAC, 10 μM E64d, and 10 μg/ml pepstatin A (pep A) for 12 h. The cells were immunostained with anti‐NCOA4 and anti‐LAMP1. Scale bar, 10 μm. Quantitative data are shown as the means ± SD of three biological replicates. At least 30 cells were quantified in each replicate. P = 0.033 (Welch two sample t‐test).
- NCOA4 puncta were photobleached in MEFs stably expressing NCOA4‐GFP after treatment with 10 μg/ml FAC for 12 h, and then fluorescent recovery was monitored. p62 puncta were photobleached in MEFs stably expressing GFP‐human p62, and then fluorescent recovery was monitored. Representative images are shown. Time 0 indicates the start of recovery after photobleaching. Scale bars, 2 μm.
- Quantitative data of fluorescence recovery in (G) shown as means ± SD. 26 dots (NCOA4) or 25 dots (p62) were quantified from three biological replicates.
- Time‐lapse imaging of MEFs stably expressing NCOA4‐GFP. Representative fusion and fission images are shown. Red arrowheads indicate the fission event. Scale bars, 5 μm.
Source data are available online for this figure.
Because ubiquitin‐dependent degradation of NCOA4 suppresses ferritin degradation under iron repletion (Mancias et al, 2015), we evaluated the amount of NCOA4 in iron‐replete cells. Unexpectedly, under iron repletion, NCOA4 was abundant in the cellular fraction that is insoluble with non‐ionic detergent (Triton X‐100), whereas the amount of NCOA4 in the detergent‐soluble fraction was reduced, as reported previously (Mancias et al, 2015) (Fig 1C). Extraction of proteins from cells with sodium dodecyl sulfate (SDS) lysis buffer revealed that NCOA4 in iron‐replete cells was comparable to that in untreated cells (Fig 1C). By contrast, most ferritin was present in the soluble fraction, and only a marginal amount was present in the insoluble fraction. A similar expression pattern of NCOA4 and ferritin was observed in other cell lines and in NCOA4 KO MEFs reconstituted with tagged‐NCOA4 (Fig EV1D–G). The observation that most NCOA4 was present in different fractions than ferritin in iron‐replete cells appears to argue against the requirement of NCOA4 for ferritin degradation in iron‐replete cells. However, we first focused on investigating the mechanism underlying iron‐induced accumulation of NCOA4, and later examined the roles of NCOA4 in ferritin degradation in iron‐replete cells.
To further dissect the intracellular distribution of NCOA4, we lysed MEFs with hypotonic buffers and fractionated the lysates (Fig 1D). Treatment with the iron chelator deferoxamine (Dfo) revealed that NCOA4 was present in the supernatant obtained after centrifugation at 20,000 g (designated as S20), whereas under iron‐replete conditions, most NCOA4 was present in the pellet obtained after 1,000 g (designated as P1), which contained mainly nuclei and heavy particles (Fig 1E). We next investigated the localization of NCOA4 using immunofluorescence analysis. NCOA4 exhibited diffuse localization in non‐treated MEFs, and administration of iron induced the formation of NCOA4 dot‐like structures (Figs 1F and EV1H). Because NCOA4 condensates did not robustly colocalize with any organelle markers, including LAMP1 (Figs 1F and EV1I), NCOA4 dots were localized in the cytoplasm. Treatment of MEFs with the lysosomal protease inhibitors E64d and pepstatin A increased colocalization of NCOA4 with LAMP1 (Fig 1F), indicating that NCOA4 condensates were eventually delivered to lysosomes.
Recently, membraneless organelles called biomolecular condensates have been implicated in a large number of biological phenomena, including autophagy (Banani et al, 2017; Shin & Brangwynne, 2017; Noda et al, 2020). Properties of cytoplasmic condensates vary from liquid droplets to non‐dynamic solid ones. To explore the nature of NCOA4 condensates, we examined the fluidity of NCOA4 in dot‐like structures using fluorescence recovery after photobleaching (FRAP) assay in cells expressing NCOA4‐GFP. Approximately 7% of the GFP signal was recovered 5 min after photobleaching of NCOA4‐GFP (Fig 1G and H), whereas approximately 30% of the signal of GFP‐p62, which is defined as a gel‐like condensate in several studies (Sun et al, 2018; Zaffagnini et al, 2018), was recovered 5 min after photobleaching. However, we observed fusion and fission of NCOA4‐GFP dots in time‐lapse imaging (Fig 1I), strongly suggesting that NCOA4 condensates are not aggregates, but solid‐like structures having fluidity. Taken together, these results suggest that cellular iron status modulates the biochemical characteristics of NCOA4.
Multivalent interactions are required for NCOA4 condensation under iron‐replete conditions
To dissect the mechanism underlying the formation of NCOA4 condensates, we sought to identify the regions in NCOA4 required for condensation in iron‐replete cells. To this end, we introduced mutants of NCOA4 (Fig 2A) into NCOA4 KO MEFs. NCOA4 wild type (WT), and its N522 (aa 1–522), N441 (aa 1–441), and N334 (aa 1–334) mutants, formed condensates in cells treated with FAC, whereas the N238 (aa 1–238) mutant did not (Fig 2B and C). Immunoblotting confirmed that N522, N441, and N334 mutants, but not N238, were observed in the detergent‐insoluble fraction, as was the case with NCOA4 WT under iron‐replete conditions, suggesting that the NCOA4 aa 239–334 region is involved in the condensation of NCOA4 under iron‐replete conditions. However, the N522, N441, and N334 mutants were also observed in the soluble fraction, in contrast to NCOA4 WT (Fig 2D), suggesting that the C‐terminal region (aa 523–614) is also required for efficient condensation.
Figure 2. Multivalent interactions are required for NCOA4 condensation under iron‐replete conditions.

- Schematic diagram of NCOA4 variants used in this study.
- NCOA4 KO MEFs reconstituted with NCOA4 variants were treated or not treated with 10 μg/ml FAC for 12 h and then fixed for imaging. Cells were immunostained with an anti‐myc antibody. Representative images are shown. Scale bar, 10 μm.
- Number of puncta per cell in (B) is shown as the means ± SEM of at least 40 cells in each condition from two biological replicates.
- NCOA4 KO MEFs reconstituted with NCOA4 variants were treated or not treated with 10 μg/ml FAC for 12 h, fractionated, and analyzed by immunoblotting with the indicated antibodies.
- DISOPRED3 disorder score of human NCOA4.
- Wild type MEFs stably expressing NCOA4 IDR (aa 167–334) fused with tandem FKBP were treated with 10 μg/ml FAC or 20 μM Dfo for 12 h and then cultured with 0.1 nM FKBP ligand (AP20187) for 6 h. The cells were fixed for imaging and immunostained with anti‐myc to analyze the puncta of the fusion protein. Scale bar, 10 μm.
- Number of puncta in (F) are shown as means ± SEM of at least 35 cells in each condition from two biological replicates. P < 0.0001 (Dfo + ligand vs F.AC + ligand) and P = 0.048 (FAC vs. FAC + ligand; Kruskal–Wallis ANOVA with Dunn's multiple comparison test). P values were adjusted using the Bonferroni method.
- Coomassie‐stained SDS–PAGE gel of purified proteins.
- The amount of co‐purifying iron in purified proteins in (H) was measured by inductively coupled plasma mass spectrometry (ICP–MS). Data are shown as means ± SD of three biological replicates. P = 0.032 (Welch two sample t‐test).
Source data are available online for this figure.
Multivalent interactions via IDRs are often involved in the formation of membraneless organelles (Banani et al, 2017; Shin & Brangwynne, 2017). Because the DISOPRED3 algorithm predicted that the region following the coiled‐coil (CC) domain (aa 167–334), which contains aa 239–334, is an IDR (Fig 2E) (Jones & Cozzetto, 2015), we investigated whether NCOA4 aa 167–334 (NCOA4 IDR) region is sufficient to form NCOA4 condensates under iron‐replete conditions. Because the formation of membraneless organelles requires protein multimerization, we fused tandem FK506‐binding protein (FKBP) to NCOA4 IDR (2FKBP‐IDR) to allow manipulation of protein multimerization by the FKBP ligand AP20187 (Amara et al, 1997; Clackson et al, 1998). Although 2FKBP‐IDR did not form condensates in stably expressing MEF cells, the addition of the ligand‐induced puncta formation of 2FKBP‐IDR in iron‐replete cells (Fig 2F and G), suggesting that the IDR can form condensates in an iron‐dependent manner although it is likely that multimerization of another domain of NCOA4 is involved in the condensate formation. Although NCOA4 binds iron via its ferritin‐binding domain (aa 383–522) (Mancias et al, 2015), the NCOA4 IDR may also bind iron, because purified NCOA4 IDR fused to GST at its N‐terminus (GST‐NCOA4‐IDR) adopted a pale brown color (Figs 2H and EV2A). To determine whether NCOA4 IDR can indeed bind iron, we performed inductively coupled plasma‐tandem mass spectrometer (ICP–MS) analysis. As shown in Fig 2I, GST‐NCOA4‐IDR contained iron, whereas GST did not, indicating that NCOA4 IDR possesses iron‐binding capacity.
Figure EV2. Multivalent interactions are required for NCOA4 condensation under iron repletion.

- Image of purified GST and GST‐NCOA4 IDR.
- Schematic diagram of NCOA4 variants used in (C–F) and Fig 6.
- NCOA4 KO MEFs reconstituted with NCOA4 variants were treated or not treated with 10 μg/ml FAC for 12 h, fractionated, and analyzed by immunoblotting with the indicated antibodies.
- NCOA4 KO MEFs reconstituted with NCOA4 variants were treated with 10 μg/ml FAC for 12 h and then immunostained with anti‐myc antibody and DAPI. Scale bar, 10 μm.
- Quantitative data of (D) are shown as means ± SEM of at least 90 cells in each condition from two biological replicates.
- NCOA4 puncta were photobleached in MEFs stably expressing NCOA4 ΔIDR‐GFP or ΔIDR + ΔC‐GFP after treatment with 10 μg/ml FAC for 12 h, and then fluorescent recovery was monitored. Representative images are shown. Time 0 indicates the start of recovery after photobleaching. Scale bars, 2 μm. Quantitative data are shown as means ± SD. 11 dots (ΔIDR) or 10 dots (ΔIDR + ΔC) were quantified from two biological replicates.
Source data are available online for this figure.
We further examined the role of the IDR in iron‐induced NCOA4 condensation. Since the C‐terminal region of NCOA4 is also required for efficient condensation as mentioned above, we introduced the NCOA4 mutants listed in Fig EV2B into NCOA4 KO MEFs. The amount of NCOA4 mutant lacking the IDR (NCOA4 ΔIDR) decreased in the insoluble fraction, and further deletion of the C‐terminal region (NCOA4 ΔIDR + ΔC) increased further the amount of NCOA4 in the soluble fraction and resulted in its diffuse cytoplasmic localization under iron repletion (Fig EV2C and E). Consistent with this result, the number of puncta in NCOA4 ΔIDR cells and NCOA4 ΔIDR + ΔC cells decreased after iron treatment (Fig EV2D and E). However, the fluidity of NCOA4 ΔIDR and NCOA4 ΔIDR + ΔC condensates was the same as that of NCOA4 (Fig EV2F). Collectively, these results suggest that the IDR, together with the C‐terminal region, is involved in the formation of NCOA4 condensates by binding to iron under iron repletion, although neither the IDR nor the C‐terminal region of NCOA4 appears to play critical roles in the solid‐like property of NCOA4 condensates.
Iron is critical for the formation of NCOA4 condensates in vitro and in vivo
Because the NCOA4 IDR can bind iron and is involved in iron‐induced NCOA4 condensation, we next investigated whether iron directly induces NCOA4 condensation. Incubation of full‐length NCOA4 purified using the Escherichia coli expression system (Fig EV3A) with Fe (II)SO4 significantly increased the amount of NCOA4 in the insoluble fraction (Fig 3A and B). However, iron‐induced NCOA4 condensation was inhibited when the protein was incubated with FeSO4 under anaerobic conditions (Fig EV3B and C). Because ferrous ion is readily oxidized to ferric ion under the aerobic condition in vitro, we added the iron chelators DTPA, BPS, and Dfo, which chelate both Fe (II) and Fe (III), Fe (II) only, and Fe (III) only, respectively, to the in vitro NCOA4 condensation assay. The addition of any of these iron chelators and FeSO4 to the assay inhibited NCOA4 condensation (Fig EV3D–F), consistent with the idea that Fe (III) is responsible for NCOA4 condensation. To dissect the mechanism of NCOA4 assembly in more detail, we purified N‐terminally FlAsH‐tagged NCOA4 (FlAsH‐NCOA4) using a bacterial expression system. We visualized FlAsH‐NCOA4 condensation by the addition of FlAsH‐EDT2, which emits fluorescence when it binds FlAsH tag (Fig 3C). When FlAsH‐NCOA4 was incubated with FeSO4 under aerobic conditions, NCOA4 formed dot‐like structures at concentrations as low as 10 nM (Figs 3D and EV3G), comparable to the physiological concentration of NCOA4 (about 8 nM based on the PAXdb database). In addition, NCOA4 (10 nM) formed condensates in the presence of FeSO4 concentrations as low as 5 μM, which is also comparable to physiological cellular iron concentrations (Figs 3D and EV3G) (Cabantchik, 2014). More importantly, Fe (III)Cl3, but not FeSO4, induced FlAsH‐NCOA4 condensation under anaerobic conditions (Fig 3E). These results clearly indicated that ferric iron directly induces NCOA4 condensation without any additional factors.
Figure EV3. Iron directly induces NCOA4 condensation.

-
ACoomassie‐stained SDS–PAGE gel of purified human NCOA4.
-
BPurified NCOA4 proteins were incubated with FeSO4 for 1 h under anaerobic conditions and fractionated. Samples were subjected to SDS–PAGE and stained with Coomassie Brilliant Blue.
-
CQuantitative results in (B) are shown as means ± SEM of three biological replicates.
-
D–FPurified NCOA4 proteins were incubated with 50 μM FeSO4 and (D) 500 μM diethylenetriamine pentaacetic acid (DTPA), (E) 100 μM Dfo, or (F) 100 μM bathophenanthroline disulfonic acid (BPS) for 1 h at 37°C under aerobic conditions. Samples were fractionated and subjected to SDS–PAGE; gels were stained with Coomassie Brilliant Blue.
-
GFlAsH‐NCOA4 and FeSO4 were incubated in each concentration for 1 h at 37°C under aerobic conditions and then were observed by confocal fluorescence microscopy. Scale bar, 10 μm.
-
HWild type or TAX1BP1 KO MEFs (clone sg1) in which FTH1 was knocked out by lentiCRISPR were treated or not treated with 10 μg/ml FAC for 12 h. Cell lysates were fractionated and analyzed by immunoblotting with the indicated antibodies.
-
IMEFs in which FTH1 was knocked out by lentiCRISPR were treated with 10 μg/ml FAC for 12 h. The cells were immunostained with anti‐NCOA4. Scale bar, 10 μm.
-
JAdditional electron micrograph of NCOA4 KO MEFs reconstituted with myc‐hNCOA4. Cryosections were labeled with anti‐myc antibodies. Scale bar, 200 nm.
Source data are available online for this figure.
Figure 3. Iron induces NCOA4 condensation.

-
APurified NCOA4 proteins were incubated with FeSO4 for 1 h under aerobic conditions and fractionated. Samples were subjected to SDS–PAGE and stained with Coomassie Brilliant Blue.
-
BQuantitative results in (A) are shown as means ± SEM of three biological replicates.
-
CPurified FlAsH‐NCOA4 (20 nM) and 10 μM FeSO4 were incubated at 37°C under aerobic conditions and observed at the indicated times. Scale bar, 10 μm.
-
DPhase diagram of the formation of FlAsH‐NCOA4 condensates at the indicated protein and FeSO4 concentrations.
-
EPurified FlAsH‐NCOA4 (20 nM) and the indicated metals were incubated at 37°C under anaerobic conditions for 1 h and observed. Scale bar, 10 μm.
-
FElectron micrograph of NCOA4 KO MEFs reconstituted with myc‐hNCOA4. Cryosections were labeled with anti‐myc antibody. Scale bar, 200 nm.
-
GQuantification of the diameter of NCOA4 condensates. The red line shows the mean. The dot plot represents the diameter of 36 condensates from two biological replicates.
-
H, IRepresentative energy‐dispersive X‐ray spectra of (H) cytosol and (I) condensate. Black arrowheads indicate Fe (Kα) peaks.
-
JQuantification of iron count in cytosol and condensates. Data are shown as the means ± SEM of at least 10 cytosols or condensates from two biological replicates. P < 0.0001 (Welch two sample t‐test).
Source data are available online for this figure.
We next determined whether other factors are necessary for iron‐induced NCOA4 condensation in cells. The heavy chain of ferritin binds to NCOA4 and can oxidize Fe (II) to Fe (III) (Mancias et al, 2015; Arosio et al, 2017). Therefore, FTH1 may contribute to NCOA4 assembly under iron repletion. However, endogenous NCOA4 was observed in the insoluble fraction and NCOA4 formed puncta in MEFs lacking FTH1, although the amount of insoluble NCOA4 was slightly lower than in WT MEFs (Fig EV3H and I), indicating that ferritin is not essential for iron‐induced NCOA4 condensation. Our observation that the N334 variant, which lacks the FTH1 interacting domain, formed condensates in an iron‐dependent manner also supports this conjecture (Fig 2B–D).
To verify further that iron triggers the formation of the NCOA4 condensates in cells, we performed transmission electron microscopy and energy‐dispersive X‐ray spectroscopy (TEM‐EDX) analysis. NCOA4 condensates were identified as electron‐dense particles by immunostaining (Figs 3F and EV3J) and the mean diameter of NCOA4 condensates was approximately 120 nm (Fig 3G). The EDX energy spectra demonstrated that the NCOA4 condensates contained more iron than the cytosol (Fig 3H–J). Taken together, these findings indicate that iron triggers NCOA4 condensation in iron‐replete cells by binding to NCOA4 IDR.
Ferritin fate is intricately regulated by iron‐induced condensation of NCOA4
As mentioned above, we next probed the roles of NCOA4 condensation in ferritin degradation in iron‐replete cells. Treatment of cells with FAC for a long period gave us a clue about the mechanism underlying ferritin degradation in iron‐replete conditions (Fig 4A). Upon FAC treatment, the amount of ferritin rapidly increased, rising about 30‐fold after 6 h (Figs 4A and EV4A). However, the increase in ferritin slowed down, and a faster‐migrating band of ferritin emerged after 12 h of iron treatment. As we previously reported (Asano et al, 2011), the faster‐migrating signal of ferritin represented partial degradation products generated in lysosomes (Fig 4B). These results demonstrate that ferritin accumulates rapidly in the early phase of iron treatment but is degraded in lysosomes when iron repletion is prolonged.
Figure 4. NCOA4 condensates fine‐tune ferritin levels via two distinct mechanisms.

- Mouse embryonic fibroblasts were treated with 10 μg/ml FAC for the indicated times and harvested. Cell lysates were fractionated and analyzed by SDS–PAGE with the indicated antibodies. Asterisks indicate a non‐specific band. TfR1, transferrin receptor 1.
- Mouse embryonic fibroblasts were cultured for 12 h in a medium containing 10 μg/ml FAC supplemented with DMSO or 10 μM E64d and 10 μg/ml pepstatin A (pepA). Samples were analyzed by immunoblotting with the indicated antibodies. The black arrowhead indicates an intact ferritin band, and the white arrowhead indicates a partial degradation band of ferritin.
- NCOA4 KO MEFs reconstituted with hNCOA4‐myc were cultured with 10 μg/ml FAC for the indicated times and fixed for imaging. Cells were immunostained with ferritin and myc antibodies. Scale bar, 10 μm.
- Myc (NCOA4) puncta were extracted, and average signal intensities of myc and ferritin in the puncta in (C) were plotted.
- Mouse embryonic fibroblasts expressing hNCOA4‐TurboID were treated with 10 μg/ml FAC for 6 h or 24 h and then cultured with DMSO or 50 μM biotin for 30 min. Cells were lysed with Triton buffer, and lysates were pulled down by streptavidin beads. Inputs and pulldown samples were analyzed with immunoblotting by indicated antibodies.
- Wild type MEFs pretreated with 10 μg/ml FAC for 6 h or 24 h were chased with 20 μg/ml CHX and analyzed by immunoblotting with the indicated antibodies.
- NCOA4 KO MEFs reconstituted with myc‐hNCOA4 were pretreated with 10 μg/ml FAC and then cultured with 20 μg/ml CHX or 200 nM bafilomycin A1 (BafA). Cells were fixed for imaging and immunostained using myc and LAMP1 antibodies. Scale bar, 10 μm.
Source data are available online for this figure.
Figure EV4. NCOA4 condensates fine‐tune ferritin levels to maintain cellular iron homeostasis.

- Quantitative results in Fig 4A are shown as the mean intensities of FTH1, FTL, TfR1, and FBXL5 bands. FTH1, n = 3; FTL, n = 7, and others, n = 5 biological replicates.
- Wild type MEFs or TAX1BP1 KO MEFs were incubated with 10 μg/ml FAC for the indicated times and stained with calcein‐AM. The fluorescence of calcein‐AM was measured by FACS. Data are shown as means ± SEM of three biological replicates.
Because NCOA4 is required for ferritin degradation in iron‐replete conditions (Fig 1B), we investigated the iron‐induced alteration of ferritin localization and its association with condensed NCOA4. Iron administration induced accumulation of NCOA4 in the insoluble fraction, whereas only a trace amount of ferritin was detected in the insoluble fraction 6 h after iron treatment (Fig 4A). Most ferritin did not appear to be degraded, as the faster‐migrating band of ferritin was not detected after iron treatment for 6 h, indicating that condensed NCOA4 was sequestered from ferritin to accumulate in the early phase of iron treatment, allowing the cell to escape iron toxicity. Meanwhile, the amounts of ferritin and NCOA4 in the insoluble fraction gradually increased at later time points after iron administration. In accordance with this observation, immunofluorescence analysis revealed that ferritin was colocalized with NCOA4 puncta in cells treated with FAC for long periods (Fig 4C and D). The amount of partially degraded ferritin in the soluble fraction was also positively correlated with the level of ferritin in the insoluble fraction, suggesting that ferritin is delivered to lysosomes after interacting with NCOA4 condensates in cells subjected to prolonged iron repletion (Fig 4A). To determine more directly whether NCOA4 interacts with ferritin at later time points of FAC treatment, we utilized a proximity biotin labeling method. In these experiments, NCOA4‐TurboID, an engineered biotin ligase fused with NCOA4 at the C‐terminus, was stably expressed in WT MEFs (Branon et al, 2018). More ferritin was pulled down with streptavidin beads in cells treated with iron for 24 h than in cells treated for only 6 h (Fig 4E). CHX treatment in cells pretreated with FAC revealed that the level of ferritin, along with the level of NCOA4 in the insoluble fractions, was rapidly decreased after prolonged FAC pretreatment but not after pretreatment for 6 h (Fig 4F). Degradation of both NCOA4 and ferritin was inhibited by treatment with bafilomycin A1 (BafA1) or lysosomal protease inhibitors (Figs 1F, 4B, F and G). Collectively, these results indicate that NCOA4 condensation regulates ferritin expression via two distinct mechanisms under iron repletion, namely sequestration of NCOA4 condensates from ferritin at early time points after iron administration, and degradation of NCOA4 condensates along with ferritin at late points.
TAX1BP1 and FIP200 are essential for clearance of insoluble NCOA4 condensates and ferritin
We next investigated how NCOA4 condensates and ferritin are delivered to lysosomes. Given our previous observation that ferritin is degraded in lysosomes via ATG7‐independent autophagy in iron‐replete cells, we first examined whether loss of ATG7 affects delivery of NCOA4 condensates and ferritin to lysosomes in iron‐replete cells. Deletion of ATG7 did not overtly affect the decrease in the levels of ferritin and NCOA4 in the insoluble fraction of iron‐treated cells, although the loss of ATG7 slightly increased the amount of NCOA4 in the insoluble fraction (Figs 5A, and EV5A and B), confirming that ATG7 is dispensable for ferritin degradation in iron‐replete cells. Because our CRISPR screen also identified TAX1BP1 and FIP200 (RB1CC1) as candidate genes involved in ferritin degradation under iron repletion (Fig 1A), we examined the turnover of ferritin and NCOA4 in MEFs lacking TAX1BP1 or FIP200. In KO MEFs for both genes, insoluble NCOA4 accumulated to high levels in the absence of FAC treatment and accumulated further following FAC administration (Fig 5A). Moreover, ferritin accumulated to high levels in the insoluble fraction in both KO MEFs (Figs 5A and EV5A). NCOA4 interacts with FTH1, but not FTL, to deliver ferritin cages to lysosomes (Mancias et al, 2015). We next generated TAX1BP1 KO MEFs deficient for FTH1 using the lentiviral CRISPR/Cas9 system. NCOA4 accumulated in the insoluble fraction even in FTH1‐deficient TAX1BP1 KO MEFs (Fig EV3H), implying that TAX1BP1 is involved in the turnover of NCOA4 condensates regardless of its interaction with ferritin. These results suggested that both TAX1BP1 and FIP200 are required for lysosome delivery of insoluble NCOA4 condensates under iron‐replete conditions, regardless of interaction with ferritin.
Figure 5. TAX1BP1 is essential for the clearance of NCOA4 condensates and ferritin via recruitment of FIP200.

-
AWild type, ATG7 KO, TAX1BP1 KO, and FIP200KO MEFs were treated or not treated with 10 μg/ml FAC for 12 h. Cell lysates were fractionated and analyzed by immunoblotting with the indicated antibodies.
-
BSchematic diagram of TAX1BP1 variants used in this study. NB, NCOA4 binding.
-
CHEK293T cells were transfected with GFP‐NCOA4 and the indicated FLAG‐His‐TAX1BP1 variants. Soluble lysates extracted from transfected cells were immunoprecipitated with anti‐FLAG antibodies. Inputs and immunoprecipitated samples were analyzed by immunoblotting with the indicated antibodies.
-
D–FWild type MEFs and TAX1BP1 KO MEFs reconstituted with the indicated TAX1BP1 variants were untreated or treated with 10 μg/ml FAC for 12 h. (D, F) Cell lysates were fractionated and analyzed by immunoblotting with the indicated antibodies. (E) Cells were fixed for imaging and immunostained to analyze ferritin localization. Scale bar, 10 μm.
Source data are available online for this figure.
Figure EV5. TAX1BP1 is essential for clearance of insoluble NCOA4 condensates and ferritin under iron repletion.

-
AWild type, ATG7 KO, TAX1BP1 KO, and FIP200KO MEFs were pretreated with 10 μg/ml FAC for 12 h and cultured with or without 20 μg/ml CHX for 1 h. Cell lysates were fractionated and analyzed by immunoblotting with the indicated antibodies.
-
BWild type and ATG7 KO MEFs pretreated with 25 μg/ml FAC for 15 h were cultured with or without 20 μg/ml CHX at the indicated times. Soluble lysates were analyzed by immunoblotting with the indicated antibodies.
-
C, DHEK293T cells were transfected with GFP‐NCOA4 and the indicated FLAG‐His‐TAX1BP1 variants. Soluble lysates extracted from transfected cells were immunoprecipitated with anti‐FLAG antibodies. Inputs and immunoprecipitated samples were analyzed by immunoblotting with the indicated antibodies.
Source data are available online for this figure.
TAX1BP1 recruits FIP200 in the vicinity of NCOA4 condensates to promote their clearance
Because TAX1BP1, but not FIP200, accumulates in insoluble fractions and was degraded along with NCOA4 and ferritin in lysosomes (Figs 4F and 5A), we focused on the role of TAX1BP1 in ferritinophagy mediated by NCOA4 condensates. Although TAX1BP1 binds NCOA4 (Goodwin et al, 2017), the domain involved in this interaction has not been identified. Co‐immunoprecipitation analyses of TAX1BP1 mutants with NCOA4 revealed that TAX1BP1 aa 446–484 (hereafter referred to as NB region: NCOA4 binding region) was required for binding to NCOA4 (Figs 5B and C, and EV5C and D). Interestingly, the NB region of TAX1BP1 overlapped with the region necessary for the clearance of condensates of NBR1, an autophagy receptor (Ohnstad et al, 2020). Introduction of the TAX1BP1 mutant lacking the NB region (TAX1BP1ΔNB) into TAX1BP1 KO MEFs failed to ameliorate accumulation of NCOA4 and ferritin in the insoluble fraction, as well as ferritin condensates (Fig 5D and E), suggesting that the interaction between NCOA4 and TAX1BP1 is critical for the delivery of NCOA4 condensates and ferritin to lysosomes in iron‐replete cells.
TAX1BP1‐mediated recruitment of FIP200 to the vicinity of NBR1 condensates is essential for clearance of NBR1 condensates generated in ATG7 KO cells, and Ala 114 of TAX1BP1 is critical for the recruitment of FIP200 (Ohnstad et al, 2020). To examine the involvement of TAX1BP1‐mediated recruitment of FIP200 in the clearance of NCOA4 condensates and ferritin under iron‐replete conditions, we reconstituted the TAX1BP1 A114Q mutant into TAX1BP1 KO MEFs. The mutant failed to counteract the accumulation of NCOA4 and ferritin in iron‐treated TAX1BP1 KO MEFs, as was the case for TAX1BP1ΔNB (Fig 5F). These results demonstrate that TAX1BP1 plays a crucial role in the clearance of NCOA4 condensates, with or without ferritin, by serving as a platform to recruit FIP200 via its interaction with NCOA4.
The properties of NCOA4 affect TAX1BP1 dependence of ferritinophagy and the interaction with ferritin
In the experiments described above, we showed that NCOA4 condensates‐dependent ferritinophagy observed in cells with prolonged iron treatment is ATG7‐independent but TAX1BP1‐dependent (Figs 4 and 5). We then examined whether TAX1BP1 is also required for ATG7‐dependent ferritinophagy under iron depletion. Because NCOA4 is localized in the soluble cytoplasmic fraction under iron‐depleted conditions (Figs 1E and 6A), we analyzed the distributions of TAX1BP1, ferritin, and NCOA4 in the detergent‐soluble fraction using glycerol density gradient ultracentrifugation. Most soluble TAX1BP1 was detected in a fraction around 600 kDa (fractions #1 to #3), whereas NCOA4 and ferritin were present in fractions #6 to #13 (Fig 6B), suggesting that TAX1BP1 is dispensable for ATG7‐dependent ferritinophagy, in which ferritin is delivered to lysosomes from detergent‐soluble fractions in iron‐depleted cells. To determine whether TAX1BP1 is dispensable for the delivery of ferritin from the soluble fraction to lysosomes in iron‐depleted cells, we used TAX1BP1 KO MEFs. The amount of ferritin in detergent‐soluble fractions was clearly decreased by treatment with Dfo in two TAX1BP1‐null MEFs, although NCOA4 and ferritin which were already accumulated in the insoluble fraction were not decreased by Dfo treatment (Fig 6C and D). Substantial amounts of NCOA4 and ferritin were detected in insoluble fractions of TAX1BP1 KO MEFs even without the addition of iron (Fig 5A). To decrease the difference in NCOA4 and ferritin expression levels in the insoluble fraction between WT and TAX1BP1‐null cells, we established the MEFs in which TAX1BP1 can be conditionally knocked down via auxin‐inducible degron 2 (Yesbolatova et al, 2020). TAX1BP1 fused with mAID, a 7 kD degron sequence, at the N‐terminus (mAID‐TAX1BP1) is rapidly degraded upon addition of the auxin analog, 5‐Ph‐IAA (Appendix Fig S1A). Accumulation of NCOA4 was substantially attenuated by the introduction of mAID‐TAX1BP1 (Appendix Fig S1B). The level of soluble ferritin was reduced in iron‐depleted cells regardless of mAID‐TAX1BP1 expression, whereas the level of insoluble ferritin was unchanged (Fig 6E). Furthermore, degradation of soluble ferritin in iron‐depleted TAX1BP1 KO cells was ATG7‐dependent (Fig 6F), and augmented NCOA4 expression accelerated soluble ferritin degradation even in TAX1BP1 KO MEFs (Fig 6G). Taken together, these findings indicate that TAX1BP1 is dispensable for ATG7‐dependent soluble ferritin degradation, but it is essential for recognizing the insoluble NCOA4 condensates for ferritin degradation.
Figure 6. The properties of NCOA4 affect the TAX1BP1 dependence of ferritin degradation and interaction with ferritin.

-
AMouse embryonic fibroblasts were pretreated with 10 μg/ml FAC for 12 h and then cultured with 100 μM Dfo for the indicated time. Cells were lysed with SDS‐containing sample buffer or Triton buffer. Lysates were analyzed by immunoblotting with the indicated antibodies.
-
BMouse embryonic fibroblasts were treated with 20 μM Dfo for 12 h, 10 μg/ml FAC for 12 h, or 100 μM Dfo for 6 h after treatment with 10 μg/ml FAC for 12 h. Triton‐soluble lysates were subjected to glycerol gradient ultracentrifugation analysis.
-
CWild type and TAX1BP1 KO MEFs were pretreated with 25 μg/ml FAC for 16 h and then cultured with 100 μM Dfo. Lysates were fractionated and then analyzed by immunoblotting with the indicated antibodies.
-
DSoluble FTL bands in (C) were quantified by densitometry. Data are shown as the means ± SD of three biological replicates.
-
ETAX1BP1 KO MEFs (sg1 clone) stably expressing FLAG‐OsTIR1 (F74G) and FLAG‐mAID‐mTAX1BP1 were pretreated with 10 μg/ml FAC for 12 h, cultured with DMSO or 1 μM 5‐Ph‐IAA for 2 h, and then treated with 100 μM Dfo. Soluble lysates were analyzed by immunoblotting with the indicated antibodies. 5‐Ph‐IAA, a derivative of Auxin; mAID, mini auxin‐inducible degron.
-
FTAX1BP1 KO MEFs (clone sg1) in which ATG7 was knocked down were pretreated with 10 μg/ml FAC for 12 h and then cultured with 100 μM Dfo. Soluble lysates were analyzed by immunoblotting with the indicated antibodies.
-
GTAX1BP1 KO MEFs (clone sg1) stably expressing myc‐hNCOA4 pretreated with 25 μg/ml FAC for 16 h were cultured with 100 μM Dfo, and soluble lysates were analyzed by immunoblotting with the indicated antibodies.
-
H, INCOA4 KO MEFs reconstituted with NCOA4 variants were pretreated with 10 μg/ml FAC for 12 h and then chased with (H) 20 μg/ml CHX or (I) 100 μM Dfo for the indicated times. Soluble lysates were analyzed by immunoblotting with the indicated antibodies.
-
JMouse embryonic fibroblasts expressing hNCOA4‐TurboID were treated with 10 μg/ml FAC for 3 h (indicated as F) or 100 μM DFO for 3 h after treatment with 10 μg/ml FAC for 12 h (indicated as D), and then cultured with DMSO or 50 μM biotin for 30 min. Triton‐soluble cell lysates were pulled down by streptavidin beads. Inputs and pulldown samples were analyzed by immunoblotting with the indicated antibodies. The black and white arrowheads indicate hNCOA4‐TurboID and endogenous NCOA4, respectively.
Source data are available online for this figure.
We next characterized the role of the IDR and C‐terminal region in ferritin degradation. The amount of partial degradation products of ferritin was lower in NCOA4 ΔIDR cells under iron repletion (Fig EV2B). In accordance with this result, a CHX chase showed that ferritin degradation was slower in NCOA4 null MEFs expressing NCOA4 ΔIDR under iron repletion (Fig 6H). By contrast, soluble ferritin degradation occurred normally even in cells expressing NCOA4 ΔIDR (Fig 6I). These results are consistent with the concept that ferritin degradation under iron repletion is dependent on insoluble NCOA4 condensates and degradation under iron depletion is dependent on soluble NCOA4.
We found that cellular iron status altered the biochemical characteristics of NCOA4, and that ferritin degradation pathways were altered by cellular iron concentration, implying that NCOA4 status is the determinant for the selection of ferritin degradation pathways. NCOA4 condensates effectively delivered ferritin to lysosomes for degradation in cells treated with iron for prolonged periods, whereas ferritin degradation was inhibited in the early phase of iron treatment (Fig 4A). Also, iron chelation induced ferritin degradation effectively, although the amounts of ferritin and NCOA4 were virtually the same under the two conditions (Fig 6A). To determine whether iron‐induced alteration of the biochemical characteristics of NCOA4 also affects the interaction between NCOA4 and ferritin, we utilized the proximity biotin labeling method. As expected, the interaction of NCOA4 with ferritin was substantially lower in cells treated with iron than in those treated with an iron chelator (Fig 6J). Therefore, iron modulates the biochemical characteristics of NCOA4 and thus regulates its binding to ferritin.
In conclusion, iron‐induced alteration of the biochemical characteristics of NCOA4 regulates ferritin fate by modulating two functions of NCOA4 (Fig 7): interaction with ferritin and pathways for ferritinophagy. Under iron depletion, NCOA4 is soluble and effectively delivers ferritin via ATG7‐dependent, TAX1BP1‐independent macroautophagy. Meanwhile, NCOA4 plays two roles in iron‐replete cells. In the early phase of iron treatment, iron induces the formation of NCOA4 condensates and attenuates the interaction between NCOA4 with ferritin, allowing accumulated ferritin to store excess iron. By contrast, under prolonged iron treatment, NCOA4 condensates interact with ferritin to deliver NCOA4 to lysosomes via TAX1BP1‐dependent, but ATG7‐independent, autophagy.
Figure 7. Schematic summary of the proposed model.

Model of the regulation of ferritin fate by NCOA4 in cellular iron homeostasis. Under iron depletion, ferritin is degraded by the NCOA4 dependent macroautophagy pathway. In the early phase of iron treatment, NCOA4 forms condensates that sequester ferritin for ferritin accumulation. During prolonged iron treatment, NCOA4 condensates bind ferritin, forming a complex that is trafficked to the lysosome in a TAX1BP1‐dependent manner to avoid iron deficiency.
Discussion
Ferritin protects cells from iron toxicity by storing excess iron under iron‐replete conditions. Under iron depletion, it supplies iron to cells by delivering ferritin to lysosomes via macroautophagy to liberate stored iron. NCOA4 is a ferritin‐specific autophagy adaptor and a key player in ferritin turnover under iron depletion. However, we previously showed that ferritin is also delivered to lysosomes by non‐classical autophagic pathways in iron‐replete cells. In this study, we revealed that NCOA4 intricately regulated ferritin fate under iron‐replete conditions by forming condensates in an iron‐dependent manner: NCOA4 was sequestered from ferritin in the early phase of iron treatment and delivered to lysosomes along with insoluble NCOA4 condensates under prolonged iron repletion (Fig 7). Generation of biomolecular condensates is a mechanism that enables cells to tolerate surrounding stresses, for example, heat and osmotic stress (Riback et al, 2017; Saad et al, 2017; Kilic et al, 2019; Iserman et al, 2020; Jalihal et al, 2020). Because iron is supplied from the environment, and iron‐binding to NCOA4 IDR is involved in NCOA4 assembly, iron‐induced condensation of NCOA4 is likely to be a component of the iron‐sensing mechanisms that manage requirements for and toxicity of iron.
Our results indicated that the physicochemical properties of NCOA4 determine the autophagy pathways of ferritin. Membraneless organelles have a wide range of properties, which are related to their diverse functions (Kaganovich, 2017). We observed that NCOA4 formed solid‐like condensates, and that these NCOA4 condensates were delivered to lysosomes through recognition by TAX1BP1. TAX1BP1 mediates clearance of cytotoxic protein aggregates (Sarraf et al, 2020) and also serves as a mitophagy and xenophagy receptor (Lazarou et al, 2015; Tumbarello et al, 2015). More importantly, TAX1BP1 is required for clearance of NBR1 condensates in ATG7‐deleted cells, and TAX1BP1 recruits FIP200 to NBR1 condensates for delivery of the condensate to the lysosome in an ATG7‐independent manner (Ohnstad et al, 2020). We found that TAX1BP1‐dependent FIP200 recruitment is also necessary for clearance of NCOA4 condensates, which are formed in cells with an intact ATG8 family conjugation system. Therefore, TAX1BP1 can be considered as a receptor for aggrephagy, in which aggregates are delivered to lysosomes in an ATG7‐independent fashion. Ferritin can be delivered to lysosomes under iron‐depleted conditions via a TAX1BP1‐dependent, but ATG7‐independent manner (Goodwin et al, 2017). However, we found that soluble ferritin and NCOA4 in iron‐depleted cells are degraded by ATG7‐dependent classical macroautophagy (Fig 6). Moreover, we clearly showed iron‐induced condensation of NCOA4 (Fig 3). Because Goodwin et al treated cells with iron chelator for 18 h, it is unlikely that iron could induce NCOA4 condensation under their experimental conditions. Although the further study will be needed, NCOA4 can form condensates via an iron‐independent mechanism, and these condensates are delivered to lysosomes even under iron‐depleted conditions via the same mechanism that we described here.
To avoid iron toxicity, ferritin expression must be elevated upon iron repletion, and we have observed that the amount of ferritin increased dramatically upon iron administration (Fig 4A). Because NCOA4 is known to be ubiquitinated and degraded by the proteasome under iron‐replete conditions (Mancias et al, 2015), it was surprising to find that NCOA4 is also essential for ferritin delivery to lysosomes in iron‐replete cells via a process mediated by the iron‐induced formation of NCOA4 condensates. The discrepancy between the previous report and our findings can be explained by the notion that cells are equipped with two mechanisms, NCOA4 condensation and NCOA4 degradation, to sequester NCOA4 from ferritin to increase the ferritin level under iron repletion. Consistent with this, our preliminary analysis demonstrated that the amount of NCOA4 in iron‐replete cells was reduced under hypoxic conditions. Oxidation of ferrous ion to ferric ion, the latter of which induces NCOA4 condensation, could be inhibited in hypoxia. Although further analyses are required, our findings suggest that NCOA4 is degraded by the proteasome to increase ferritin when NCOA4 condensation is inhibited.
Our previous observation of lysosomal delivery of ferritin under iron‐replete conditions appears to contradict the common notion that ferritin protects cells from iron toxicity by storing excess iron. We confirmed that ferritin was indeed delivered to lysosomes in iron‐replete cells. However, ferritin degradation was barely detectable in the early phase of iron treatment; consequently, the cell can accumulate ferritin and avoid iron toxicity. By contrast, under prolonged iron treatment, ferritin was effectively degraded together with NCOA4 condensates. We suspect that this degradation is involved in the maintenance of intracellular iron homeostasis. The amount of available iron in cells is chiefly maintained via modulation of cellular iron storage in ferritin, and its uptake is mediated by transferrin receptor1 (TfR1) (Rouault, 2006; Iwai, 2019). The abundance of FBXL5 is the major determinant of cellular iron homeostasis, as FBXL5 modulates the production of ferritin and TfR1 by regulating the amount of IRP2 (Salahudeen et al, 2009; Vashisht et al, 2009). The amount of FBXL5 is elevated under iron‐replete conditions. However, our results showed that the amount of FBXL5, whose expression reflects the amount of intracellular iron, decreased after 12 h of iron treatment but not after 6 h. Chelatable intracellular iron, which reflects the labile cytoplasmic iron pool, reached a plateau after 12 h of iron treatment (Fig EV4B). The increase in FBXL5 suppressed the production of TfR1 by destabilizing its mRNA. However, the reduction in the level of TfR1 was delayed because this protein has a long half‐life. TfR1 levels decreased gradually when cells were treated for long periods, for example, 12 h (Fig EV4A). Collectively, the amount of available iron was relatively low in cells that underwent prolonged iron treatment, probably due to augmented iron storage by ferritin and attenuation of TfR1‐mediated iron uptake. To overcome this relative iron deficiency, cells could use iron stored in ferritin by delivering ferritin to lysosomes.
We found that iron‐binding to NCOA4 weakened its interaction with ferritin (Fig 6), ensuring sequestration of NCOA4 from ferritin in the early phase of iron administration. However, in cells treated with iron for prolonged periods, overaccumulation of ferritin allowed NCOA4 condensates to degrade ferritin via ATG7‐independent autophagy, thus enabling iron utilization. Upon iron depletion, NCOA4, which does not interact with iron, can effectively bind to ferritin to destine it for ATG7‐dependent canonical autophagy, thus avoiding iron deficiency. Therefore, iron modulates two functions of NCOA4: interaction with ferritin and the ferritin autophagy pathway. Thus, NCOA4 is an iron sensor to regulate ferritin fate, and the NCOA4‐ferritin axis modulates intracellular iron homeostasis in accordance with cellular iron availability.
Materials and Methods
Plasmids
Open reading frames (ORFs) of human NCOA4 (hNCOA4), human TAX1BP1 (hTAX1BP1), and human p62 were cloned by RT‐PCR from mRNA isolated from HEK293. The ORF of mouse NCOA4 (mNCOA4) was cloned by RT‐PCR from mRNA isolated from mouse embryonic fibroblasts (MEFs). The following fragments were generated from the amplified ORF of human NCOA4: NCOA4 (aa 1–522), NCOA4 (aa 1–441), NCOA4 (aa 1–334), NCOA4 (aa 1–238), NCOA4 ΔIDR (deleted aa 167–334), and NCOA4 ΔIDR + ΔC (deleted aa 167–334 and 523–614). The following variants were generated from the amplified ORF of human TAX1BP1: TAX1BP1 (aa 1–726), TAX1BP1 (aa 1–600), TAX1BP1 (aa 1–526), TAX1BP1 (aa 1–485), TAX1BP1 (aa 1–445), and TAX1BP1 (ΔNB:Δ446–484). The FKBP sequence was amplified by PCR from pMRX‐IP GFP‐2×FKBP‐p62, which was a gift from Dr. Noboru Mizushima. OsTIR1 F74G and the mAID degron sequence were amplified by PCR from pMK381 and pAY15, which were gifts from Dr. Masato Kanemaki. cDNAs were ligated into the appropriate epitope‐tag sequences, and then cloned into pcDNA3.2, pMXs IRES puro, pMXs puro, pMXs IRES‐bsr, and pGEX6p‐1. Single guide RNA (sgRNA) targeting Ncoa4 (5′‐ACCCACAGGACTGGCTTATC‐3′) was cloned into pSpCas9(BB)‐2A‐Puro (PX459, Addgene). sgRNAs targeting Tax1bp1 (5′‐TATACGGAGTTAAGGTGTAA‐3′, 5′‐TGAAGGCAATTCCGATATGT‐3′) were cloned into pSpCas9(BB)‐2A‐GFP (PX458, Addgene). sgRNAs targeting Fth1 (5′‐GTAGTTCTGGCGCACTTGCG‐3′) were cloned into lentiCRISPRv2 puro (Addgene).
Antibodies and reagents
The following antibodies were used in this study: anti‐ferritin (Sigma F6136; western blotting [WB] 1:2,000, immunofluorescence [IF] 1:1,000); anti‐FTH1 (Santa Cruz sc‐376594; WB 1:300); anti‐FTH1 (Cell signaling #3998S; WB 1:2,000); anti‐NCOA4 (Santa Cruz sc‐373739; WB 1:300); anti‐NCOA4 (Invitrogen PA5‐96398; IF 1:500); anti‐TAX1BP1 (Abcam ab176572; WB 1:5,000); anti‐TfR1 (Invitrogen 13‐6890; WB 1:1,000); anti‐FBXL5 (Santa Cruz sc‐390102; WB 1:1,000); anti‐IRP2 (our laboratory; WB 1:1,000); anti‐ATG7 (Cell Signaling #8558; WB 1:2,000); anti‐FIP200 (Cell Signaling #12436; WB 1:2,000); anti‐SQSTM1/p62 (Wako 018‐22141; WB 1:2,000); anti‐calreticulin (ThermoFisher PA3‐900; IF 1:1,000); anti‐EEA1 (Santa Cruz sc‐365652; IF 1:100); anti‐GM130 (BD Transduction Laboratories 610822; IF 1:400); anti‐LBPA (Echelon Biosciences Z‐PLBPA; IF 1:100); anti‐LAMP1 (Santa Cruz sc‐19992; IF 1:100); anti‐β‐Actin (Sigma A5316; WB 1:15,000); anti‐Tubulin (CEDARLANE CLT9002; WB 1:5,000); anti‐FLAG (Sigma–Aldrich F3165; immunoprecipitation); anti‐FLAG (Sigma–Aldrich F7425; WB 1:3,000); anti‐DYKDDDDK (Wako 014‐22383; WB 1:500); anti‐DDDDK (MBL PM020; WB 1:3,000); anti‐GFP (clontech 632381; WB 1:1,000); anti‐Myc (Millipore 05‐724; WB 1:2,000, IF 1:500); anti‐GAPDH (Santa Cruz sc‐365062; WB 1:2,000); anti‐H2B (Millipore 07‐371; WB 1:3,000); anti‐HSP90 (ENZO Life Science; WB 1:1,000); HRP‐linked anti‐mouse IgG (Cell Signaling #7076; WB 1:10,000); HRP‐linked anti‐rabbit IgG (GE Healthcare NA934; WB 1:10,000); goat anti‐mouse IgG–Alexa Fluor 488 (ThermoFisher A‐11029; IF 1:1,000); goat anti‐rabbit IgG–Alexa Fluor 647 (ThermoFisher A‐21244; IF 1:1,000); and goat anti‐rat IgG–Alexa Fluor647 (ThermoFisher A‐21247; 1:1,000). Predesigned siRNAs targeting mouse Atg7 and control siRNA were purchased from Sigma–Aldrich.
The following reagents were used in this study: ferric ammonium citrate (Sigma–Aldrich, F5879); bathophenanthroline disulfonic acid (Sigma–Aldrich, 146617); DTPA (Sigma–Aldrich, d6518); deferoxamine mesilate (desferal; Novartis, V03AC01); cycloheximide (Calbiochem, 239764); Bafilomycin A1 (Selleck, S1413); E64d (Peptide Institute, 4321‐v); pepstatin A (Peptide Institute, 4397‐v); B/B homodimerizer ligand (AP20187; Clontech, 635058); biotin (Fujifilm Wako Pure Chemical Corporation, 021‐08712); FeSO4/7H2O (Fujifilm Wako Pure Chemical Corporation, 094‐01082); FeCl3/6H2O (Nacalai Tesque, 19433‐02); 5‐Ph‐IAA (BioAcademia, 30‐003).
Cell lines
Mouse embryonic fibroblasts were generated in our laboratory. Hepa1–6 was purchased from ATCC. HepG2 was gifted by Dr. Koichi Nakajima. U2OS and HEK293T were gifted by Dr. Eijiro Nakamura. Plat‐E was gifted by Dr. Toshio Kitamura. All cell lines were cultured in Dulbecco's Modified Eagle Medium (DMEM; Sigma) supplemented with 10% fetal bovine serum (FBS; Sigma), 100 IU/ml penicillin, and 100 µg/ml streptomycin at 37°C under 7.5% CO2 in humidified air.
Generation of CRISPR/Cas9‐mediated KO cell lines
For the generation of NCOA4 KO MEFs, PX459 plasmid encoding sgRNA targeting Ncoa4 was transfected into MEFs using Lipofectamine 2000. After 24 h, transfectants were selected with puromycin. One hundred cells were seeded in a 10 cm dish, and single clones were obtained using cloning rings.
For the generation of TAX1BP1 KO MEFs, PX458 plasmids encoding sgRNAs targeting Tax1bp1 were transfected into MEFs by electroporation. After 24 h, GFP‐expressing cells were isolated using a FACSAria III cell sorter (BD Biosciences), and single clones were obtained using cloning rings.
For the generation of FTH1KO MEFs, HEK293T cells were co‐transfected with lentiCRISPRv2 puro encoding sgRNAs targeting Fth1, psPAX2, and pMD2.G using PEIMAX (Polysciences). The culture medium was collected 48 h after transfection and passed through a 0.45 μm filter. MEFs were transduced with lentivirus in the presence of Polybrene (10 μg/ml) for 16 h. The infected cells were selected with puromycin, and bulk cells were used for the experiments.
Retroviral infections and generation of stable cell lines
Appropriate pMXs plasmids were transfected into Plat‐E packaging cells using Lipofectamine 2000. After 48 h, retrovirus in the culture medium was collected and passed through a 0.45 μm filter. MEFs were infected with retrovirus in the presence of polybrene (10 μg/ml) for 16 h. The infected cells were selected using puromycin or blasticidin.
Genome‐wide CRISPR/Cas9 screen
Mouse embryonic fibroblast cells expressing RFP‐P2A‐GFP‐FerritinL were infected with the mouse GeCKO v2 library at an MOI of 0.3 and selected with puromycin for 1 week following infection. The cells were treated with 50 μg/ml FAC for 24 h before enrichment of cells with low RFP:GFP ratio on a FACSAria III cell sorter. The enrichment was performed twice. Next, 5 × 10⁷ cells were lysed in NTE buffer (15 mM Tris–HCl pH 7.5/150 mM NaCl/1 mM EDTA), and genomic DNA from each group of cells was prepared using phenol–chloroform extraction and ethanol precipitation methods. From 640 µg genomic DNA, sgRNA sequences were amplified by PCR using Herculase II Fusion DNA polymerase. The amplicons were gel extracted and subjected to DNA sequencing on a Novaseq 6000 (Illumina) sequencer. Sequence data were analyzed by MAGeCK pipeline.
Cell lysis and fractionation
For the preparation of total cell lysates, cells were lysed in 1× sample buffer (50 mM Tris–HCl pH 6.8, 2% SDS, 10% glycerol, 0.1% bromophenol blue, and 100 mM DTT). The cell lysate was sonicated to shear DNA and boiled at 95°C for 10 min.
For the preparation of Triton X‐100 soluble and insoluble samples, cells were lysed in Triton buffer (1% Triton X‐100, 50 mM Tris–HCl pH 8.0, and 150 mM NaCl) supplemented with 2 mM PMSF and protease inhibitor cocktail (Roche). After incubation on ice for 20 min, the soluble extract was collected after centrifugation at 20,000 g for 20 min at 4°C. After the addition of 4× sample buffer to the supernatant, the sample was boiled at 95°C for 5 min. The insoluble pellet was washed once with Triton buffer and resuspended in 1× sample buffer. The insoluble sample was sonicated and boiled at 95°C for 10 min.
For the preparation of hypotonic lysate, cells were lysed by passing through a 27G needle 30 times in hypotonic buffer (20 mM HEPES–NaOH pH 7.4, 10 mM KCl, 2 mM MgCl2, and 1 mM EDTA) supplemented with a protease inhibitor cocktail (Roche). After incubation on ice for 20 min, the homogenate was centrifuged at 1,000 g for 10 min, and the supernatant was collected (S1). The pellet (P1) was washed with hypotonic buffer and resuspended in 1× sample buffer. S1 supernatant was centrifuged at 20,000 g for 10 min, and the pellet (P20) was washed with hypotonic buffer and resuspended in 1× sample buffer. The supernatant was collected as S20 for analysis.
Immunoblotting
Samples were resolved by SDS–polyacrylamide gel electrophoresis (PAGE) and transferred to polyvinylidene difluoride membrane. After blocking in Tris‐buffered saline containing 0.1% Tween‐20 and 5% (w/v) nonfat dry milk, membranes were incubated with appropriate primary antibodies, followed by the corresponding secondary antibodies. Membranes were visualized by enhanced chemiluminescence, and signals were detected on a LAS4000mini instrument (GE Healthcare).
Immunocytochemistry
Cells were fixed with 2% formaldehyde in phosphate‐buffered saline (PBS) for 20 min at room temperature. The fixed cells were washed three times in PBS and permeabilized for 10 min with 0.1% Triton X‐100 in PBS. After washing three times with PBS, the cells were incubated with blocking buffer (10% fetal bovine serum, 0.05% sodium azide in PBS) for 1 h at room temperature. The samples were incubated with primary antibodies in blocking buffer for 1 h at room temperature or overnight at 4°C, washed three times in PBS, and incubated with secondary antibodies in blocking buffer for 1 h at room temperature. The samples were washed again in PBS and then mounted with SlowFade Diamond Antifade Mountant with DAPI (Thermo Fisher).
For staining endogenous NCOA4, the cells were permeabilized for 3 min, blocked with 2% BSA in PBS, and incubated with the primary antibody for 2 h at room temperature. Other procedures were the same as those mentioned above.
Confocal fluorescence images were acquired with an IX81 inverted microscope (Olympus) equipped with an FV1000 confocal imaging system (Olympus) and a 60×/1.42 NA oil objective lens (PlanApo N 60X, Olympus). Images were analyzed with ImageJ and R.
Cellular FRAP assays
Cellular FRAP experiment was performed on an FV1000 confocal imaging system at 37°C in a live‐cell imaging chamber. Before assays, NCOA4 KO MEFs expressing mNCOA4‐GFP were incubated with FluoroBrite DMEM (ThermoFisher) containing 10% FBS, 2 mM l‐glutamine (Fujifilm Wako Pure Chemical Corporation), and 10 µg/ml ferric ammonium citrate for 6–12 h. NCOA4 puncta were photobleached by 100% laser power using a 405 nm laser. Time‐lapse images were acquired at 20 s intervals for 20 min after bleaching. Images were processed using ImageJ and Metamorph.
Time‐lapse imaging for observing fusion and fission of NCOA4
Cells were imaged with an IX83 inverted microscope (Olympus). NCOA4 KO MEFs expressing NCOA4‐GFP were incubated with FluoroBrite DMEM (ThermoFisher) containing 10% FBS, 2 mM l‐glutamine (Fujifilm Wako Pure Chemical Corporation), and 10 µg/ml ferric ammonium citrate for 6 h. Time‐lapse images were acquired at 10 or 20 s intervals for 20–60 min. Images were processed using ImageJ and Metamorph.
Protein expression and purification
Proteins were expressed and purified from E. coli strain BL21‐CodonPlus (DE3)‐RIPL harboring a GST‐tagged NCOA4 protein. The bacteria were grown in LB media with appropriate antibiotic selection to OD600 of 0.6 at 30°C before induction with 50 μM IPTG at 16°C for 18 h. Bacteria were collected by centrifugation and lysed by sonication in GST lysis buffer (20 mM Tris–HCl pH 7.5, 150 mM NaCl, 1 mM EDTA) supplemented with 2 mM PMSF, 1 mM DTT, and protease inhibitor cocktail tablet. The sample was centrifuged at 23,000 g for 20 min at 4°C, and the supernatant was loaded onto an AKTA GSTrap HP column (GE Healthcare). GST protein was eluted with glutathione buffer (20 mM Tris–HCl pH 8.0, 200 mM NaCl, 20 mM glutathione). The eluted sample was desalted on a PD‐10 column in GST lysis buffer, and the GST tag was cleaved by PreScission Protease at 4°C overnight. The cleaved protein was subjected to size‐exclusion chromatography using a Superdex 200 column (GE Healthcare) in HEPES‐buffered saline (HBS) buffer (20 mM HEPES‐NaOH pH 7.4, 150 mM NaCl), and the fractions were collected. GST‐NCOA4 IDR was purified as described above except that removal of the GST tag was not performed.
ICP–MS
A 0.3 ml aliquot of purified GST‐tagged NCOA4 IDR solution was placed in a Teflon vessel, and 1 ml of 60% nitric acid (Fujifilm Wako Pure Chemical Corporation) was added. The solution was heated in a microwave (350 W, 2 min) to decompose organic components. After acid digestion, sample solutions were evaporated to dryness using a hot plate and re‐dissolved in 1% nitric acid for elemental analysis on an ICP–MS/MS (Agilent8800 ICP‐QQQ). The iron signal intensity was monitored at m/z 56 with an integration time of 0.1 s. The iron concentrations in GST solution and HBS buffer were measured to evaluate the specific binding of iron to NCOA4 and the blank level of iron, respectively.
In vitro sedimentation assays
All reactions were performed in an HBS buffer. Eighteen microliters of 300 nM NCOA4 protein were mixed with 2 μl of 10× FeSO4 in an anaerobic chamber. The mixture was incubated at 37°C under aerobic or anaerobic conditions for the indicated times and centrifuged at 20,000 g for 5 min at 4°C. The supernatant was collected into another tube, and the pellet was washed once with HEPES buffer. The supernatant and pellet were resolved by SDS–PAGE, and the gel was stained with Coomassie Brilliant Blue. Gel images were acquired with Amersham Imager 680 (GE Healthcare).
Imaging of in vitro NCOA4 assembly
FlAsH tag (CCPGCC)‐NCOA4 proteins were mixed with FlAsH‐EDT2 (Cayman Chemical) in the 1:5 molar ratio before imaging. All reactions were carried out in an HBS buffer. NCOA4 proteins were incubated with FeSO4 at 37°C for the indicated times and loaded onto a custom slide chamber created from a glass coverslip mounted on two parallel strips of double‐sided tape on a glass microscope slide. The samples were then imaged on an IX81 inverted microscope (Olympus) equipped with an FV1000 confocal imaging system (Olympus) and a 60×/1.42 NA oil objective lens (PlanApo N 60X, Olympus). Images were analyzed with ImageJ.
Immunoelectron microscopy and EDX analysis
Sample preparation was performed by the Tokai Electron Microscopy Corporation. Cells on gold disks were frozen in liquid nitrogen at −196°C. Once the cells were frozen, they were freeze‐substituted with 0.2% glutaraldehyde in ethanol and 2% distilled water at −80°C for 48 h. Afterward, they were held at −20°C for 4 h and then warmed to 4°C for 1 h. The samples were dehydrated through anhydrous ethanol three times for 30 min each. The samples were infiltrated with a 50:50 mixture of ethanol and resin at 4°C for 1 h. After this infiltration, they were subjected to three changes of 100% resin at 4°C for 30 min each, transferred to fresh 100% resin, and polymerized at 50°C overnight. The polymerized resins were sectioned (80 nm thickness) with a diamond knife on an ultramicrotome, and the sections were placed on nickel grids. The grids were incubated with the primary antibody in 1% BSA in PBS at 4°C overnight, washed three times with 1% BSA in PBS, and incubated with secondary antibody conjugated to 10 nm gold particles for 1 h at room temperature. After washing with PBS, the grids were placed in 2% glutaraldehyde in 0.1 M phosphate buffer. The grids were dried and stained with 2% uranyl acetate for 10 min and with lead stain solution at room temperature for 3 min. The grids were observed by TEM (JEM‐2200FS, JEOL, Ltd.), and the elemental components of the samples were analyzed by energy‐dispersive X‐ray spectroscopy (EDS; JED‐2300, JEOL, Ltd.).
Measurements of the relative amount of iron in cells
Cells were treated with FAC as indicated. After washing with PBS, cells were incubated in 1 μM calcein‐AM in FluoroBrite DMEM supplemented with 2 mM glutamine at 37°C for 10 min and washed twice with cold PBS. Cells were detached by trypsin and resuspended in FluoroBrite DMEM containing 2 mM glutamine. Cells were subjected to FACS, and fluorescence of calcein‐AM was measured in the FITC channel.
Immunoprecipitation
Anti‐FLAG antibody was added to Triton X‐100‐soluble cell lysate and incubated for 90 min at 4°C. After the addition of Protein A beads, the sample was incubated with rotation for 60 min at 4°C, followed by four washes with Triton buffer and two washes with 20 mM Tris–Cl pH 8.0. Immunoprecipitated proteins were denatured by the addition of 2× sample buffer and boiling at 95°C for 5 min.
Glycerol density gradient ultracentrifugation
Glycerol was dissolved at 20 and 50% in Tris buffer (50 mM Tris–Cl pH 8.0, 150 mM NaCl, 1 mM DTT). A 20–50% continuous glycerol gradient was prepared in a polyallomer tube (Beckman Coulter #326819) using a Gradient Master (BioComp). Triton X‐100 soluble lysate was overlaid on the gradient and centrifuged on an MLS‐50 Rotor (Beckman Coulter) at 100,000 g for 22 h at 4°C. Fractions were collected in a 48‐well plate using a MicroCollector (ATTO, AC‐5700P) and concentrated by acetone precipitation. The concentrated samples were dissolved in 1× sample buffer and boiled at 95°C for 5 min.
Author contributions
Kazuhiro Iwai: Conceptualization; Funding acquisition; Writing—original draft; Writing—review and editing. Sota Kuno: Conceptualization; Investigation; Writing—original draft; Writing—review and editing. Hiroaki Fujita: Funding acquisition; Methodology. Yu‐ki Tanaka: Methodology; Writing—original draft. Yasumitsu Ogra: Methodology; Writing—original draft.
In addition to the CRediT author contributions listed above, the contributions in detail are:
SK performed most of the experiments and analyzed the data. HF assisted with CRISPR screening. Y‐kT and YO contributed to ICP–MS analysis. SK and KI designed the experiments and wrote the manuscript.
Disclosure and competing interests statement
The authors declare no competing interests.
Supporting information
Appendix
Expanded View Figures PDF
Source Data for Expanded View/Appendix
Source Data for Figure 1
Source Data for Figure 2
Source Data for Figure 3
Source Data for Figure 4
Source Data for Figure 5
Source Data for Figure 6
Acknowledgments
We thank the members of the Iwai Laboratory for their helpful input on this study; Dr. Noboru Mizushima for FIP200 KO MEFs and the FKBP plasmid; Dr. Masato Kanemaki for the auxin degron plasmids; Dr. Feng Zhang for the mouse GeCKO library and other CRISPR vectors; Dr. Masahiko Tsujimoto for assisting EDX experiments, and the Medical Research Support Center of Kyoto University for cell sorting. S.K. is supported by a research fellowship from the Takeda Science Foundation. This work was supported by the following grants: JSPS KAKENHI grant number: 24112002 and the Takeda Science Foundation (to K.I.), JSPS KAKENHI grant number: 20H05319 (to F.H.), JSPS KAKENHI grant number: 19K16346 (to Y.T.), and JSPS KAKENHI grant number: 19H05772 (to Y.O.).
EMBO reports (2022) 23: e54278.
Data availability
This study contains no data deposited in external repositories.
References
- Agudo‐Canalejo J, Schultz SW, Chino H, Migliano SM, Saito C, Koyama‐Honda I, Stenmark H, Brech A, May AI, Mizushima N et al (2021) Wetting regulates autophagy of phase‐separated compartments and the cytosol. Nature 591: 142–146 [DOI] [PubMed] [Google Scholar]
- Amara JF, Clackson T, Rivera VM, Guo T, Keenan T, Natesan S, Pollock R, Yang W, Courage NL, Holt DA et al (1997) A versatile synthetic dimerizer for the regulation of protein‐protein interactions. Proc Natl Acad Sci USA 94: 10618–10623 [DOI] [PMC free article] [PubMed] [Google Scholar]
- Arosio P, Elia L, Poli M (2017) Ferritin, cellular iron storage and regulation. IUBMB Life 69: 414–422 [DOI] [PubMed] [Google Scholar]
- Asano T, Komatsu M, Yamaguchi‐Iwai Y, Ishikawa F, Mizushima N, Iwai K (2011) Distinct mechanisms of ferritin delivery to lysosomes in iron‐depleted and iron‐replete cells. Mol Cell Biol 31: 2040–2052 [DOI] [PMC free article] [PubMed] [Google Scholar]
- Banani SF, Lee HO, Hyman AA, Rosen MK (2017) Biomolecular condensates: organizers of cellular biochemistry. Nat Rev Mol Cell Biol 18: 285–298 [DOI] [PMC free article] [PubMed] [Google Scholar]
- Branon TC, Bosch JA, Sanchez AD, Udeshi ND, Svinkina T, Carr SA, Feldman JL, Perrimon N, Ting AY (2018) Efficient proximity labeling in living cells and organisms with TurboID. Nat Biotechnol 36: 880–887 [DOI] [PMC free article] [PubMed] [Google Scholar]
- Cabantchik ZI (2014) Labile iron in cells and body fluids: physiology, pathology, and pharmacology. Front Pharmacol 5: 45 [DOI] [PMC free article] [PubMed] [Google Scholar]
- Clackson T, Yang WU, Rozamus LW, Hatada M, Amara JF, Rollins CT, Stevenson LF, Magari SR, Wood SA, Courage NL et al (1998) Redesigning an FKBP‐ligand interface to generate chemical dimerizers with novel specificity. Proc Natl Acad Sci USA 95: 10437–10442 [DOI] [PMC free article] [PubMed] [Google Scholar]
- Dixon S, Lemberg K, Lamprecht M, Skouta R, Zaitsev E, Gleason C, Patel D, Bauer A, Cantley A, Yang W et al (2012) Ferroptosis: an iron‐dependent form of nonapoptotic cell death. Cell 149: 1060–1072 [DOI] [PMC free article] [PubMed] [Google Scholar]
- Dowdle WE, Nyfeler B, Nagel J, Elling RA, Liu S, Triantafellow E, Menon S, Wang Z, Honda A, Pardee G et al (2014) Selective VPS34 inhibitor blocks autophagy and uncovers a role for NCOA4 in ferritin degradation and iron homeostasis in vivo. Nat Cell Biol 16: 1069–1079 [DOI] [PubMed] [Google Scholar]
- Fujioka Y, Alam JM, Noshiro D, Mouri K, Ando T, Okada Y, May AI, Knorr RL, Suzuki K, Ohsumi Y et al (2020) Phase separation organizes the site of autophagosome formation. Nature 578: 301–305 [DOI] [PubMed] [Google Scholar]
- Goodwin JM, Dowdle WE, DeJesus R, Wang Z, Bergman P, Kobylarz M, Lindeman A, Xavier RJ, McAllister G, Nyfeler B et al (2017) Autophagy‐independent lysosomal targeting regulated by ULK1/2‐FIP200 and ATG9. Cell Rep 20: 2341–2356 [DOI] [PMC free article] [PubMed] [Google Scholar]
- Hentze MW, Muckenthaler MU, Galy B, Camaschella C (2010) Two to tango: regulation of mammalian iron metabolism. Cell 142: 24–38 [DOI] [PubMed] [Google Scholar]
- Iserman C, Desroches Altamirano C, Jegers C, Friedrich U, Zarin T, Fritsch AW, Mittasch M, Domingues A, Hersemann L, Jahnel M et al (2020) Condensation of Ded1p promotes a translational switch from housekeeping to stress protein production. Cell 181: 818–831.e819 [DOI] [PMC free article] [PubMed] [Google Scholar]
- Iwai K (2019) Regulation of cellular iron metabolism: Iron‐dependent degradation of IRP by SCF(FBXL5) ubiquitin ligase. Free Radic Biol Med 133: 64–68 [DOI] [PubMed] [Google Scholar]
- Jalihal AP, Pitchiaya S, Xiao L, Bawa P, Jiang X, Bedi K, Parolia A, Cieslik M, Ljungman M, Chinnaiyan AM et al (2020) Multivalent proteins rapidly and reversibly phase‐separate upon osmotic cell volume change. Mol Cell 79: 978–990.e975 [DOI] [PMC free article] [PubMed] [Google Scholar]
- Jones DT, Cozzetto D (2015) DISOPRED3: precise disordered region predictions with annotated protein‐binding activity. Bioinformatics 31: 857–863 [DOI] [PMC free article] [PubMed] [Google Scholar]
- Kaganovich D (2017) There is an inclusion for that: material properties of protein granules provide a platform for building diverse cellular functions. Trends Biochem Sci 42: 765–776 [DOI] [PubMed] [Google Scholar]
- Kilic S, Lezaja A, Gatti M, Bianco E, Michelena J, Imhof R, Altmeyer M (2019) Phase separation of 53BP1 determines liquid‐like behavior of DNA repair compartments. EMBO J 38: e101379 [DOI] [PMC free article] [PubMed] [Google Scholar]
- Lazarou M, Sliter DA, Kane LA, Sarraf SA, Wang C, Burman JL, Sideris DP, Fogel AI, Youle RJ (2015) The ubiquitin kinase PINK1 recruits autophagy receptors to induce mitophagy. Nature 524: 309–314 [DOI] [PMC free article] [PubMed] [Google Scholar]
- Mancias JD, Wang X, Gygi SP, Harper JW, Kimmelman AC (2014) Quantitative proteomics identifies NCOA4 as the cargo receptor mediating ferritinophagy. Nature 509: 105–109 [DOI] [PMC free article] [PubMed] [Google Scholar]
- Mancias JD, Pontano Vaites L, Nissim S, Biancur DE, Kim AJ, Wang X, Liu Y, Goessling W, Kimmelman AC, Harper JW (2015) Ferritinophagy via NCOA4 is required for erythropoiesis and is regulated by iron dependent HERC2‐mediated proteolysis. Elife 4: e10308 [DOI] [PMC free article] [PubMed] [Google Scholar]
- Noda NN, Wang Z, Zhang H (2020) Liquid‐liquid phase separation in autophagy. J Cell Biol 219: e202004062 [DOI] [PMC free article] [PubMed] [Google Scholar]
- Ohnstad AE, Delgado JM, North BJ, Nasa I, Kettenbach AN, Schultz SW, Shoemaker CJ (2020) Receptor‐mediated clustering of FIP200 bypasses the role of LC3 lipidation in autophagy. EMBO J 39: e104948 [DOI] [PMC free article] [PubMed] [Google Scholar]
- Riback JA, Katanski CD, Kear‐Scott JL, Pilipenko EV, Rojek AE, Sosnick TR, Drummond DA (2017) Stress‐triggered phase separation is an adaptive, evolutionarily tuned response. Cell 168: 1028–1040.e1019 [DOI] [PMC free article] [PubMed] [Google Scholar]
- Rouault TA (2006) The role of iron regulatory proteins in mammalian iron homeostasis and disease. Nat Chem Biol 2: 406–414 [DOI] [PubMed] [Google Scholar]
- Saad S, Cereghetti G, Feng Y, Picotti P, Peter M, Dechant R (2017) Reversible protein aggregation is a protective mechanism to ensure cell cycle restart after stress. Nat Cell Biol 19: 1202–1213 [DOI] [PubMed] [Google Scholar]
- Salahudeen AA, Thompson JW, Ruiz JC, Ma HW, Kinch LN, Li Q, Grishin NV, Bruick RK (2009) An E3 ligase possessing an iron‐responsive hemerythrin domain is a regulator of iron homeostasis. Science 326: 722–726 [DOI] [PMC free article] [PubMed] [Google Scholar]
- Sanjana NE, Shalem O, Zhang F (2014) Improved vectors and genome‐wide libraries for CRISPR screening. Nat Methods 11: 783–784 [DOI] [PMC free article] [PubMed] [Google Scholar]
- Sarraf SA, Shah HV, Kanfer G, Pickrell AM, Holtzclaw LA, Ward ME, Youle RJ (2020) Loss of TAX1BP1‐directed autophagy results in protein aggregate accumulation in the brain. Mol Cell 80: 779–795.e710 [DOI] [PMC free article] [PubMed] [Google Scholar]
- Shalem O, Sanjana NE, Hartenian E, Shi XI, Scott DA, Mikkelsen TS, Heckl D, Ebert BL, Root DE, Doench JG et al (2014) Genome‐scale CRISPR‐Cas9 knockout screening in human cells. Science 343: 84–87 [DOI] [PMC free article] [PubMed] [Google Scholar]
- Shin Y, Brangwynne CP (2017) Liquid phase condensation in cell physiology and disease. Science 357: eaaf4382 [DOI] [PubMed] [Google Scholar]
- Stockwell BR, Friedmann Angeli JP, Bayir H, Bush AI, Conrad M, Dixon SJ, Fulda S, Gascón S, Hatzios SK, Kagan VE et al (2017) Ferroptosis: a regulated cell death nexus linking metabolism, redox biology, and disease. Cell 171: 273–285 [DOI] [PMC free article] [PubMed] [Google Scholar]
- Sun D, Wu R, Zheng J, Li P, Yu L (2018) Polyubiquitin chain‐induced p62 phase separation drives autophagic cargo segregation. Cell Res 28: 405–415 [DOI] [PMC free article] [PubMed] [Google Scholar]
- Tumbarello DA, Manna PT, Allen M, Bycroft M, Arden SD, Kendrick‐Jones J, Buss F (2015) The autophagy receptor TAX1BP1 and the molecular motor myosin VI are required for clearance of Salmonella Typhimurium by autophagy. PLoS Pathog 11: e1005174 [DOI] [PMC free article] [PubMed] [Google Scholar]
- Vashisht AA, Zumbrennen KB, Huang X, Powers DN, Durazo A, Sun D, Bhaskaran N, Persson A, Uhlen M, Sangfelt O et al (2009) Control of iron homeostasis by an iron‐regulated ubiquitin ligase. Science 326: 718–721 [DOI] [PMC free article] [PubMed] [Google Scholar]
- Yamasaki A, Alam JM, Noshiro D, Hirata E, Fujioka Y, Suzuki K, Ohsumi Y, Noda NN (2020) Liquidity is a critical determinant for selective autophagy of protein condensates. Mol Cell 77: 1163–1175.e1169 [DOI] [PubMed] [Google Scholar]
- Yesbolatova A, Saito Y, Kitamoto N, Makino‐Itou H, Ajima R, Nakano R, Nakaoka H, Fukui K, Gamo K, Tominari Y et al (2020) The auxin‐inducible degron 2 technology provides sharp degradation control in yeast, mammalian cells, and mice. Nat Commun 11: 5701 [DOI] [PMC free article] [PubMed] [Google Scholar]
- Zaffagnini G, Savova A, Danieli A, Romanov J, Tremel S, Ebner M, Peterbauer T, Sztacho M, Trapannone R, Tarafder AK et al (2018) p62 filaments capture and present ubiquitinated cargos for autophagy. EMBO J 37: e98308 [DOI] [PMC free article] [PubMed] [Google Scholar]