Abstract
Objective:
4D-CBCT provides phase-resolved images valuable for radiomics analysis for outcome prediction throughout treatment courses. However, 4D-CBCT suffers from streak artifacts caused by under-sampling, which severely degrades the accuracy of radiomic features. Previously we developed group-patient-trained deep learning methods to enhance the 4D-CBCT quality for radiomics analysis, which was not optimized for individual patients. In this study, a patient-specific model was developed to further improve the accuracy of 4D-CBCT based radiomics analysis for individual patients.
Approach:
This patient-specific model was trained with intra-patient data. Specifically, patient planning 4D-CT was augmented through image translation, rotation, and deformation to generate 305 CT volumes from 10 volumes to simulate possible patient positions during the onboard image acquisition. 72 projections were simulated from 4D-CT for each phase and were used to reconstruct 4D-CBCT using FDK back-projection algorithm. The patient-specific model was trained using these 305 paired sets of patient-specific 4D-CT and 4D-CBCT data to enhance the 4D-CBCT image to match with 4D-CT images as ground truth. For model testing, 4D-CBCT were simulated from a separate set of 4D-CT scan images acquired from the same patient and were then enhanced by this patient-specific model. Radiomics features were then extracted from the testing 4D-CT, 4D-CBCT, and enhanced 4D-CBCT image sets for comparison. The patient-specific model was tested using 4 lung-SBRT patients’ data and compared with the performance of the group-based model. The impact of model dimensionality, region of interest (ROI) selection, and loss function on the model accuracy was also investigated.
Main results:
Compared with a group-based model, the patient-specific training model further improved the accuracy of radiomic features, especially for features with large errors in the group-based model. For example, the 3D whole-body and ROI loss-based patient-specific model reduces the errors of the first-order median feature by 83.67%, the wavelet LLL feature maximum by 91.98%, and the wavelet HLL skewness feature by 15.0% on average for the four patients tested. In addition, the patient-specific models with different dimensionality (2D vs. 3D) or loss functions (L1 vs. L1+VGG+GAN) achieved comparable results for improving the radiomics accuracy. Using whole-body or whole-body+ROI L1 loss for the model achieved better results than using the ROI L1 loss alone as the loss function.
Significance:
This study demonstrated that the patient-specific model is more effective than the group-based model on improving the accuracy of the 4D-CBCT radiomic features analysis, which could potentially improve the precision for outcome prediction in radiotherapy.
Keywords: Radiomics, deep learning, generative adversarial network, under-sampled projections, 4D-CBCT, patient-specific
1. Introduction
Radiomic features extracted from CT and CBCT images have potentials for outcome predictions, such as locoregional recurrence, distant metastasis, and overall survival (Ganeshan et al., 2012) (Huynh et al., 2016). However, the image quality of CBCT and CT images varies due to dose, noise level, resolution, scatter, and patient motion, which can impact the robustness and reproducibility of radiomic features. Thus, researchers have developed models to improve the CT image quality, which could further improve the robustness and reproducibility of radiomic features extracted from these images. For example, a super-resolution model (Park et al., 2019) has been developed to enhance CT images by changing the slice thickness. A generative adversarial network (GAN) (Li et al., 2021) has been implemented to normalize CT images of different acquisition parameters, such as different reconstruction kernels. However, similar studies all focused on improving CT image quality. Enhancing CBCT image quality for radiomics analysis is lacking, even though CBCT images provide valuable daily information during the treatment courses. In radiation therapy, CBCT images are scanned before each treatment for positioning guidance. Thus, these daily images could be important for treatment assessment, response prediction, or adaptive planning. When imaging treatment sites that are affected by respiratory motions, such as lung tumors, traditional 3D-CBCT only provides an average image of different respiratory phases, which causes motion blurriness and artifacts to the tumor significantly impacting the accuracy of radiomic features. To resolve this issue, phase-resolved 4D-CBCT was developed to capture the respiratory motion of the patient with much-reduced motion artifacts. Even though 4D-CBCT images have fewer motion artifacts, the number of projections for 4D-CBCT reconstruction are always under-sampled, due to the time and dose constraints in clinical applications. This under-sampling causes severe noise and streak artifacts leading to degraded image quality. Therefore, enhancing 4D-CBCT image quality is essential for improving radiomics feature accuracy, which could further benefit the outcome prediction using radiomics.
Several methods, including traditional models and deep learning models, have been developed to improve the image quality of 4D-CBCT images. For example, most of the early publications focused on traditional methods, such as motion compensation (Rit et al., 2009), prior knowledge-based estimation (Ren et al., 2014), and compressed sensing-based iterative reconstruction (Li et al., 2002). The motion compensation method combines different phases of 4D-CBCT into one phase by deformable registration. Although this method improves the image quality, it requires a large amount of time and could have residual motion blurring due to errors in the compensation. The prior knowledge-based estimation method is also time-consuming due to the 3D-2D deformable registration involved. Compressed sensing-based iterative reconstruction methods can often over smooth the 4D-CBCT images when removing the streak artifacts. Even though these methods reduced noise, the high-frequency details can also be removed. In addition, iterative reconstruction also requires complicated processing steps and a substantial amount of time. In recent years, deep learning becomes a promising method for image enhancement due to its efficiency and high performance. For example, we developed a symmetric residual convolutional neural network (Jiang et al., 2019) to augment the image quality of 4D-CBCT. Results demonstrated its efficacy in substantially enhancing the image quality, achieving performance superior to the conventional methods. This deep learning model is also much faster than the conventional methods, taking only seconds to enhance the 4D-CBCT.
Although different methods were developed for 4D-CBCT enhancement, there has been a lack of studies to investigate the impact of 4D-CBCT image quality on radiomics feature analysis. To our knowledge, our recent publication is the first study to investigate the impact of 4D-CBCT image quality on radiomics feature accuracy and the efficacy of image enhancement to improve the accuracy (Zhang et al., 2021). Results showed that 4D-CBCT image quality can significantly affect the accuracy of derived radiomics features and the deep learning model was able to improve the accuracy of radiomics analysis by enhancing the 4D-CBCT images. One limitation of this previous study was that the deep learning model was trained by a group of different patients’ data, which may not be optimal when being applied to individual patients due to the interpatient variations. For example, body size, tumor, breathing and anatomical structures vary across different patients, leading to variations in the artifacts. Group-based models cannot correct the artifacts caused by patient-specific changes, which can impair the accuracy of radiomic features derived. Potentially building a patient-specific model based on an individual patient’s data can address the limitation of the group-based model. Our recent study demonstrated the great potential of building a patient-specific deep learning model to enhance the quality of digital tomosynthesis images (Jiang et al., 2021). Thus, in this study, we aim to develop a patient-specific deep learning model based on the augmented intra-patient data to further improve the image quality of 4D-CBCT to enhance the accuracy of radiomic features extracted from the images.
The developed patient-specific model was trained by augmented patient-specific data. The 4D-CT images were augmented from 10 phase images to 305 image volumes of each patient by translation, rotation, and deformation. 4D-CBCT images were simulated from 4D-CT images based on simulated projections and FDK reconstruction (Feldkamp et al., 1984). The patient-specific model was trained to match 4D-CBCT images to 4D-CT images using this intra-patient data. Once trained, the model can be used to enhance the images for the specific patient. Then, radiomic features were extracted from original 4D-CBCT images and enhanced 4D-CBCT images. Features extracted from 4D-CT images served as the ground truth to evaluate the accuracy of radiomics features extracted from 4D-CBCT. Different model architectures, ROI selections, and loss functions were explored in the patient-specific model, and their performance was also compared to the group-based model we developed in the previous paper.
2. Materials and methods
2.1. Overall Workflow
Figure 1 presents the overall workflow of the study, which contains four steps in total. Unlike the traditional model trained by a group of different patients, the patient-specific model used a single patient for training. However, this might cause overfitting due to a lack of data. Thus, The first step is to augment patient data to mimic all possible positions and respiratory conditions of the patient during CT image acquisition. In traditional data augmentation, researchers only shift and rotate the original image, however, our method not only utilizes translation and rotation but also augments the CT images by body deformation. The second step is to simulate the under-sampled 4D-CBCT images from augmented 4D-CT images using DRRs and FDK (Feldkamp et al., 1984) reconstruction. The third step is to train the patient-specific model, which is modified from the pix2pix model (Isola et al., 2017). In this step, simulated 4D-CBCT images are used as the input of the pix2pix model, and the corresponding augmented 4D-CT images are used as the ground truth to train the model. The fourth step is to test the model performance. 4D-CBCT images acquired from the same patient but on a different day are used as the input, and the model outputs enhanced 4D-CBCT. The accuracy of the radiomic features of the 4D-CBCT before and after the enhancement is calculated and compared to evaluate the efficacy of the patient-specific model.
Figure 1.
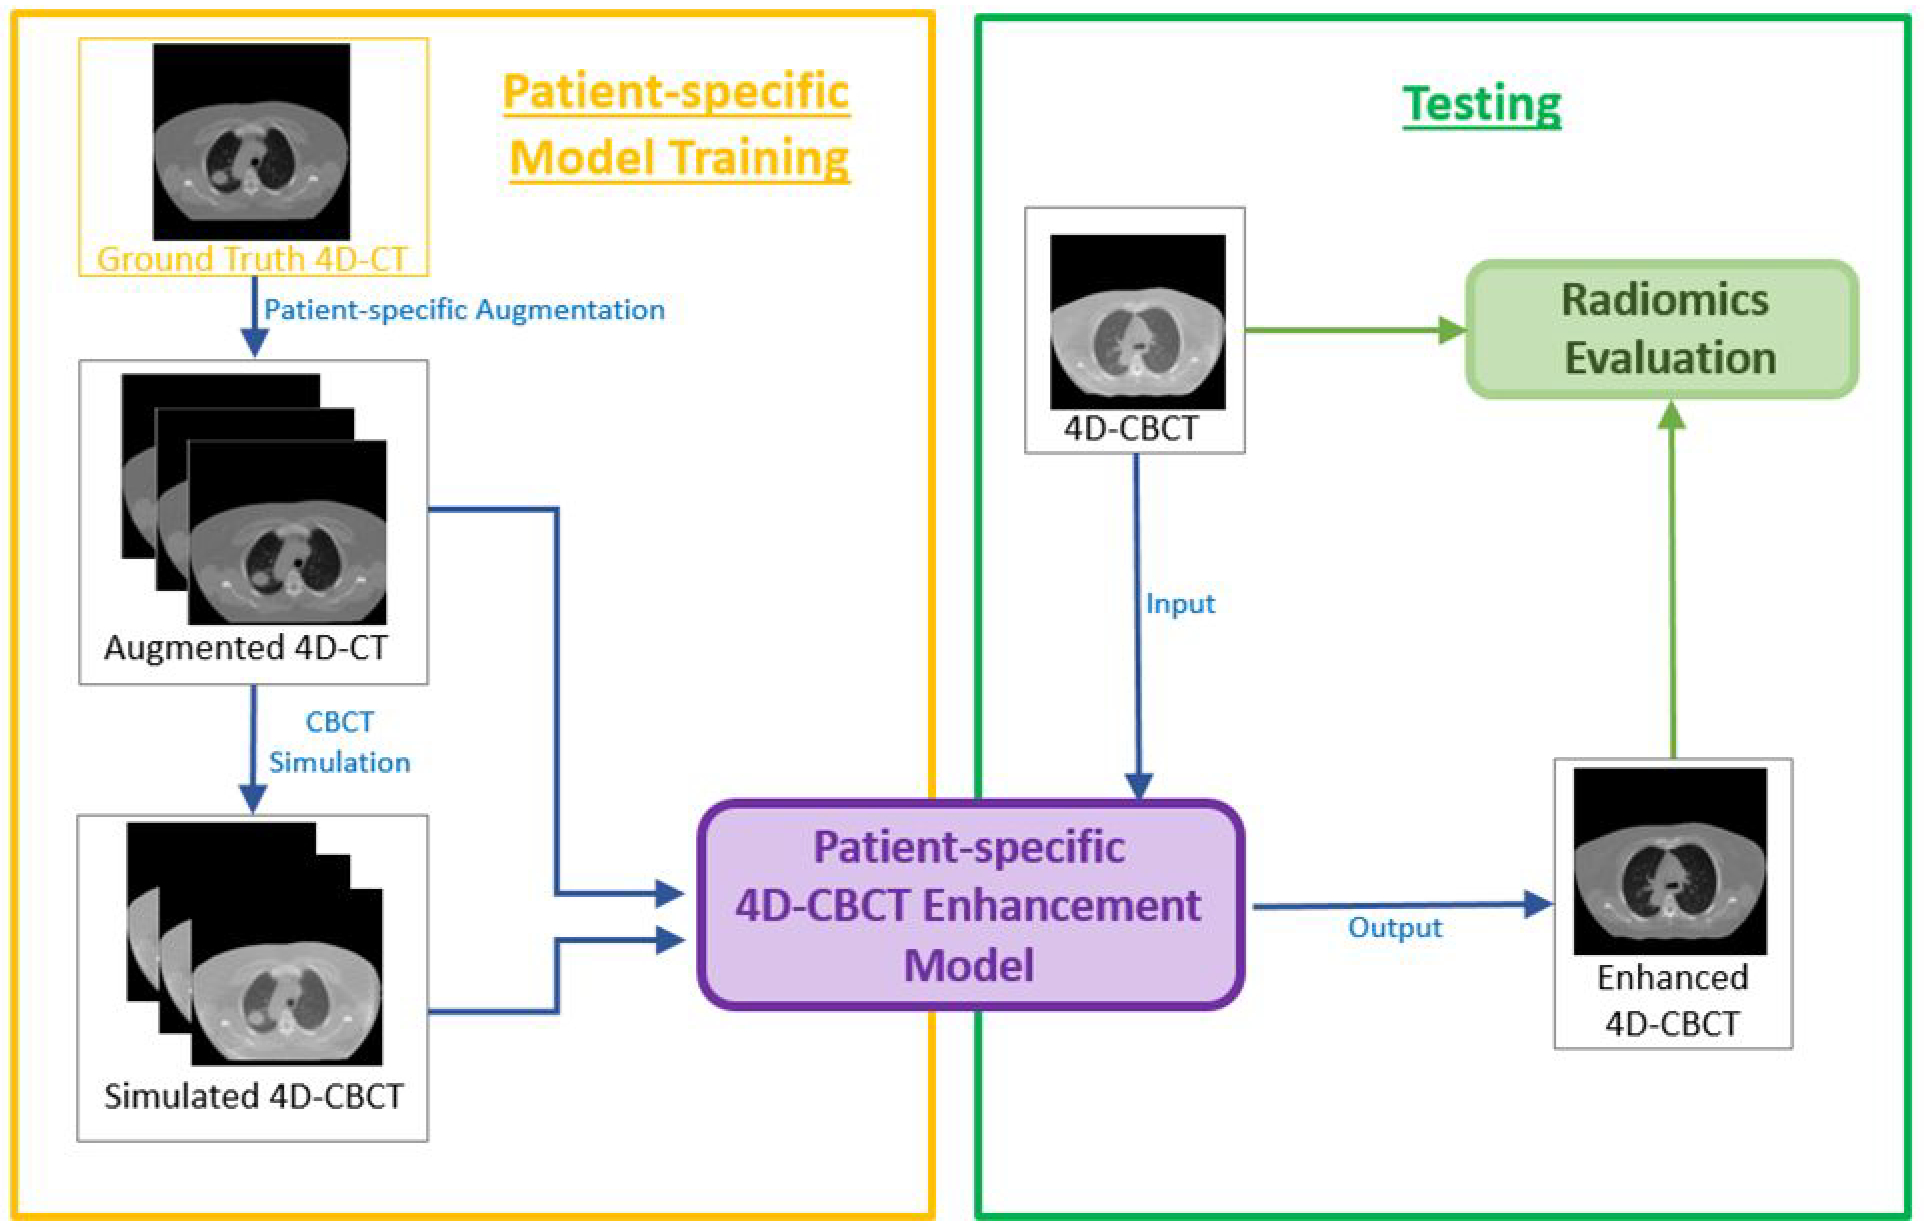
Workflow of the entire study
2.2. Patient-specific data augmentation
In this patient-specific model training process, CT images from the same patient served as the ground truth. However, overfitting would occur if models were only trained based on one set of 4D-CT images, and the model would not be robust if the model were tested on another 4D-CT acquired at different time. This is because of the position variation and breathing change during day-to-day acquisition. In the following, we used three data augmentation methods to avoid overfitting.
For image translation, we shifted the original CT image between ±6.0 mm for left-right and anterior-posterior directions, and ±4.0 mm for superior-inferior directions. For image rotation, images were rotated between ±3.0° along the superior-inferior axis (Jiang et al., 2020). These parameters were chosen to mimic clinical situations. In total, 125 patient volumes were simulated based on the translation and rotation. To simulate deformations due to breathing, we implemented a method (Jiang et al., 2020) based on principle components of Deformation Vector fields (DVFs). The principal component analysis (PCA) method was used to estimate the first three principal motion components, which could be enough to capture at least 90% of motion variance due to patient breathing. Different weightings were used for the components to generate 180 volumes in this deformation step and 305 images were simulated in total from 10 images based on three augmentation techniques.
2.3. 4D-CBCT simulation
From the previous step, 305 CT volumes were obtained for each training model. These 4D-CT volumes were served as the ground truth for 4D-CBCT simulation. 4D-CBCT images with 72 half-fan projections per volume were simulated. 72 projections were chosen empirically since the generated image quality is close to the real 4D-CBCT in the clinic. The angles of these half-fan projections were evenly distributed across 360° and each of the projections was obtained based on the ray-tracing algorithm from CT images. The projections were reconstructed based on our in-house Matlab FDK reconstruction software and there are also few published papers based on the software (Chen et al., 2018) (Chen et al., 2019) (Jiang et al., 2021). Based on the Varian onboard imaging geometry, the projection size was set to 512×384 and the resolution is 0.0776cm × 0.0776cm. The source-to-isocenter distance is 100 cm, and the source-to-detector distance is 150 cm. The detector with a 16cm offset was used for half-fan projection acquisition. 4D-CBCT images were simulated with the above parameters and the size for each volume is 512×512×96.
2.4. Pix2pix Deep learning network
Pix2pix (Isola et al., 2017) model is a generative adversarial network developed to perform image-to-image translation. Fig. 2 shows the architecture of the model. Similar to other generative adversarial networks, the pix2pix model consists of a generator and a discriminator. The generator generates 4D-CT-like images with 4D-CBCT as the input. The discriminator evaluates the reality and accuracy of the generated images by comparing them with real 4D-CT images. For the generator, we implemented a Resnet model (He et al., 2016) with 9 residual blocks. Each of the residual blocks contains a convolution layer, a normalization layer, and a ReLU activation layer. The discriminator contains a convolution layer, a leakyReLU layer, and 4 discriminator layers. Each of the discriminator layers is composed of a convolution layer, a normalization layer, and a leakyReLU activation layer. At the end, the discriminator uses a final convolution layer to output a one-channel prediction map. In this study, all of the layers for 3D models were updated to 3-dimension layers so that the input and output of the model can be 3-dimensional, which also matches the dimension of CT and CBCT volumes. Loss functions are also modified and detailed information is discussed below in section 2.5. During the training process, the total epoch of each model is 100 epochs with batch size=1. The learning rate and the momentum term of Adam optimizer are empirically set to 0.0002 and 0.5.
Figure 2.
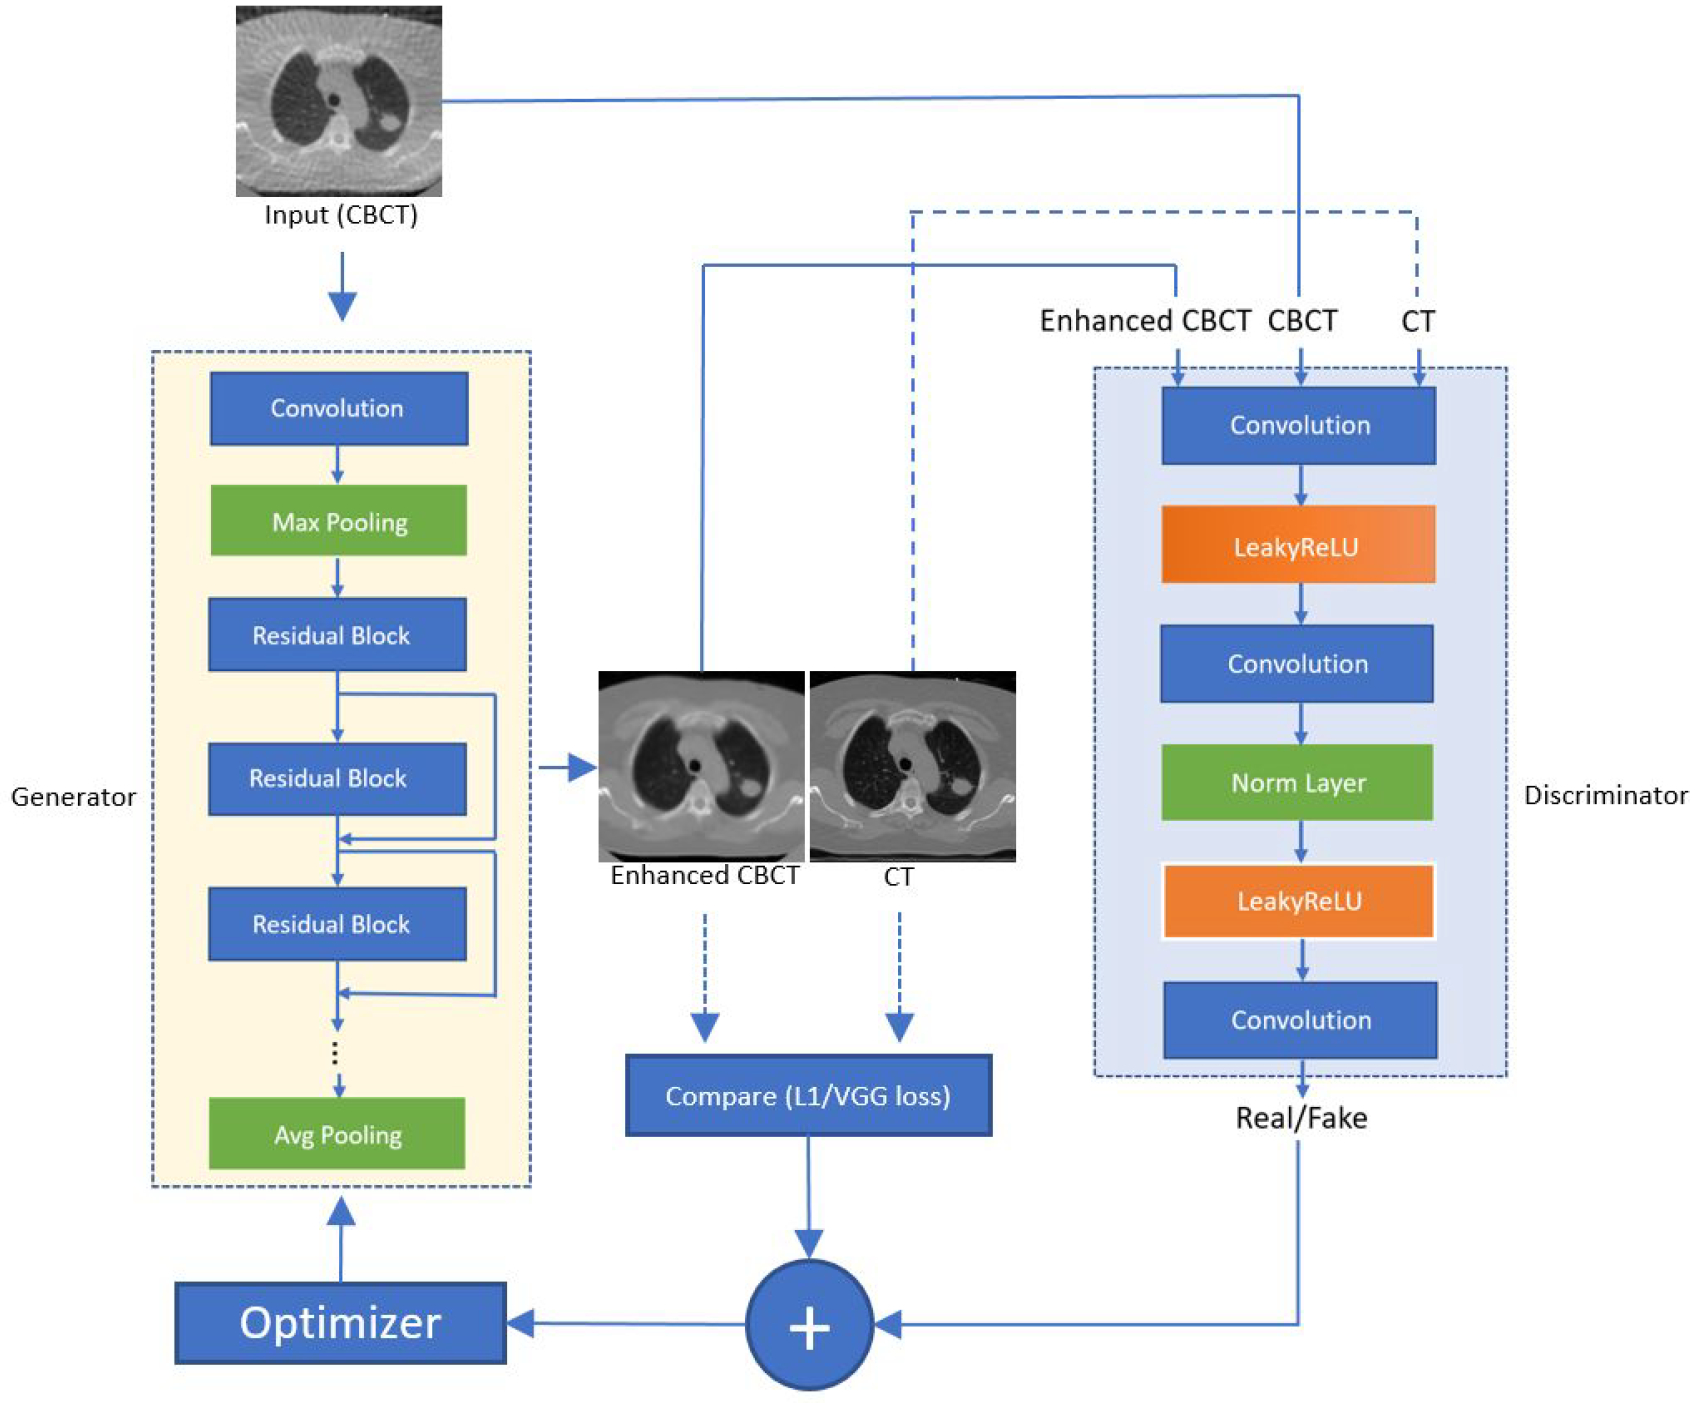
Architecture of the pix2pix model. The yellow block represents the generator and it utilizes the architecture of Resnet 9 blocks. The large blue block represents the architecture of the discriminator.
2.5. Experiment design
2.5.1. Dataset
The training and testing dataset of the patient-specific study was obtained from the Cancer Imaging Archive (TCIA). The reference group-based training dataset was obtained from the public SPARE challenge data. To make a fair comparison between the group-based and patient-specific models, we trained two models with the same deep learning architecture and parameters. For patient-specific training, the first 4D-CT underwent data augmentation and was used to train the patient-specific model. The second 4D-CT acquired on a different day was used to simulate 4D-CBCT to test the model. Radiomics features extracted from the second 4D-CT were used as the ground truth to evaluate the accuracy of radiomics features in the original and enhanced 4D-CBCT. Thus, patient data with multiple 4D-CT image sets for each patient are needed. In this study, we trained and tested the patient-specific models for four patients with different locations and sizes of tumor. Information of the patient tumor sizes and locations are listed in Table 1 and also shown in Figure 3. The reason for choosing these four patients is to investigate the impact of tumor locations and sizes on image enhancement and radiomics analysis. As listed in the table, patients 1 and 2 have similar tumor sizes, but different tumor locations. Patients 3 and 4 have similar tumor locations in the body, but different tumor sizes.
Table 1.
Patient tumor size information
| Patient # | Tumor volume | Tumor location |
|---|---|---|
| 1 | 6.96cc | Center of LLung |
| 2 | 6.52cc | Center of RLung |
| 3 | 33.6cc | RLung and close to mediastinum |
| 4 | 201cc | Rlung and close to mediastinum |
Figure 3.
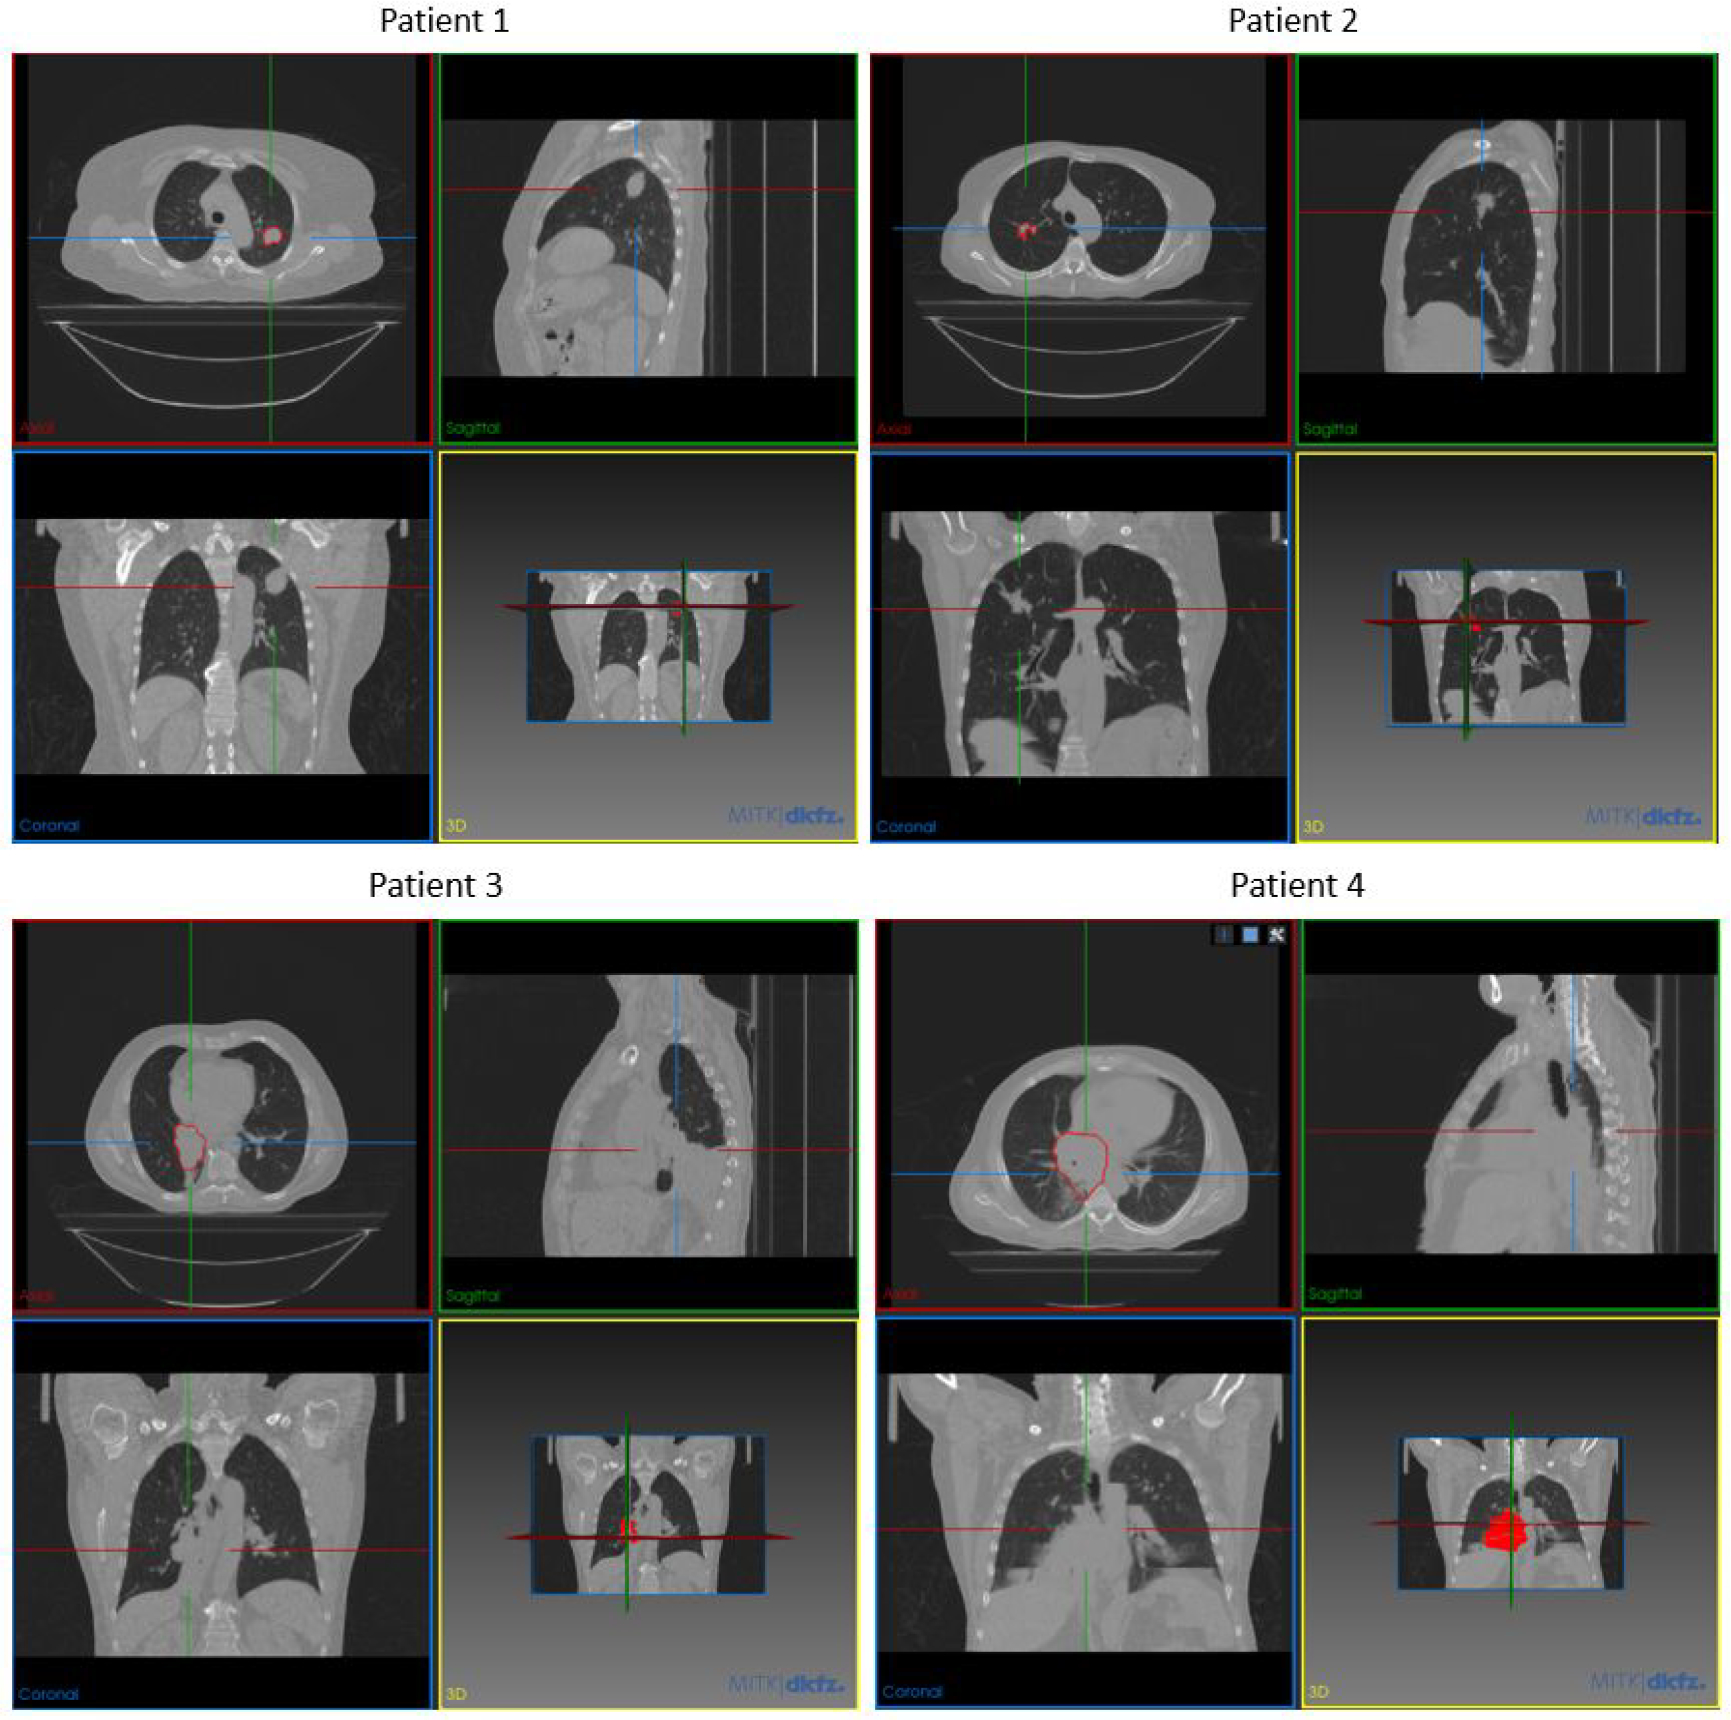
Tumor locations of each patient shown by MITK software (Goch et al., 2017)
For each patient, the first 4D-CT underwent data augmentation as explained in 2.2. 4D-CBCT simulated from the augmented 4D-CT was used as the model input to train the model to enhance 4D-CBCT to match with the ground truth 4D-CT images. Then the model was tested using 4D-CBCT simulated from the second 4D-CT of the patient. Both 4D-CT and 4D-CBCT images were preprocessed to 256×256×96 dimension and 1.5mm×1.5mm×3mm voxel size to save the memory of GPU during training. During training, the input 256×256×N was selected from 256×256×96 slices based on the size and location of the tumor. Due to the FDK reconstruction algorithm, the gray-level intensity of 4D-CBCT images is intrinsically different from that of 4D-CT images. The original gray-level distribution of 4D-CBCT is around [−50,150], which is very different from the HU value of 4D-CT images. Thus, images of 4D-CBCT were then scaled to [−1000, 1000] to better match the intensity of original 4D-CT images and then served as the input of the patient-specific model.
2.5.2. Radiomic feature extraction
There are four steps (Gillies et al., 2016) needed to extract radiomic features from images. The first step is image acquisition. As discussed in the previous section, the dataset of ground truth 4D-CT was acquired from the public dataset, TCIA. The original 4D-CBCT was acquired by projection simulation from 4D-CT images and enhanced 4D-CBCT was generated by the patient-specific model. Next, the tumor volume was contoured by experienced clinicians on each phase. The third step is preprocessing. In this step, we resampled all tumors to 1.5mm×1.5mm×3mm voxel size and normalized this region of interest with z-normalization. This normalization is performed by centering the image at the mean and divided by the standard deviation. Next, the pixels in the tumor were grouped into different bin numbers based on the tumor size. For patient 1 and 2, 32 bins were used to segment the tumor pixel values. For patient 3 and 4, 96 and 128 bins were used respectively due to the larger tumor sizes. Last, radiomics extraction was performed by pyradiomics software (Van Griethuysen et al., 2017).
In total, 946 features were extracted using pyradiomics. The features include 18 first-order features, 68 texture features, 172 LoG features, and 688 wavelet features. First-order features include statistic features such as median, mean, maximum, energy. Texture features include 22 gray-level co-occurrence matrix (GLCM) features, 16 gray-level run-length matrix (GLRLM) features, 16 gray-level size-zone matrix (GLSZM) features and 14 gray-level dependence matrix (GLDM) features. The above first 86 features were defined as low-level features in this study. LoG features were the first order and texture features extracted after performing Laplacian of Gaussian filtering to the original image. 3mm and 5mm sigma values were chosen empirically. 688 wavelet features were obtained after performing wavelet band-pass filtering to the original images in eight different octants. The LoG features and wavelet features were defined as high-level features in this study. The shape features in this study were excluded since the same tumor contour was used for all CT and CBCT images of the same patient.
2.5.3. Radiomic features selection
Currently, researchers developed different models for outcome prediction based on radiomic features, such as the Lasso classification model (Zhu et al., 2018), random forest (Jia et al., 2019), or clustering (Parmar et al., 2015). However, it is impossible for the models to use all of the 946 features for prediction due to time and complexity limitations. In addition, these features might have randomness and redundancy, which could adversely impact the results of the outcome prediction model. Thus, valuable features need to be selected for efficient and effective outcome prediction. In this study, we focused on evaluating the impact of image quality on radiomics features that were selected by a highly cited publication (Huynh et al., 2016) about using CT radiomics for lung cancer outcome prediction. Huynh et al developed a two-step method (Huynh et al., 2016) for feature selection. The first step is to compare the intra-class correlation coefficient and select features with a value greater than 0.8. Then, PCA is applied to further reduce the dimension and get the most valuable features that could describe the characteristics of the tumor. The study selected 10 features based on the concordance index, which indicates the proportionality of each feature to the outcome prediction (Huynh et al., 2016). These features are median, GLCM cluster shade, LLH range, LHL total energy, HLL skewness, LLL max, LoG 3mm skewness, LoG 5mm skewness, LoG 3mm GLCM inverse difference, LoG 5mm GLRLM short-run emphasis. In our study, we utilized these validated features to further investigate the impact of image quality on the feature accuracy and the efficacy of using a patient-specific model to enhance the accuracy.
2.5.4. Evaluation
To evaluate the performance of patient-specific models, we compared the radiomic features of the original 4D-CBCT, patient-specific enhanced 4D-CBCT with the ground truth 4D-CT. The patient-specific models were also compared with group-based models (Zhang et al., 2021), which were trained by using ten different patients’ data from the public SPARE dataset (Shieh et al., 2019). The radiomic features error was evaluated by the following equation:
| (1) |
The equation calculates the difference of values between the 4D-CBCT feature and the 4D-CT feature and normalizes by the 4D-CT feature. In equation 1, the 4D-CT feature serves as the ground truth. The 4D-CBCT feature is compared with the ground truth 4D-CT. The feature errors were calculated for both the original 4D-CBCT and the 4D-CBCT enhanced by different models.
2.5.5. Impact of patient-specific vs. group-based training
In the previous study, we investigated the group-based model for enhancing the 4D-CBCT radiomic feature accuracy. In this study, we developed a patient-specific model to further optimize the model performance for individual patients. To evaluate the improvements in radiomics accuracy and robustness, we trained the same model with the group-based data and patient-specific data respectively, and compared the results of radiomic features.
2.5.6. Impact of model dimensionality
One aspect to investigate is the impact of model dimensionality on radiomics. In radiomic analysis, the radiomic features were calculated for the 3D volume of the tumor. Thus, it will be valuable to investigate whether the 3D deep learning model has an advantage over the 2D model in enhancing the accuracy of radiomics features. In this study, we modified the original 2D pix2pix to 3D pix2pix and compared both models to investigate if the dimensionality of the model could have an impact on the radiomic features.
2.5.7. Impact of the region of interest selection
To investigate the impact of the region of interest (ROI) selection in the model training, we compared the models trained with whole image L1 loss, ROI L1 loss with the ROI centered on the tumor region, and a weighted sum of whole image and ROI losses. The whole image L1 loss is the conventional L1 loss and it uses the whole-body difference as the loss function. However, radiomics features are only extracted from the tumor region. Thus, enhancing the ROI around the tumor is more crucial than enhancing other areas of the body for radiomics analysis. The ROI-based loss was calculated only using the difference inside the tumor region.
2.5.8. Impact of loss functions on radiomics analysis
In this section, the impact of loss functions was investigated. We implemented two models with different loss functions and compared the results of the radiomics analysis. The first model uses the L1 loss, which computes the difference between the generated and ground truth images. For the second model, we used VGG (Johnson et al., 2016) loss and GAN loss in addition to the L1 loss functions. The VGG loss was utilized since it has been proved to improve the image texture and sharpness for style transfer and super-resolution (Wang et al., 2018). GAN loss was implemented to update the performance of the discriminator, which could further improve the high-frequency details of generated images. The weightings of each loss function were empirically optimized.
3. Results
3.1. Image enhancement for radiomics analysis
Figure 4 illustrates images of the simulated 4D-CBCT based on 72 half-fan cone-beam projections, enhanced 4D-CBCT from group-based model and patient-specific models, and the ground truth CT. Within the patient-specific models, we further compared the results of the model with different dimensionality (2D vs. 3D), ROI selections, and the loss functions as described in 2.5. The group-based enhancement model serves as a baseline for comparison. These enhancement results proved that all of the deep learning models were able to enhance the original 4D-CBCT images by matching the intensities and contrast to those of 4D-CT images. Besides, the streaks and artifacts were removed after image enhancement. The group-based enhancement results contained more artifacts than the patient-specific enhancement results. For example, the soft tissue and muscles at the bottom were not restored accurately, as illustrated in the red arrows of Figure 4C. The 2D patient-specific model achieves better results compared to the group-based model, since the model corrected all bones, tissues, and tumors accurately. However, the image is more blurred and lacks high-frequency details, as indicated in the red arrow in Figure 4D. Both the patient-specific 3D whole-body model with and without ROI loss function achieve similar results in reducing the streaks and artifacts of the original 4D-CBCT. The patient-specific model with GAN and VGG loss functions performed better since it contains more details, and the sharpness of anatomical structures was enhanced, as illustrated in Figure 4G. From the PSNR evaluation, the original CBCT, Figure 4B, has a PSNR value of 24.94 dB. The group-based Figure 4D and the patient-specific Figure 4G have PSNR 29.45 dB and 31.52 dB respectively.
Figure 4.
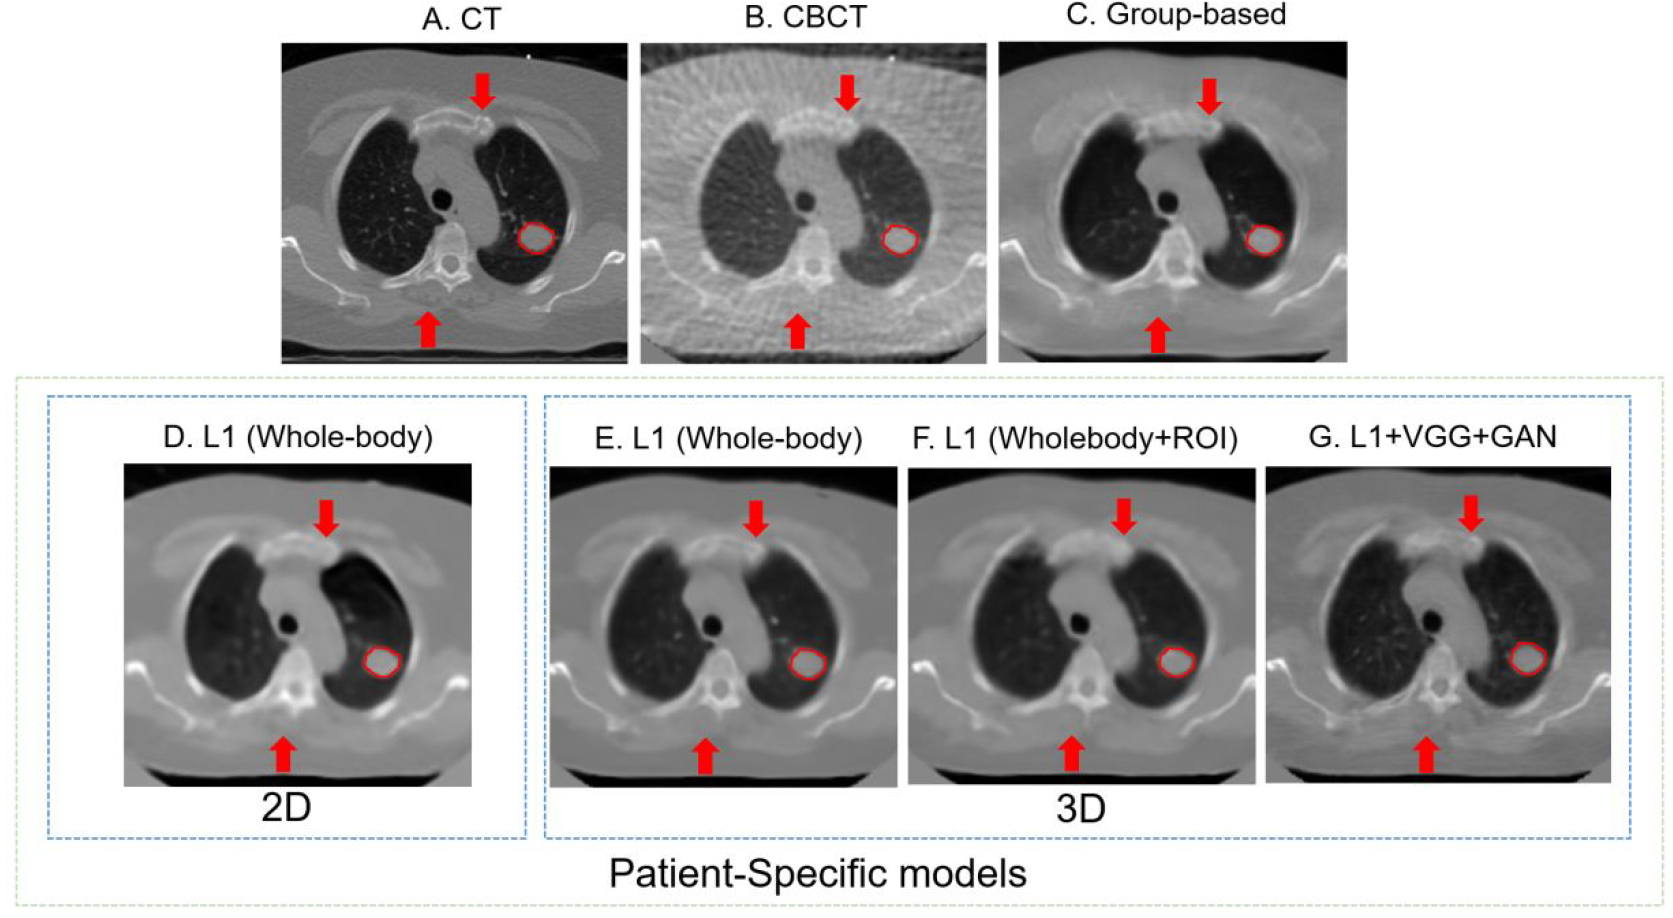
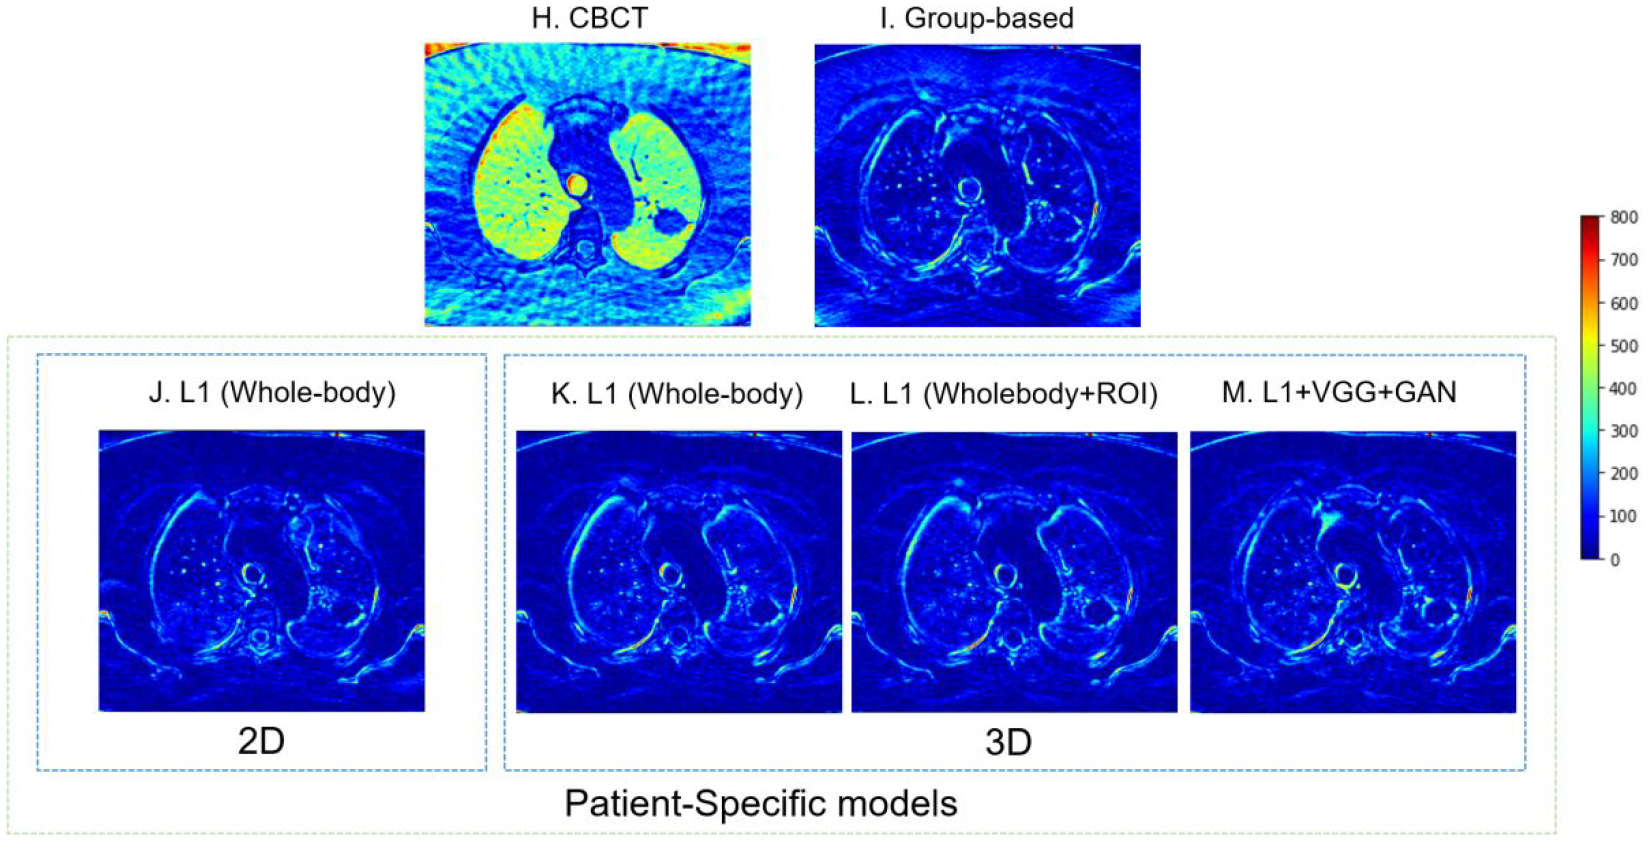
4D-CBCT images before and after enhancement with W/L = 2200/100. Red arrows show the same locations of different images, which could help detail comparisons across different images. The red circles highlight the region of interest. The difference between ground truth CT and each image is also plotted. (A) The ground truth 4D-CT images. (B) The original under-sampled 4D-CBCT before enhancement. (C) The enhanced 4D-CBCT by the group-based model. D-G are results from patient-specific models: (D) The enhanced 4D-CBCT image using 2D pix2pix model with only whole image L1 loss. (E) The enhanced 4D-CBCT image using 3D pix2pix model with only whole image L1 loss. (F) The enhanced 4D-CBCT image using 3D pix2pix model with both whole image L1 and ROI L1 loss functions. (G) The enhanced 4D-CBCT image using 3D pix2pix model with whole image L1, ROI L1, VGG, and GAN loss functions. (H-M) are the corresponding difference images between ground truth CT and (B-G). The color bar on the right shows the difference of each pixel value between the enhancement results and ground truth CT.
3.2. Comparison of patient-specific and group-based training
In the previous study, we proved that the group-based model, which was trained by multiple patients, had the potential to improve the radiomics accuracy. To compare the group-based model and patient-specific model, we trained these two types of models with the same loss functions and architectures. Table 2 and Figure 5 show the comparison of radiomic feature errors in the original CBCT and enhanced CBCT by the group-based and patient-specific models. The 10 clinically relevant features used for analysis were selected based on a previous study (Huynh et al., 2016), as explained in section 2.5.3. From Table 2, it is clear to state that both models could improve the radiomics accuracy in the original 4D-CBCT. The patient-specific model further improved the accuracy of radiomic features that had large errors in the 4D-CBCT enhanced by the group-based model. In Figure 5, the patient-specific model had consistently low errors across features, and features with large errors in the group-based model, such as feature 6, LLL max, were further improved by the patient-specific model. Take patient 1 as an example, the error of feature 6 was reduced from 4.29 in the original 4D-CBCT to 2.67 by the group-based model, and it was further reduced to 0.50 by the patient-specific model, indicating an 88.3% reduction of the error.
Table 2.
Comparison between the patient-specific model and the group-based model. Green columns highlight features from the patient-specific model that have improvements over group-based model.
| ID | Model | 1. Median | 2. Glcm clustershade | 3. LLH range | 4. LHL totalenergy | 5. HLL skewness | 6. LLL max | 7. LoG 3mm skewness | 8. LoG 5mm skewness | 9. LoG 3mm glcm inverse difference | 10. LoG 5mm rlgl short run emphasis |
|---|---|---|---|---|---|---|---|---|---|---|---|
| 1 | Original CBCT | 8.51 | 0.35 | 0.19 | 0.01 | 0.68 | 4.29 | 0.37 | 0.50 | 0.14 | 0.03 |
| Group-based | 2.32 | 0.37 | 0.38 | 0.01 | 0.07 | 2.67 | 0.14 | 0.76 | 0.10 | 0.01 | |
| Patient-specific | 1.30 | 0.38 | 0.03 | 0.01 | 0.35 | 0.50 | 0.10 | 0.86 | 0.03 | 0.01 | |
| 2 | Original CBCT | 0.85 | 0.75 | 0.16 | 0.01 | 0.43 | 13.61 | 4.29 | 17.29 | 0.02 | 0.02 |
| Group-based | 0.28 | 0.10 | 0.24 | 0.01 | 0.51 | 6.46 | 0.41 | 11.29 | 0.02 | 0.01 | |
| Patient-specific | 0.32 | 0.52 | 0.23 | 0.01 | 0.70 | 1.14 | 2.42 | 10.99 | 0.03 | 0.01 | |
| 3 | Original CBCT | 8.49 | 0.20 | 0.60 | 0.00 | 0.78 | 1.91 | 0.58 | 0.52 | 0.39 | 0.04 |
| Group-based | 0.46 | 0.20 | 0.10 | 0.00 | 0.07 | 0.14 | 0.25 | 0.31 | 0.06 | 0.01 | |
| Patient-specific | 0.85 | 0.16 | 0.11 | 0.00 | 0.07 | 0.16 | 0.33 | 0.45 | 0.06 | 0.01 | |
| 4 | Original CBCT | 4.68 | 0.59 | 0.68 | 0.00 | 0.86 | 1.25 | 0.66 | 0.44 | 0.43 | 0.18 |
| Group-based | 1.05 | 0.67 | 0.05 | 0.00 | 0.10 | 2.71 | 0.05 | 0.22 | 0.04 | 0.08 | |
| Patient-specific | 0.35 | 0.05 | 0.05 | 0.00 | 0.67 | 0.75 | 0.07 | 0.07 | 0.00 | 0.01 |
Figure 5.
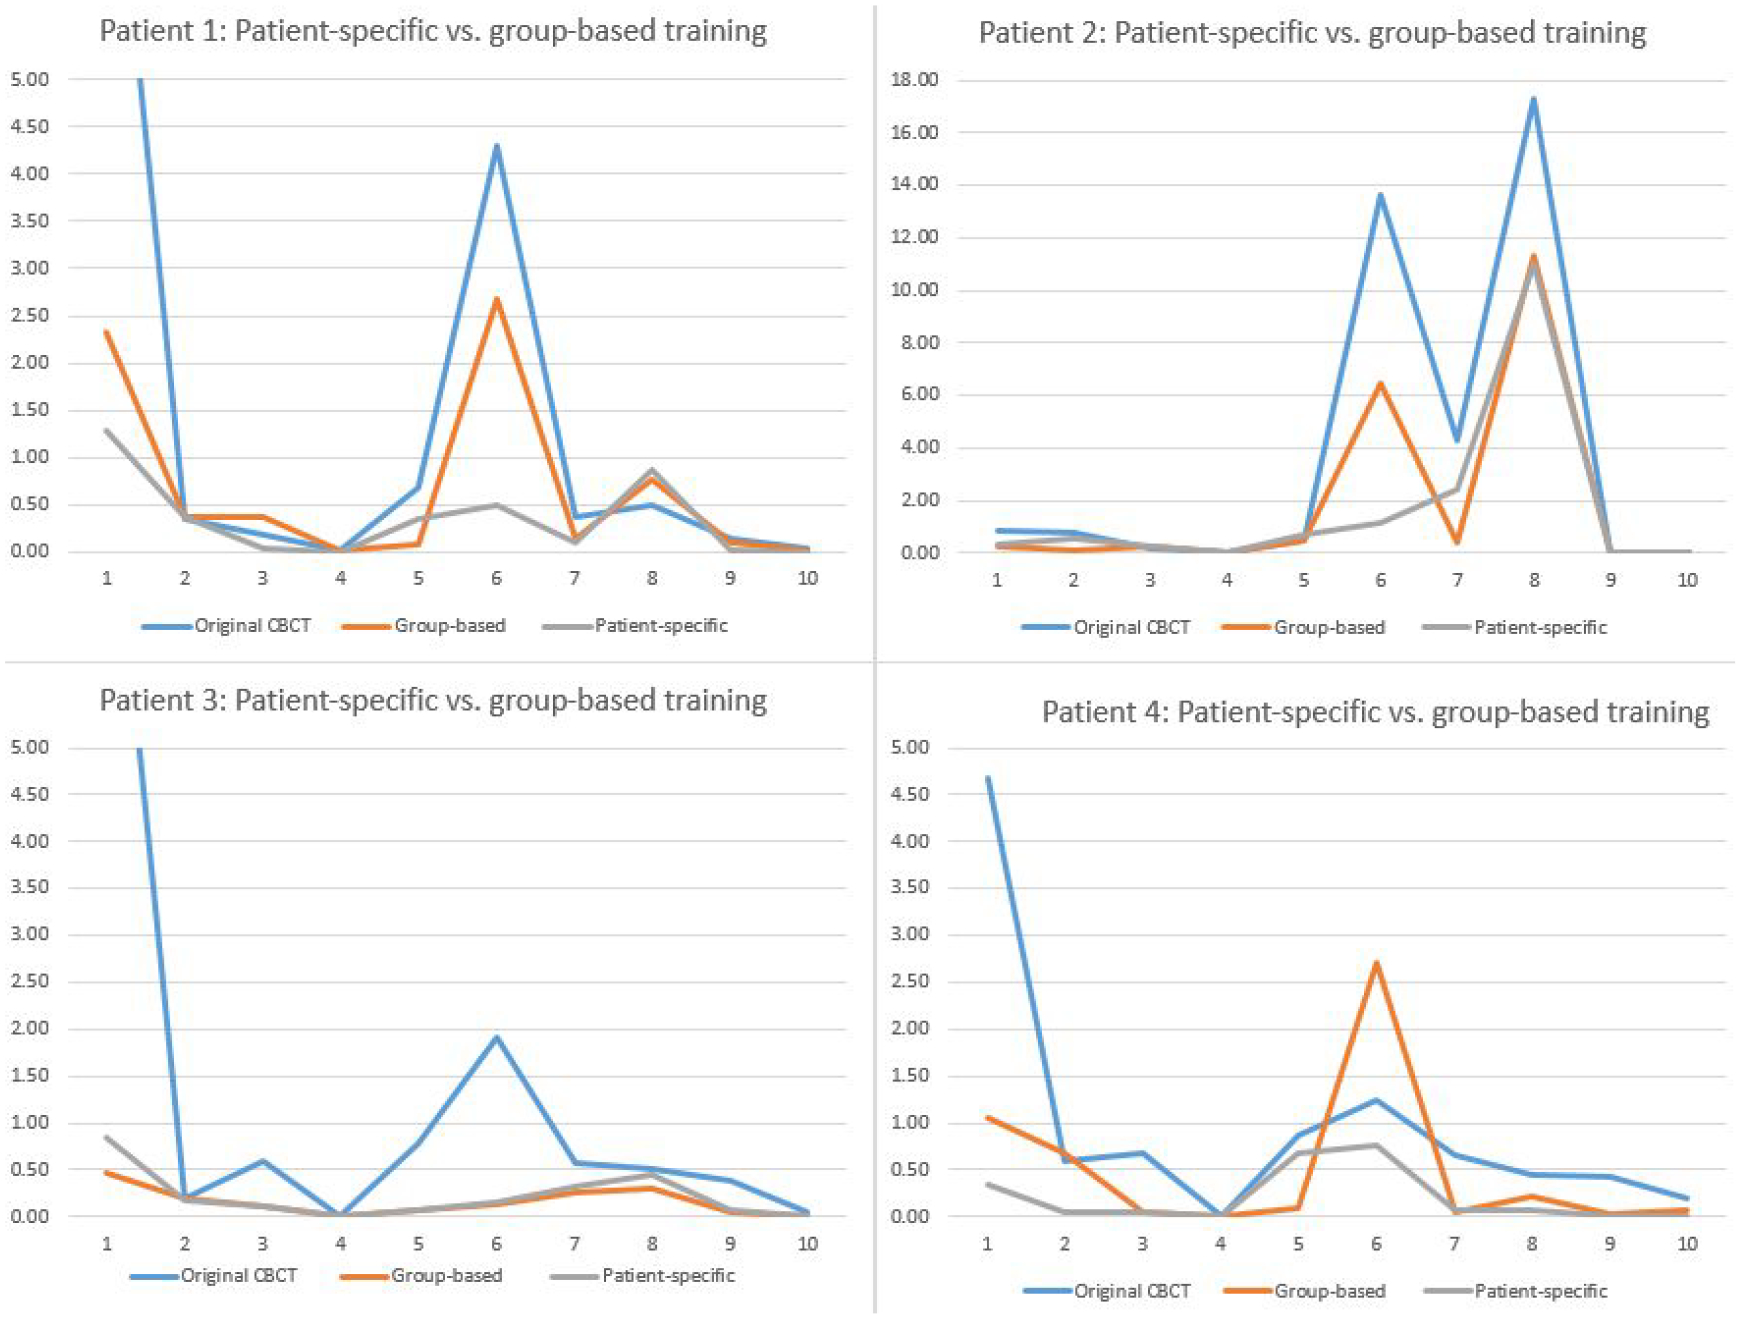
Comparison of feature errors in original and enhanced CBCTs. Feature 1–10 are: 1. median, 2. GLCM cluster shade, 3. LLH range, 4. LHL total energy, 5. HLL skewness, 6. LLL max, 7. LoG 3mm skewness, 8. LoG 5mm skewness, 9. LoG 3mm GLCM inverse difference, and 10. LoG 5mm GLRLM short-run emphasis.
Figure 6 presents results of all low-level features of patient 3 as an example and other patients have similar results. In the plot, all 86 low-level features were extracted from one phase of the original 4D-CBCT, the enhanced 4D-CBCT by the group-based and the patient-specific models. The first 18 features are all first-order features, while features 19 to 86 are texture features. Figure 6 shows that the patient-specific model could further reduce the radiomics errors in the 4D-CBCT enhanced by the group-based model. For example, feature 53, 76, 81 have larger errors after group-based enhancement, but the patient-specific model has relatively smaller errors.
Figure 6.
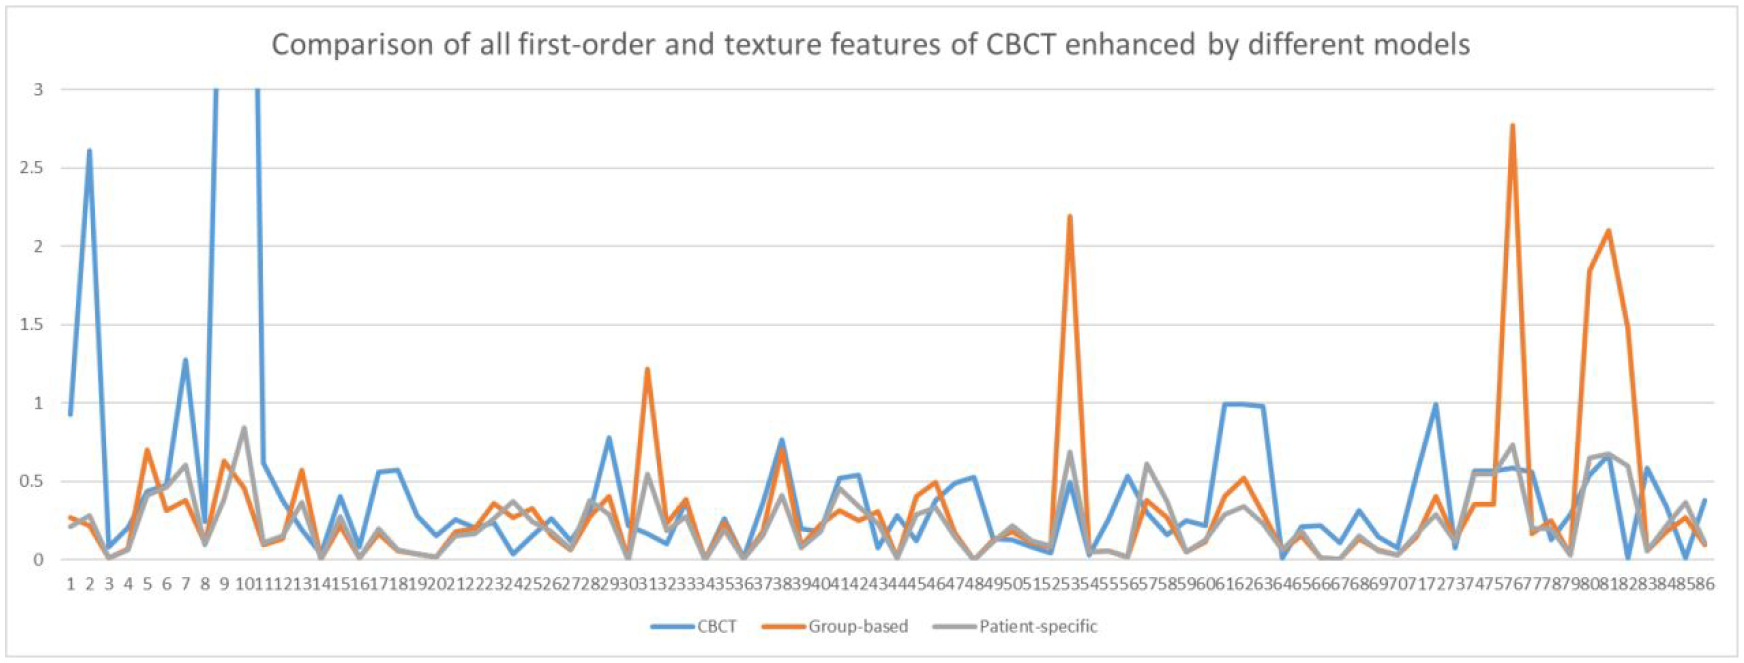
Comparison of errors of low-level features in the original CBCT and CBCT enhanced by group-based and patient-specific models in patient 3.
3.3. Impact of model dimensionality
Table 3 shows the radiomic features errors in the original CBCT and enhanced CBCT by the 2D and 3D deep learning models. The purpose of this section is to further investigate if a 3-dimension convolution layer could further improve the radiomic feature accuracy. Thus, the 2D model uses the original 2D pix2pix model architecture with the whole-body image difference as the loss function, and the 3D model uses a 3D convolution layer instead of with the whole-body image difference calculated from 3D volumes. From the results, both models reduced errors of most of the features and the results are comparable. Figure 7 also shows that the two enhancement models have similar results across all features.
Table 3.
Comparison between 2D and 3D patient-specific models. Green columns highlight features extracted from the 3D model that have improvements over the 2D model.
| ID | patient | 1. Median | 2. Glcm clustershade | 3. LLH range | 4. LHL totalenergy | 5. HLL skewness | 6. LLL max | 7. LoG 3mm skewness | 8. LoG 5mm skewness | 9. LoG 3mm glcm inverse difference | 10. LoG 5mm rlgl short run emphasis |
|---|---|---|---|---|---|---|---|---|---|---|---|
| 1 | Original CBCT | 8.51 | 0.35 | 0.19 | 0.01 | 0.68 | 4.29 | 0.37 | 0.50 | 0.14 | 0.03 |
| 2D | 1.31 | 0.26 | 0.16 | 0.01 | 0.01 | 0.37 | 0.19 | 0.59 | 0.03 | 0.00 | |
| 3D | 0.52 | 0.23 | 0.16 | 0.01 | 0.23 | 0.56 | 0.38 | 0.06 | 0.10 | 0.01 | |
| 2 | Original CBCT | 0.85 | 0.75 | 0.16 | 0.01 | 0.43 | 13.61 | 4.29 | 17.29 | 0.02 | 0.02 |
| 2D | 0.09 | 0.26 | 0.05 | 0.01 | 0.22 | 1.09 | 2.22 | 5.00 | 0.11 | 0.01 | |
| 3D | 0.32 | 0.31 | 0.20 | 0.01 | 0.46 | 0.02 | 1.27 | 6.20 | 0.02 | 0.01 | |
| 3 | Original CBCT | 8.49 | 0.20 | 0.60 | 0.00 | 0.78 | 1.91 | 0.58 | 0.52 | 0.39 | 0.04 |
| 2D | 1.10 | 0.09 | 0.03 | 0.00 | 0.05 | 0.36 | 0.11 | 0.19 | 0.01 | 0.01 | |
| 3D | 0.11 | 0.01 | 0.18 | 0.00 | 0.02 | 0.50 | 0.33 | 0.37 | 0.03 | 0.01 | |
| 4 | Original CBCT | 4.68 | 0.59 | 0.68 | 0.00 | 0.86 | 1.25 | 0.66 | 0.44 | 0.43 | 0.18 |
| 2D | 0.05 | 0.42 | 0.08 | 0.00 | 1.14 | 0.68 | 0.19 | 0.09 | 0.02 | 0.02 | |
| 3D | 0.49 | 0.17 | 0.02 | 0.00 | 1.41 | 0.11 | 0.12 | 0.06 | 0.07 | 0.02 |
Figure 7.
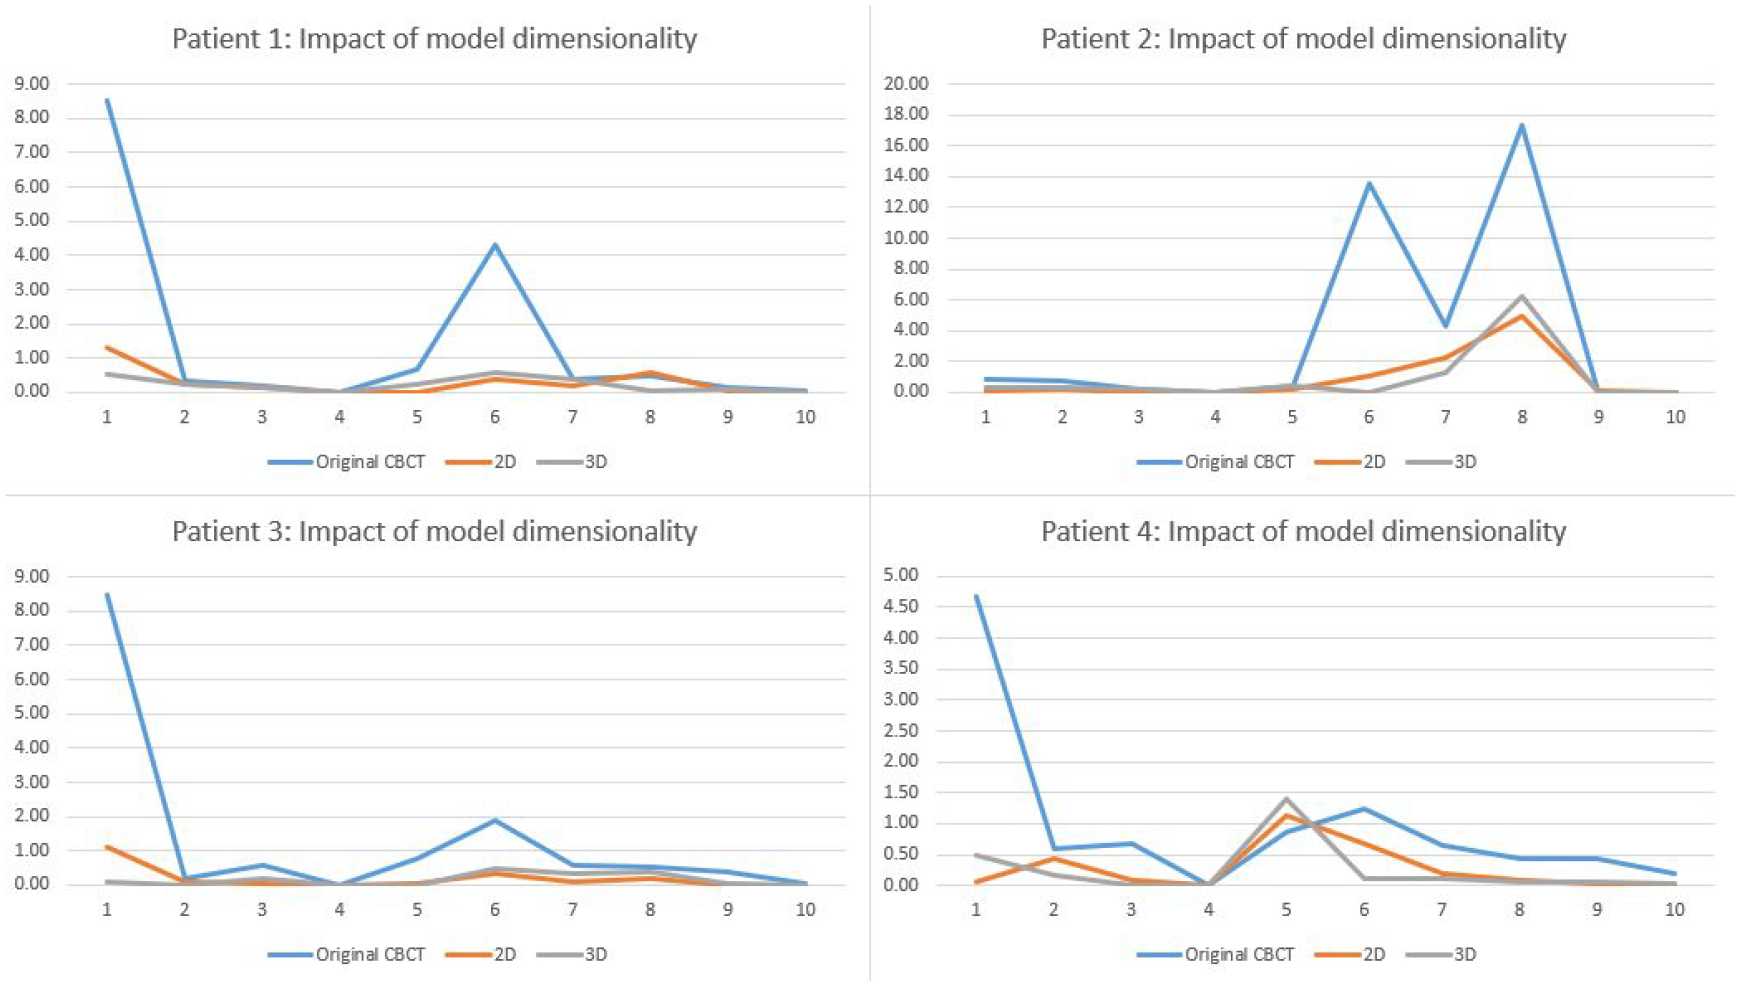
Comparison of 2D and 3D models for reducing the radiomic feature errors.
3.4. Impact of the region of interest selection
Since the radiomics analysis calculates features only in the 3D ROI volume around the tumor, we designed an ROI-based loss, which only computes the pixel value difference inside ROI to train the model to enhance the ROI region specifically. Fig. 8 shows the impact of ROI loss functions for reducing radiomic feature errors in different patients. Table 4 presents radiomics results of original CBCT, enhanced CBCT using the whole-body loss function, the ROI loss function, and combined whole-body and ROI loss function. From the results, the model with only the ROI loss function could not enhance the image well. However, the results improved significantly if we combined the whole-body loss and ROI loss with different weightings. For example, patient 1 feature 6 is improved by the ROI enhancement model from the original 4D-CBCT value from 4.29 to 2.13, and the model with combined loss function further reduced the error to 0.18.
Figure 8.
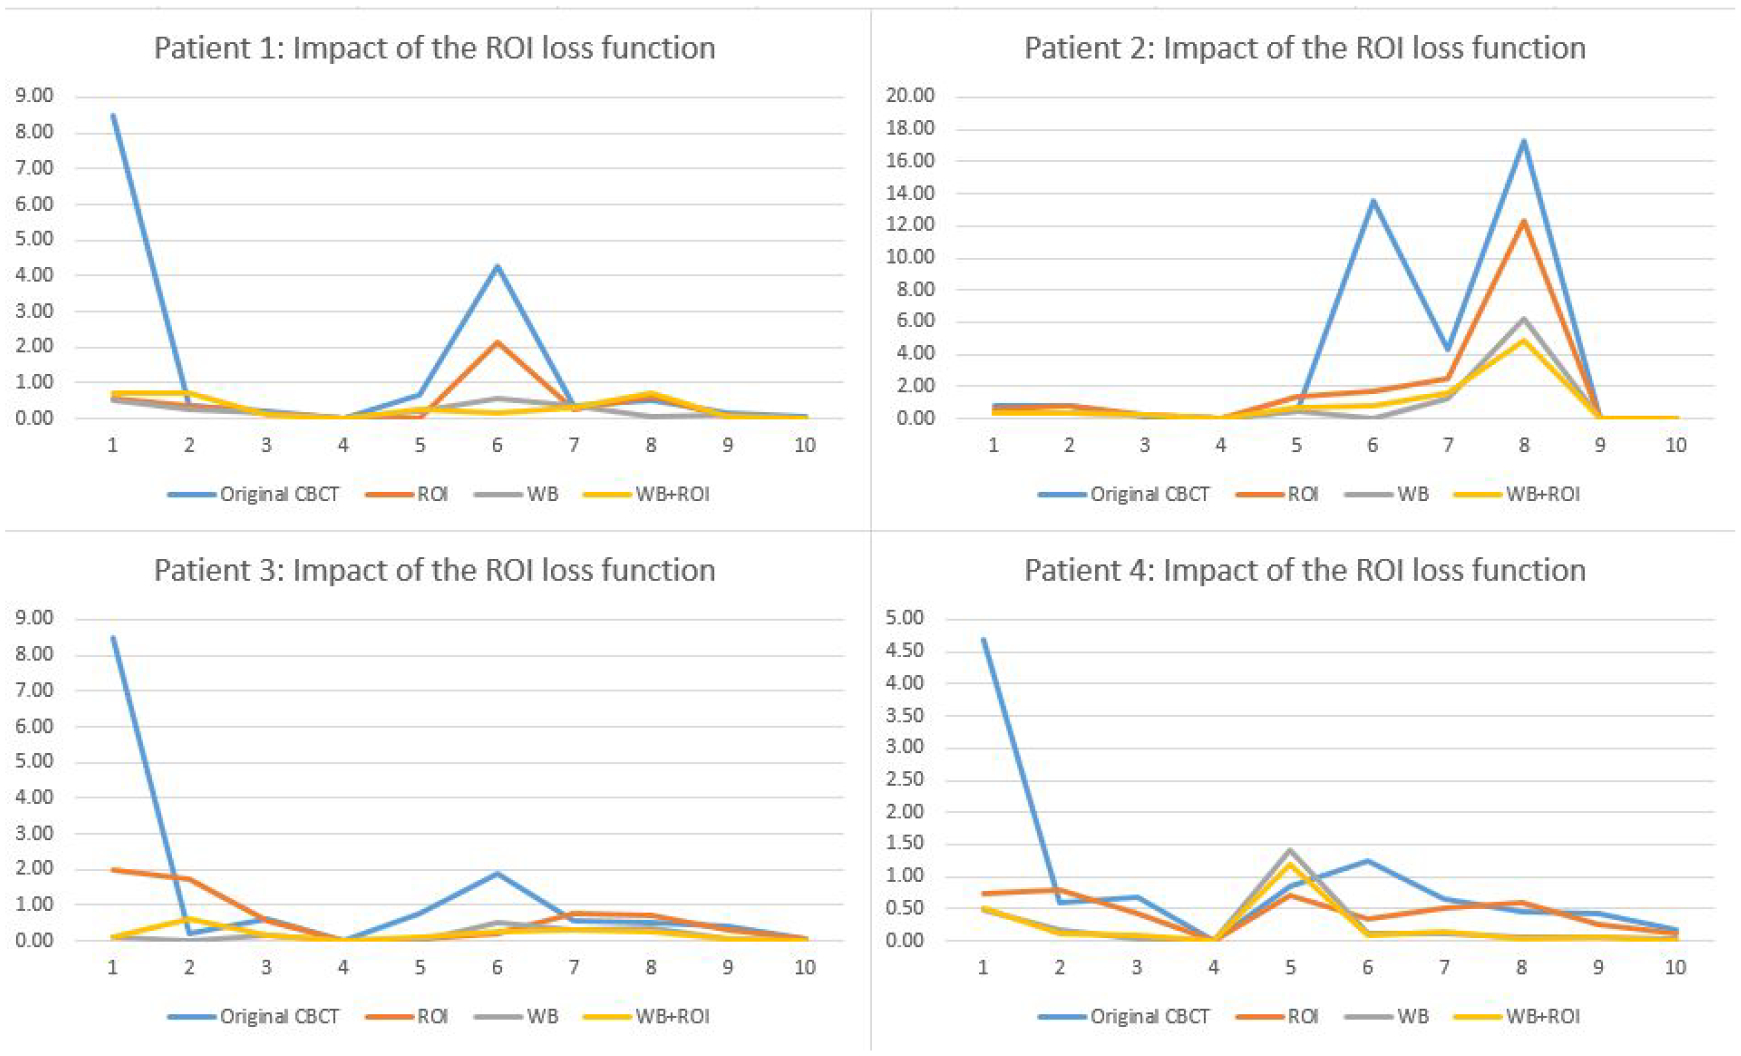
Comparison of the impact of ROI loss functions for reducing the radiomic feature errors.
Table 4.
Comparison between patient-specific models to investigate the impact of ROI loss function. Green columns highlight features extracted from the WB+ROI model that have improvements over WB and ROI models.
| ID | Model | 1. Median | 2. Glcm clustershade | 3. LLH range | 4. LHL totalenergy | 5. HLL skewness | 6. LLL max | 7. LoG 3mm skewness | 8. LoG 5mm skewness | 9. LoG 3mm glcm inverse difference | 10. LoG 5mm rlgl short run emphasis |
|---|---|---|---|---|---|---|---|---|---|---|---|
| 1 | Original CBCT | 8.51 | 0.35 | 0.19 | 0.01 | 0.68 | 4.29 | 0.37 | 0.50 | 0.14 | 0.03 |
| ROI | 0.58 | 0.34 | 0.15 | 0.01 | 0.02 | 2.13 | 0.25 | 0.63 | 0.07 | 0.01 | |
| WB | 0.52 | 0.23 | 0.16 | 0.01 | 0.23 | 0.56 | 0.38 | 0.06 | 0.10 | 0.01 | |
| WB+ROI | 0.71 | 0.73 | 0.08 | 0.01 | 0.26 | 0.18 | 0.29 | 0.73 | 0.04 | 0.01 | |
| 2 | Original CBCT | 0.85 | 0.75 | 0.16 | 0.01 | 0.43 | 13.61 | 4.29 | 17.29 | 0.02 | 0.02 |
| ROI | 0.58 | 0.80 | 0.26 | 0.00 | 1.38 | 1.75 | 2.51 | 12.26 | 0.05 | 0.01 | |
| WB | 0.32 | 0.31 | 0.20 | 0.01 | 0.46 | 0.02 | 1.27 | 6.20 | 0.02 | 0.01 | |
| WB+ROI | 0.37 | 0.39 | 0.23 | 0.01 | 0.65 | 0.83 | 1.64 | 4.91 | 0.03 | 0.01 | |
| 3 | Original CBCT | 8.49 | 0.20 | 0.60 | 0.00 | 0.78 | 1.91 | 0.58 | 0.52 | 0.39 | 0.04 |
| ROI | 1.99 | 1.71 | 0.55 | 0.00 | 0.06 | 0.20 | 0.75 | 0.71 | 0.30 | 0.03 | |
| WB | 0.11 | 0.01 | 0.18 | 0.00 | 0.02 | 0.50 | 0.33 | 0.37 | 0.03 | 0.01 | |
| WB+ROI | 0.13 | 0.61 | 0.17 | 0.00 | 0.10 | 0.28 | 0.30 | 0.27 | 0.05 | 0.01 | |
| 4 | Original CBCT | 4.68 | 0.59 | 0.68 | 0.00 | 0.86 | 1.25 | 0.66 | 0.44 | 0.43 | 0.18 |
| ROI | 0.74 | 0.80 | 0.44 | 0.00 | 0.70 | 0.35 | 0.50 | 0.59 | 0.25 | 0.13 | |
| WB | 0.49 | 0.17 | 0.02 | 0.00 | 1.41 | 0.11 | 0.12 | 0.06 | 0.07 | 0.02 | |
| WB+ROI | 0.51 | 0.10 | 0.10 | 0.00 | 1.20 | 0.09 | 0.13 | 0.02 | 0.07 | 0.00 |
3.5. Impact of loss functions
Fig. 9 shows impact of loss functions for reducing radiomic feature errors. Table 5 compared radiomics errors of selected features extracted from original 4D-CBCT images and different enhanced 4D-CBCT images. In the table, the two models were trained by different loss functions. The first model was trained by the whole image L1 loss and ROI L1 loss, and the second model was trained by adding two additional loss functions, VGG loss, and GAN adversarial loss. From the table, both models reduced the radiomic feature errors for different features and the degree of improvement is feature dependent. In general, the two models achieved comparable performance.
Figure 9.
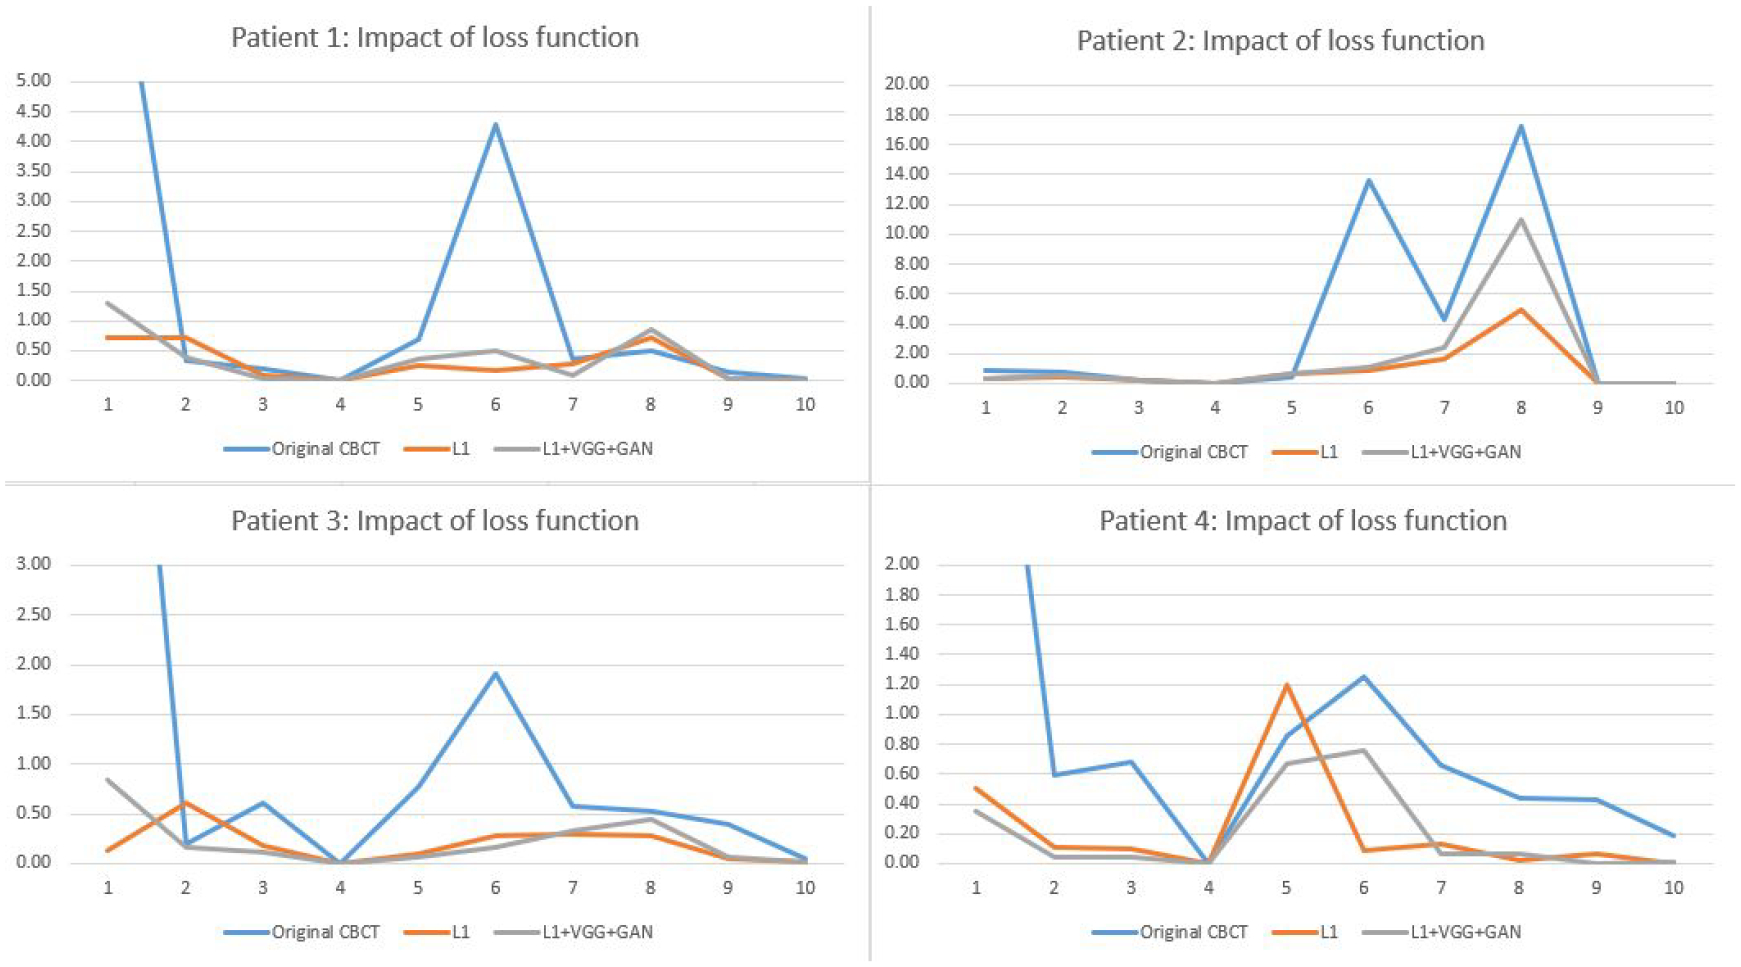
Comparison of L1, VGG, and GAN loss functions for reducing the radiomic feature errors.
Table 5.
Comparison of patient-specific models with different loss functions. Green columns highlight features of the L1+VGG+GAN model that have improvements over the L1 model.
| ID | Model | 1. Median | 2. Glcm clustershade | 3. LLH range | 4. LHL totalenergy | 5. HLL skewness | 6. LLL max | 7. LoG 3mm skewness | 8. LoG 5mm skewness | 9. LoG 3mm glcm inverse difference | 10. LoG 5mm rlgl short run emphasis |
|---|---|---|---|---|---|---|---|---|---|---|---|
| 1 | Original CBCT | 8.51 | 0.35 | 0.19 | 0.01 | 0.68 | 4.29 | 0.37 | 0.50 | 0.14 | 0.03 |
| L1 | 0.71 | 0.73 | 0.08 | 0.01 | 0.26 | 0.18 | 0.29 | 0.73 | 0.04 | 0.01 | |
| L1+VGG+GAN | 1.30 | 0.38 | 0.03 | 0.01 | 0.35 | 0.50 | 0.10 | 0.86 | 0.03 | 0.01 | |
| 2 | Original CBCT | 0.85 | 0.75 | 0.16 | 0.01 | 0.43 | 13.61 | 4.29 | 17.29 | 0.02 | 0.02 |
| L1 | 0.37 | 0.39 | 0.23 | 0.01 | 0.65 | 0.83 | 1.64 | 4.91 | 0.03 | 0.01 | |
| L1+VGG+GAN | 0.32 | 0.52 | 0.23 | 0.01 | 0.70 | 1.14 | 2.42 | 10.99 | 0.03 | 0.01 | |
| 3 | Original CBCT | 8.49 | 0.20 | 0.60 | 0.00 | 0.78 | 1.91 | 0.58 | 0.52 | 0.39 | 0.04 |
| L1 | 0.13 | 0.61 | 0.17 | 0.00 | 0.10 | 0.28 | 0.30 | 0.27 | 0.05 | 0.01 | |
| L1+VGG+GAN | 0.85 | 0.16 | 0.11 | 0.00 | 0.07 | 0.16 | 0.33 | 0.45 | 0.06 | 0.01 | |
| 4 | Original CBCT | 4.68 | 0.59 | 0.68 | 0.00 | 0.86 | 1.25 | 0.66 | 0.44 | 0.43 | 0.18 |
| L1 | 0.51 | 0.10 | 0.10 | 0.00 | 1.20 | 0.09 | 0.13 | 0.02 | 0.07 | 0.00 | |
| L1+VGG+GAN | 0.35 | 0.05 | 0.05 | 0.00 | 0.67 | 0.75 | 0.07 | 0.07 | 0.00 | 0.01 |
4. Discussion
Radiomic features have been widely used for patient diagnosis and outcome prediction since they are able to reveal characteristics of the tumor that are hard to be discovered by human eyes. However, there are increasing concerns about the robustness and reproducibility of radiomic features considering the variations in the qualities of images used to extract radiomic features. For example, the same patient with different reconstruction kernels, acquisition parameters, or image thickness could cause large variations of features (Park et al., 2019) (Fave et al., 2015). In this study, we have shown that the 4D-CBCT images after enhancement had better image quality with the noise and artifacts reduced. Consequently, the 4D-CBCT radiomics accuracy was improved, which can potentially improve the outcome prediction based on radiomic features.
In our previous work, we developed the group-based 4D-CBCT enhancement model (Zhang et al., 2021), which was trained by 4D-CT and 4D-CBCT images from ten different patients. The study demonstrated the efficacy of using deep learning to enhance 4D-CBCT images to improve the accuracy and robustness of radiomic features. Due to the different patient sizes, artifacts, breathing patterns and anatomy structures across patients, the model trained by a group of patients could only reduce artifacts and noise that are in common among these patients and cannot address the artifacts specific to individual patients. Therefore, the enhancement by the group-based model may not be optimal for the individual patient due to inter-patient variations. From the results of this study, the patient-specific model optimized for individual patients outperformed the group-based model, especially for the radiomic features that had large errors in the group-based model, and in general for all the low-level features.
Another aim of this study is to investigate the impact of the model architecture on the performance of the deep learning model for 4D-CBCT enhancement for radiomic analysis. Many real-world applications of deep learning models require 2D images as input and output for classification, detection, or super-resolution. However, CT images are 3D volumes that contain inter-slice information of the body. Thus, we implemented both a 2D pix2pix model and a 3D pix2pix model with the same loss function for comparison. For the 2D model, we preprocessed the CT and CBCT volumes into slices and used each slice for input and output. For the 3D model, the entire volume containing the tumor is used for the 3D pix2pix model and the convolution layers are updated to 3D. Even though Results obtained from the 2D and 3D models are comparable, utilizing the 3D model for enhancement is more consistent with the radiomics extraction process, because the radiomic features were defined and extracted from the 3D tumor volume instead of 2D slices.
We also investigated the impact of ROI selection for reducing the 4D-CBCT radiomics errors. Three different models with a loss function in different regions are tested: L1 loss of the ROI, L1 loss of the whole image, and a combination of the two. The results show that the model with the combined loss function achieves better results. This is likely because the artifacts inside the tumor are also related to the anatomical structures outside the tumor, such as streak artifacts that originated from high contrast structures close to the tumor. Thus, incorporating the whole body in the loss function can help correct the artifacts outside the ROI, which can, in turn, benefit the artifact correction in the ROI.
In addition, we implemented two models with different loss functions. One model uses the L1 loss function while the other model uses the L1, VGG, and GAN loss functions. Though the VGG and GAN loss could further enhance the high-frequency details of these images, the overall effect on radiomics analysis is not significant and the enhancement results are comparable. It might be due to the extra noise introduced by the VGG and GAN loss.
Furthermore, two different radiomic feature extraction software were compared in this study: pyradiomics and Matlab radiomics (Vallières et al., 2015). We extracted the radiomic features from the same patient by these two different types of software and compared the equations used for the computation. The results show that the feature values have discrepancies for different software. These could be caused by the different feature definition and calculation steps of the two software. Thus, it is very important for researchers to use the same radiomics software from start to end and use the same parameters such as voxel size, bin number, and normalization method to keep results consistent through the analysis process.
Moreover, we think training the model for each patient is still feasible in practice for the following reasons. The whole training process can be automated to minimize any human intervention needed to maintain the smoothness of the workflow. The data augmentation and model training time is typically around 30 hours. Since there is usually one week between the CT scan and the patient treatment with CBCT scan, there is sufficient time to train the model to get it ready for CBCT enhancement. The testing time for each specific patient is less than 1 second per slice. Training a deep learning model does require a high-performance GPU card, which should be affordable in most clinics due to its modest cost (~5k). Overall, we think there is no major hurdle preventing the implementation of patient-specific models.
The current work serves as a pilot study to demonstrate the efficacy of developing a patient-specific deep learning model to enhance CBCT image quality for radiomics analysis. We used CBCT simulated from CT to evaluate the model because in this way the CT images can serve as the ground truth to evaluate the accuracy of radiomic features in CBCT. We agree that further studies are warranted to investigate the efficacy of the model to improve real CBCT images. However, a major challenge for testing on real CBCT is the lack of ground truth images. Patient prior CT images acquired for treatment planning will have geometric mismatches from CBCT due to deformation and breathing changes. Even if deformable registration is used to correct this, there will always be residual mismatches causing the discrepancy between radiomic features in CT and CBCT. Besides, since the CT and CBCT are acquired on different days, there can be changes of radiomic feature values from CT to CBCT simply due to tumor progression or regression over the time period. Therefore, the difference between CT and real CBCT radiomic features can be caused by the geometric mismatch or the tumor change instead of image quality difference, and thus CT cannot be reliably used as the ground truth to evaluate the accuracy of radiomic features in real CBCT. One limitation of the current work is that it solely focuses on developing a patient-specific model to address the under-sampling artifacts in 4D-CBCT to minimize its impact on radiomic features. Other artifacts caused by noise or scattering were not investigated in this study. Future studies are warranted to further expand its application to address the scatter artifacts and noise in CBCT. One potential option to tackle this challenge is to use Monte Carlo to simulate more realistic CBCT from CT accounting for scatter, noise, beam hardening, detector response, etc. In this way, the CT can be used as the ground truth to evaluate CBCT. Given the significant developments needed to build and validate the Monte Carlo model, we would have to report this evaluation in future studies.
The patient-specific model can be slightly worse than the group-based model for some cases when the group-based model already reduced the radiomic feature error to very small, e.g. <0.5. We think this slight degradation of feature accuracy could be caused by the discrepancy between the L1 loss function used in the Pix2Pix deep model training and the specific radiomic feature metrics used to evaluate the image in model testing. In other words, the model was trained to enhance the images to improve their accuracy defined by the L1 loss from the ground truth, while the model was tested to enhance the images to improve their accuracy defined by the various radiomic features. So there is a discrepancy between the evaluation metrics used for model training and testing. This discrepancy can lead to uncertainties in the model performance. For features with small errors in the group-based model, there is little room for the patient-specific model to improve, and the uncertainties in the model performance can become dominant, leading to slightly larger error in some features for the patient-specific model. It’s unclear if such slight degradation of features with small errors is clinically significant. In the future, we will investigate different loss functions in the model training that are consistent with different radiomic features. A feature-specific deep learning model can be trained using a loss function closely correlated to a specific feature to enhance the images to achieve the best accuracy for the feature.
5. Conclusion
In this study, we investigated the feasibility of using patient-specific deep learning models to further enhance the accuracy of 4D-CBCT images for radiomic analysis. Our results showed that the patient-specific model outperformed the previous group-based model in improving the accuracy of radiomic features derived from 4D-CBCT, especially for the low order features. This pilot study demonstrated the potential benefit of optimizing the deep learning model for individual patients for radiomics studies for the first time. In the future, feature correlated loss functions can be explored to train the deep learning model to achieve feature-specific enhancement for individual patients to further enhance the precision of radiomics analysis, which can lead to more accurate treatment assessment or outcome prediction for radiation therapy patients.
Acknowledgement
This work was supported by the National Institutes of Health under Grant No. R01-CA184173 and R01-EB028324.
Footnotes
Ethical Statements
All patient data included in this study are anonymized. Patient data are acquired from the public TCIA 4D-Lung Dataset (https://wiki.cancerimagingarchive.net/display/Public/4D-Lung) and SPARE challenge dataset (https://image-x.sydney.edu.au/spare-challenge/).
References
- Chen Y, Yin F-F, Zhang Y, Zhang Y and Ren L 2018. Low dose CBCT reconstruction via prior contour based total variation (PCTV) regularization: a feasibility study Physics in Medicine & Biology 63 085014. [DOI] [PMC free article] [PubMed] [Google Scholar]
- Chen Y, Yin F-F, Zhang Y, Zhang Y and Ren L 2019. Low dose cone-beam computed tomography reconstruction via hybrid prior contour based total variation regularization (hybrid-PCTV) Quantitative imaging in medicine and surgery 9 1214. [DOI] [PMC free article] [PubMed] [Google Scholar]
- Fave X, Mackin D, Yang J, Zhang J, Fried D, Balter P, Followill D, Gomez D, Kyle Jones A and Stingo F 2015. Can radiomics features be reproducibly measured from CBCT images for patients with non-small cell lung cancer? Medical physics 42 6784–97 [DOI] [PMC free article] [PubMed] [Google Scholar]
- Feldkamp LA, Davis LC and Kress JW 1984. Practical cone-beam algorithm Josa a 1 612–9 [Google Scholar]
- Ganeshan B, Panayiotou E, Burnand K, Dizdarevic S and Miles K 2012. Tumour heterogeneity in non-small cell lung carcinoma assessed by CT texture analysis: a potential marker of survival European radiology 22 796–802 [DOI] [PubMed] [Google Scholar]
- Gillies RJ, Kinahan PE and Hricak H 2016. Radiomics: images are more than pictures, they are data Radiology 278 563–77 [DOI] [PMC free article] [PubMed] [Google Scholar]
- Goch CJ, Metzger J and Nolden M 2017. Bildverarbeitung für die Medizin 2017: Springer; ) pp 305- [Google Scholar]
- He K, Zhang X, Ren S and Sun J Proceedings of the IEEE conference on computer vision and pattern recognition,2016), vol. Series) pp 770–8 [Google Scholar]
- Huynh E, Coroller TP, Narayan V, Agrawal V, Hou Y, Romano J, Franco I, Mak RH and Aerts HJ 2016. CT-based radiomic analysis of stereotactic body radiation therapy patients with lung cancer Radiotherapy and Oncology 120 258–66 [DOI] [PubMed] [Google Scholar]
- Isola P, Zhu J-Y, Zhou T and Efros A A Proceedings of the IEEE conference on computer vision and pattern recognition,2017), vol. Series) pp 1125–34 [Google Scholar]
- Jia T-Y, Xiong J-F, Li X-Y, Yu W, Xu Z-Y, Cai X-W, Ma J-C, Ren Y-C, Larsson R and Zhang J 2019. Identifying EGFR mutations in lung adenocarcinoma by noninvasive imaging using radiomics features and random forest modeling European radiology 29 4742–50 [DOI] [PubMed] [Google Scholar]
- Jiang Z, Chen Y, Zhang Y, Ge Y, Yin F-F and Ren L 2019. Augmentation of CBCT reconstructed from under-sampled projections using deep learning IEEE transactions on medical imaging 38 2705–15 [DOI] [PMC free article] [PubMed] [Google Scholar]
- Jiang Z, Yin F-F, Ge Y and Ren L 2020. A multi-scale framework with unsupervised joint training of convolutional neural networks for pulmonary deformable image registration Physics in Medicine & Biology 65 015011. [DOI] [PMC free article] [PubMed] [Google Scholar]
- Jiang Z, Yin F-F, Ge Y and Ren L 2021. Enhancing digital tomosynthesis (DTS) for lung radiotherapy guidance using patient-specific deep learning model Physics in Medicine & Biology 66 035009. [DOI] [PMC free article] [PubMed] [Google Scholar]
- Johnson J, Alahi A and Fei-Fei L European conference on computer vision,2016), vol. Series): Springer; ) pp 694–711 [Google Scholar]
- Li M, Yang H and Kudo H 2002. An accurate iterative reconstruction algorithm for sparse objects: application to 3D blood vessel reconstruction from a limited number of projections Physics in Medicine & Biology 47 2599. [DOI] [PubMed] [Google Scholar]
- Li Y, Han G, Wu X, Li ZH, Zhao K, Zhang Z, Liu Z and Liang C 2021. Normalization of multicenter CT radiomics by a generative adversarial network method Physics in Medicine & Biology 66 055030. [DOI] [PubMed] [Google Scholar]
- Park S, Lee SM, Do K-H, Lee J-G, Bae W, Park H, Jung K-H and Seo JB 2019. Deep learning algorithm for reducing CT slice thickness: effect on reproducibility of radiomic features in lung cancer Korean journal of radiology 20 1431–40 [DOI] [PMC free article] [PubMed] [Google Scholar]
- Parmar C, Grossmann P, Bussink J, Lambin P and Aerts H 2015. Machine learning methods for quantitative radiomic biomarkers. Sci Rep 5: 13087. [DOI] [PMC free article] [PubMed] [Google Scholar]
- Ren L, Zhang Y and Yin FF 2014. A limited‐angle intrafraction verification (LIVE) system for radiation therapy Medical physics 41 020701. [DOI] [PubMed] [Google Scholar]
- Rit S, Wolthaus JW, van Herk M and Sonke JJ 2009. On‐the‐fly motion‐compensated cone‐beam CT using an a priori model of the respiratory motion Medical physics 36 2283–96 [DOI] [PubMed] [Google Scholar]
- Shieh CC, Gonzalez Y, Li B, Jia X, Rit S, Mory C, Riblett M, Hugo G, Zhang Y and Jiang Z 2019. SPARE: Sparse ‐ view reconstruction challenge for 4D cone ‐ beam CT from a 1 ‐ min scan Medical physics 46 3799–811 [DOI] [PMC free article] [PubMed] [Google Scholar]
- Vallières M, Freeman CR, Skamene SR and El Naqa I 2015. A radiomics model from joint FDG-PET and MRI texture features for the prediction of lung metastases in soft-tissue sarcomas of the extremities Physics in Medicine & Biology 60 5471. [DOI] [PubMed] [Google Scholar]
- Van Griethuysen J J, Fedorov A, Parmar C, Hosny A, Aucoin N, Narayan V, Beets-Tan RG, Fillion-Robin J-C, Pieper S and Aerts HJ 2017. Computational radiomics system to decode the radiographic phenotype Cancer research 77 e104–e7 [DOI] [PMC free article] [PubMed] [Google Scholar]
- Wang X, Yu K, Wu S, Gu J, Liu Y, Dong C, Qiao Y and Change Loy C Proceedings of the European conference on computer vision (ECCV) workshops,2018), vol. Series) pp 0- [Google Scholar]
- Zhang Z, Huang M, Jiang Z, Chang Y, Torok J, Yin F-F and Ren L 2021. 4D radiomics: impact of 4D-CBCT image quality on radiomic analysis Physics in Medicine & Biology 66 045023. [DOI] [PMC free article] [PubMed] [Google Scholar]
- Zhu X, Dong D, Chen Z, Fang M, Zhang L, Song J, Yu D, Zang Y, Liu Z and Shi J 2018. Radiomic signature as a diagnostic factor for histologic subtype classification of non-small cell lung cancer European radiology 28 2772–8 [DOI] [PubMed] [Google Scholar]


