Abstract
Our previous report(s) demonstrated that piezoelectric disc fabricated diatom solar panels worked as micro resonating devices. Such devices have potential to harvest oils from living diatom cultures. However, it is observed that the collection and separation of oil from culture media using these devices are found to be difficult due to the presence of both living and dead diatom cells, which simultaneously get collected during this process. In this study we made a highly biocompatible nanosponge using TiO2 nanoparticle doped polydimethylsiloxane (PDMS) and Luffa cylindrica. Such hybrid nanosponge selectively absorbs and desorbs oil on exposure to ultraviolet light. The fabricated PDMS-Luffa-TiO2 nanosponge was characterized by Fourier transform infrared spectroscopy, scanning electron microscopy and atomic force microscopy to show the surface characteristics and affinity of nanoparticles to the membranous structure of PDMS-Luffa. A maximum 38% oil absorption was found in PDMS-Luffa-TiO2 nanosponge which was almost double that of sponges made up of PDMS (19%), PDMS-Luffa (18%) and PDMS-TiO2 coated (24%). Thus PDMS-Luffa-TiO2 nanosponge serves as a selective and recyclable oil absorption membranous structure. Furthermore, this hybrid nanosponge exhibited excellent recyclability by repeated absorption–desorption processes on exposure to UV light.
Our previous report(s) demonstrated that piezoelectric disc fabricated diatom solar panels worked as micro resonating devices.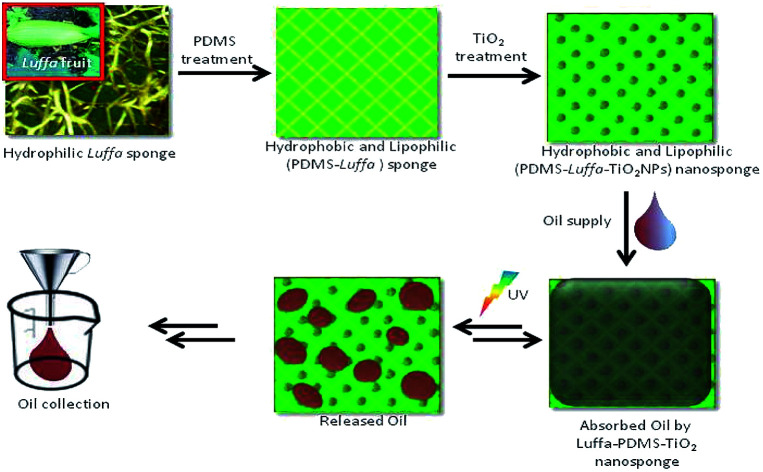
Introduction
The eventual depletion of non-renewable fossil fuels has directed mankind's interest towards developing ways of efficiently producing biofuel.1 However, cost of biofuel production is high because it utilizes extraction and crushing procedures that themselves require a substantial energy input.2 Since demand for energy has increased with increasing industrialization, dependence on petroleum products being imported has seen alternate production of biofuel from renewable energy resources.3 Among renewable energy resources microalgae produces almost 10 times more oil than crop plants.4 In recent years, microalgae have emerged as potential feedstocks for biofuel production and among microalgae, diatoms are most promising. They offer several advantages over agricultural crops for biofuel production as diatoms diminish competition between biofuel and agricultural production for the source materials.5
A geological survey says that 30% of the crude oil is believed to come from diatoms.6 Mass production of oil from these microalgae at commercial level employs photobioreactors (PBRs), both open and closed types which grows microalgae at massive scale for the production of high and low value metabolites (HVMs and LVMs).7,8 However, most of the commercial photobioreactors (PBRs) are expensive and have limitations like short life of batteries employed to run these PBRs. Even though many promising PBRs have emerged in terms of total yield of HVMs and LVMs, the techniques employed to obtain oil from microalgae are mostly insufficient for obtaining maximum yields.9,10 In recent past we have identified a diatom strain Diadesmis confervacea which oozes high amount of oil via its naturally oozing properties on attaining maturity.11 Though spontaneous oozing of oil greatly reduces effort to harvest oil using different techniques like pulse electric field, ultrasonics and centrifugation but separation and collection of clean oil from PBRs is still a challenge. Harvesting oil from diatoms is a cumbersome process due to their rigid and tough silica cell walls.12,13 Therefore, in our earlier work we fabricated a microfluidic resonating device for diatoms called Diatom Solar Panels (DSP) which resonates at 250 kHz frequency at static voltage of 500 mV to put a mechanical stress of 750 μN enough to press the tough silica walls of diatoms letting them oil ooze without cell lysis.14,15 Even though harvesting of oil either from diatoms at economical price is being worked on, yet one of the other factor which needs to be controlled in PBRs or DSP is the clean separation and collection of oil from PBRs or DSPs.15
Therefore, we demonstrated how magnetite nanoparticles simulated clean separation of oil from living diatoms under the influence of magnetic field.16 However, this time we thought of making a hybrid nanosponge device which not only helps in clean separation and collection of oil in DSP but also desorbs oil on exposure to UV light. To shoot down the oil production cost in DSP, we have fabricated a TiO2 nanoparticle doped hydrophobic polydimethylsiloxane (PDMS)-Luffa nanosponge for continuous and cost effective separation of oil from diatom culture. This complex nanosponge displayed a 3-D microcellular porus structure, allows light to pass through it and gives immense binding properties with inorganic materials like TauiO2. El-Roz et al. has fabricated TiO2Luffa sponge for photocatalytic purpose, a way towards green photocatalyst for purification of oil and water.17 TiO2 besides having vast applications in nanomaterials for self cleaning surfaces, semiconductor anodes and photocatalysts etc. also has excellent binding properties with supporting medium like zeolite,18 SiO2 beads,19 steel,20 pumice,21 biomembranes,22 and aluminium.23 TiO2 nanoparticles on the other hand have limitations as they are inflammatory, non environment friendly and may lead to cytotoxicity.24,25 However, immobilization of TiO2 on a supporting medium reduces its direct exposure to the environment. The photocatalytic property of TiO2 simultaneously helps in absorption and desorption of oil on exposure to UV light and which may used in PBRs or DSPs. Even though there are other photocatalytic substances too, such as ZnO and SnO2 but TiO2 has no harmful effect on the living microalgal cell culture hence nontoxic to diatoms.26 PDMS is an important polymeric material used in this study exhibit excellent characteristics like high oleophilicity, hydrophobicity and stability.27,28 Furthermore, it display low surface tension and high compressibility as it completely retains original shape even after 50 cycles of 90% mechanical strain thus exhibited remarkable recyclability.29 In this study we tried to fabricate a complex nanosponge of PDMS-Luffa-TiO2 nanosponge for possible separation of clean oil from water followed by its desorption on exposure to UV light.
Materials and method
Polydimethylsiloxane hydride (PDMS) prepolymer, curing agent (Sylgard 184), dimethyl sulphoxide (DMSO) (99.9%), vanillin (99%) and linseed oil (47559U) were bought from Sigma-Aldrich (St. Louis, MO, USA). PDMS was supplied as a two part kit having pre-polymer (base) and cross linker (curing agent). o-Phosphoric acid (85%) was obtained from Fisher Scientific, India. Luffa cylindrica was obtained from gardens of Dr Harisingh Gour Central University, Sagar, Madhya Pradesh, India. Other chemicals and reagents were of analytical grade and used without any further purification.
Treatment of Luffa fibre
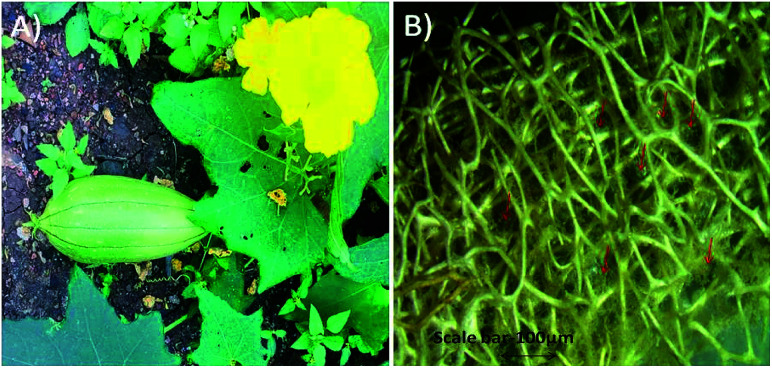
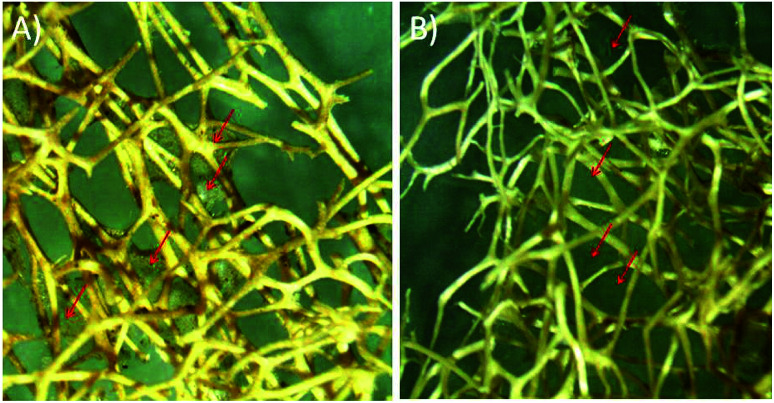
Fibre of Luffa cylindrica (Fig. 1) used in this study was first cleaned with Milli-Q water and dried at room temperature. Clean fibre was immersed in 4.0 N sodium hydroxide (NaOH) for 48 h and then washed 3–4 times with Milli-Q water. After drying, Luffa fibre was treated with dimethyl sulphoxide (DMSO) for overnight and again washed with Milli-Q water and finally dried at room temperature. Sodium hydroxide treatment confiscates waxy and gummy substances as well as de-lignifies Luffa fibre to make it soft and smooth after 24 h and 48 h as shown in stereomicroscopic image in Fig. 2A and B.
Fig. 1. (A) Luffa cylindrica fruit growing on soil, (B) stereomicroscopic image of skin peeled Luffa fibre.
Fig. 2. Optical micrograph of Luffa cylindrica (A) alkali treatment for 24 h and (B) 48 h.
Fabrication of PDMS sponge
PDMS (Sylgard 184) has two kits a prepolymer base and cross linker which is heat curable. Porous structure of PDMS sponge was prepared by sugar templating method according to the procedure described by Sung-Jin et al. with some modifications.30 Fine particles of sugar was made by grinding in mortar and pastel, poured on Petri dish and kept in a vacuum chamber to degassed. PDMS prepolymer and cross linker was mixed separately in the ratio of 10 : 1 as per manufacturer's recommendations and degassed in a similar way as mentioned above. This mixture was poured over the sugar template into Petri dish and left for some time at room temperature to allow PDMS fully permeate into sugar via capillary action. Sugar and PDMS mixture was then cured at 120 °C for 15 min in a hot air oven. After cooling, PDMS sponges were removed from the Petri dish, placed in boiling water for 10–15 min and finally sonicated to dissolve away sugar molecules. After complete removal of sugar, a three dimensional microporous PDMS sponges were obtained as shown in ESI Fig. S1† which was dried at room temperature and kept in desiccators for further use.
Preparation PDMS-Luffa sponge
To prepare PDMS-Luffa sponges, desired size (1 × 1 cm) of alkali treated Luffa fibres were sliced and placed in Petri dish. PDMS and curing agent was mixed separately in the ratio as mentioned in previous section and poured over Luffa fibres. PDMS-Luffa fibres were left for some time so that PDMS get absorbed and enter in the pores of the fibres. This PDMS-Luffa sponges were cured at 80 °C for 1 h and then cooled at room temperature (ESI Fig. S2†). Cured PDMS-Luffa sponges were removed from Petri dish and kept in desiccator for further study.
Preparation of PDMS-Luffa-TiO2 nanosponge
TiO2 nanoparticles (TiO2 NPs) used in this study was purchased from Sigma-Aldrich (St. Louis, MO, USA). The reported size of TiO2 NPs was <25 nm, further conformed by Transmission Electron Microscope (TEM) and found to be ∼15–25 nm (ESI Fig. S3†). Doping was carried out by injecting TiO2 NPs into prefabricated PDMS and PDMS-Luffa sponges. NPs solution was prepared by mixing 100 mg TiO2 NPs in 10 mL of dimethylformamide (DMF) and ultrasonicated for 30 min to make homogeneous suspension. NPs was injected with the help of syringe until fully absorbed and then dried at room temperature. This process was repeated three times to get appropriate nanoparticle coated sponges.
FTIR of sponges at different stages
FTIR spectroscopy of native and alkali treated Luffa fibre, PDMS and PDMS-Luffa sponges were performed to determine structural and functional groups. Spectra were recorded in the range of 400 cm−1 to 4000 cm−1 using Bruker Vertex 70, FTIR spectrometer. Samples were grind to make fine powder. Scanning was carried out at 4 cm−1 resolution with speed of 2.5 kHz and 128 scans co-addition. Spectra were smoothed using Savitzky–Golay algorithm to eliminate unwanted noise.
Scanning electron microscopy
Scanning Electron Microscopic (SEM) study was carried out to examine surface morphology of native and alkali treated Luffa fibre, PDMS, PDMS-Luffa sponges and PDMS-Luffa-TiO2 nanosponge. Analysis was done with SEM (Nova NanoSEM 450, USA) at 15 kV accelerating voltage. Samples were coated with gold to make them conductive prior to SEM study.
Atomic force microscopy
Atomic Force Microscopy (AFM) measurements of native and alkali treated Luffa fibre were performed with Innova, ICON analytical equipment, Bruker (USA). Luffa fibre was grind with mortar and pestle to make fine particle and then placed over mica surface followed by imaging. Samples were imaged under tapping mode AFM with the aid of cantilever NSC 12 from MikroMasch, Silicon Nitride Tip using NanoDriveQ version 8 software. The force constant was approximately 2.0 N m−1 at resonant frequency of ∼295 kHz. Imaging was executed at room temperature with a scan speed of 1.5–2.2 lines per s. The data were analysed using nanoscope analysis software.
Contact angle measurement
Contact angle measurements were performed at room temperature to check the hydrophobicity and oliophilicity of water and oil using OCA 15 Plus instrument (Data physics Instruments, Filderstadt, Germany) equipped with automated liquid dispenser and high resolution camera. Contact angle was accessed using sessile drop method. PDMS and PDMS-Luffa sponges were cut into small pieces and stuck on clean microscope slide. The liquid samples were dispensed automatically on the sponge with the help of automated liquid dispenser. Images of the droplets were recorded with high resolution camera at the instant when drops touched surfaces of the sponges. All measurements were made at five different points for each sponge.
Oil estimation and standard curve preparation
Oil was estimated by sulfo-phospho-vanillin (SPV) method taking linseed oil as standard.31
Oil absorption capacity
To determine oil absorption capacity, different stage of sponges were gently immersed in Petri dish having linseed oil at room temperature. After oil absorption, samples were left for few min to drip and then weighed. The oil absorption capacity were calculated from the following given formula.32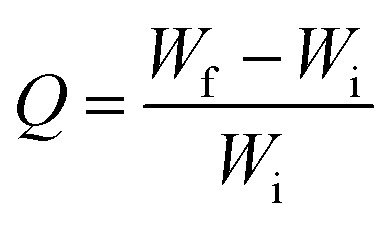 where Q is the absorption capacity of oil, Wi is the initial weight of the sponge without oil and Wf is the final weight of the sponge after oil absorption.
Cleaning of oil from immiscible oil/water mixture
To demonstrate the selective absorption capacity of the sponges, linseed oil was spread on water filled Petri dishes. PDMS-Luffa and PDMS-Luffa-TiO2 nanosponge was placed separately in the Petri plate. Sponges float freely on the oil water mixture and absorb oil making white coloured region along the path of the drifting showing oil removed area. Desorption of oil from PDMS-Luffa-TiO2 nanosponge was carried out by UV-irradiation (wavelength 280–360 nm) with a distance of 10 cm between the UV light source and the specimen.
Results and discussion
Characterization
Microscopic images showed that, Luffa cylindrica fibres after cleaning displayed lack of defined microfibers arrangement in which longitudinal microfibers interlaced with smaller fibres. Non-fibrous part like wax and lignin were spread over the surface of native Luffa cylindrica (Fig. 1B) which gets removed partially after treatment for 24 h (Fig. 2A) and completely after treatment for 48 h (Fig. 2B). Alkali treatment triggers hydrolysis of hemicelluloses and other noncellulosic constituents followed by removal of outer fibre which consequently leads to exposure of inner fibrillar surfaces. It attributes mechanical interlocking due to enhanced fibre roughness and contact area.37,38 Surface roughness and low surface energy of the substance is important for specific wettability.39 The standard PDMS sponge prepared via sugar templating are shown in ESI Fig. S1† exhibit three-dimentional structure. PDMS-Luffa sponge has an open cell structure in which pores were interconnected throughout the sponge to make it porous (ESI Fig. S2B†). These interconnected porous structure are important for oil absorption.
Chemical composition of Luffa are cellulose, hemicelluloses, lignin and ash. The weight percentage of hemicelluloses and lignin varied in different Luffa varieties however, no substantial changes exists in cellulose.33–36 The microporous architecture of Luffa (native and alkali treated), PDMS and PDMS-Luffa-TiO2 nanosponge were characterised by FTIR spectroscopy and different microscopic techniques. FTIR spectroscopy was used to study the chemical composition of cleaned and raw Luffa by analysing the presence followed by changes in the specific and key functional groups before and after treatment. ESI Fig. S4† shows FTIR spectra of native and alkaline treated Luffa fibres, PDMS and PDMS-Luffa sponge in the range of 500 to 4000 cm−1. By comparing native and alkali treated fibres, we found significant spectral differences. The characteristic properties of Luffa fibre is due to cellulose, hemicelluloses and lignin. Absorption peak at 3612 cm−1 in native Luffa can be assigned as axial vibration of cellulose hydroxyl groups. A sharp reduction of this peak was detected in alkali treated Luffa with additional strong absorption peak at 3276 cm−1 represent hydrogen bonded OH groups. The OH bending vibration of water molecules denote absorption at 1693 cm−1, represent hydrophilic characteristic of Luffa.40,41 Absorption peak at 1518 cm−1 in untreated and 1516 cm−1 in treated Luffa sample correspond to C C stretching of aromatic ring.42 The CH2 symmetrical bending vibration of crystalline cellulose is perceived at 1408 cm−1 in native Luffa fibre which get decreased after treatment. Therefore, it is manifested that alkali treatment removes crystalline structure of cellulose.43 The peaks corresponds to 1235 cm−1 in treated fibre ascribed guaiacyl ring breathing with strong C–O and C O stretching in lignin (guaiacyl) and cellulose. Absorption at 1022 cm−1 represents C–O stretching in cellulose and hemicelluloses.44–46 Peaks in the range of 3000–2950 cm−1 region present stretching vibration of C–H in both PDMS and PDMS-Luffa sponges.47,48 Additional absorption peaks at 1011 cm−1 and 786 cm−1 in PDMS and 1012 cm−1 in PDMS-Luffa sponges assigned symmetric stretching vibration of Si–O–Si groups. These spectral changes suggest that hydrophobic PDMS was cross-linked onto the surface of Luffa fibre.49
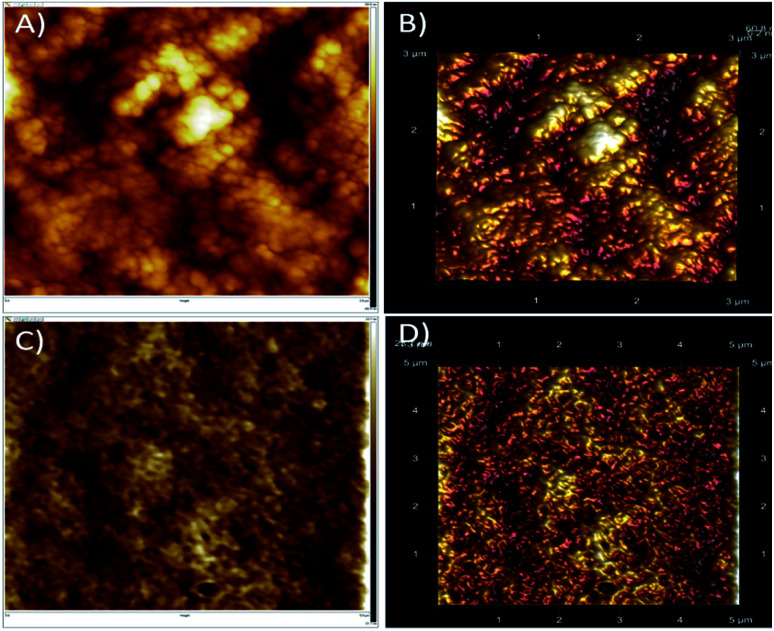
AFM is a high resolution scanning probe microscopic technique used for surface morphology and imaging.50–52 The surface analysis of native and alkali treated Luffa fibre is presented in Fig. 3. Influence of treatment and surface modification of fibres showed that untreated Luffa fibres have grainy rough surfaces as presence of wax, lignin and hemicelluloses (Fig. 3A and B). After treatment a clear surfaces with exposed fibres were observed since impurities get removed (Fig. 3C and D). This is clear from AFM images that the surface roughness of fibre gets decreased after alkaline treatment. Boynard et al. reported that alkaline treatment made strong morphological changes on the surface of Luffa fibres.53
Fig. 3. AFM images of untreated (A and B) and alkali treated (C and D) Luffa cylindrica fibre.
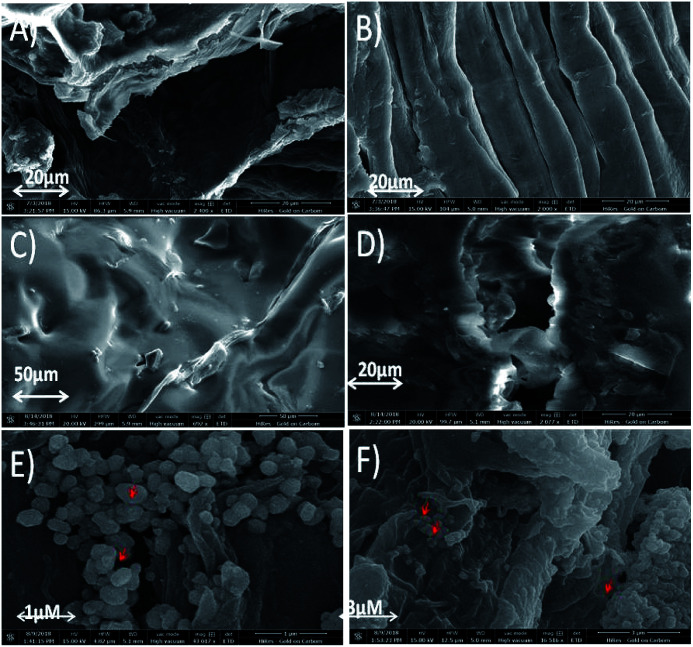
The observations obtained from AFM study was further confirmed by SEM analysis (Fig. 4). It is well known that cellulose chains are strongly bound with hemicellulose and lignin resulting in the formation of multicellular fibre.54 Furthermore, amorphous waxy layer on the surfaces and packed fibre structure resulted in poor fibre-matrix adhesion.55 Alkaline treatment removes waxy and gummy substances present in native fibres (Fig. 4A) resulting to clean and smooth surfaces with exposed inner fibrils (Fig. 4B). It reduced diameter of fibril due to elimination of natural protective waxy layer, lignin and hemicelluloses. This property may increase the adhesion between matrix and fibre when it is used in reinforcing composite material.56,57 Treated fibres further display the formation of scratches due to elimination of lignin and hemicelluloses. Luffa cylindrica fibres change their morphology after treatment since fibres which are formed by fibrils glued together by gummy substances are disposed in a multidirectional array forming a natural mat (Fig. 4B). These results well matched with previous reported studies.58–60 Surface morphology of PDMS (Fig. 4C), PDMS-Luffa sponge (Fig. 4D) and PDMS/-Luffa-TiO2 nanosponge (Fig. 4E and F) has also been studied for comparison. As apparent in SEM analysis, microfiber structure of Luffa is fully preserved during preparation of PDMS-Luffa sponge (Fig. 4D) and doping with TiO2 NPs (Fig. 4E and F). Luffa fibres are completely covered with PDMS gel thus making a super hydrophobic sponges.
Fig. 4. SEM micrographs of (A) untreated Luffa fibre, (B) alkali treated Luffa fibre after 48 h, (C) PDMS sponge, (D) PDMS-Luffa sponge, (E and F) PDMS-Luffa-TiO2 nanosponge.
Surface wetting properties
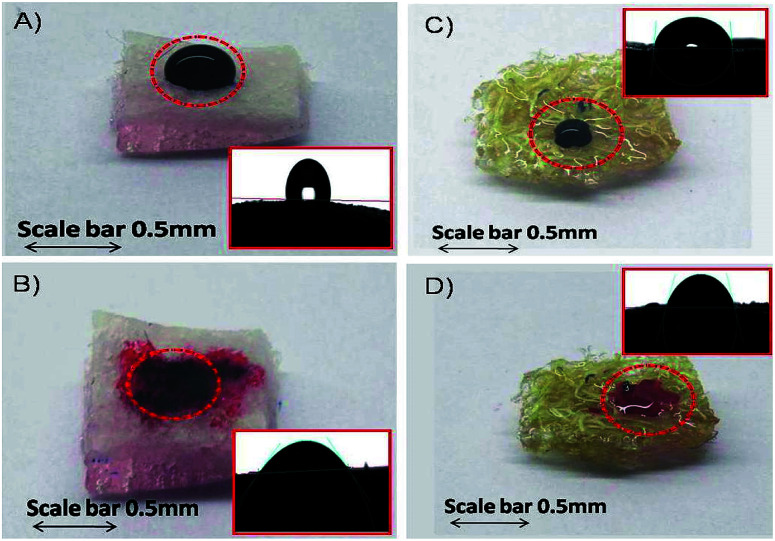
The surface wetting properties of PDMS and PDMS-Luffa sponges are shown in Fig. 5. It is clear from the images that water forms a clear droplets on sponge surfaces with contact angles of 112° (Fig. 5A) and 86° (Fig. 5B) for PDMS and PDMS-Luffa sponge, respectively. Whereas oil droplet when dropped on the sponge surfaces get absorbed quickly and decreasing the contact angles to 35° for PDMS and 68° for PDMS-Luffa sponge (Fig. 5C and D).
Fig. 5. Micrographs of different behaviour of water and oil droplets on the surfaces of (A and B) PDMS and (C and D) PDMS-Luffa sponges along with their corresponding contact angle images in the insets. Water forms a clear droplet on PDMS with contact angle of 112° (A) and PDMS-Luffa sponge with contact angle of 86° (B). The oil gets spread and absorbed on both PDMS with contact angle of 35° (C) and PDMS-Luffa sponge with contact angle of 68° (D).
These results demonstrate that both PDMS and PDMS-Luffa sponge exhibited hydrophobic and oleophilic properties which are essential for selective and active oil absorbent. PDMS-Luffa sponge displayed both oleophilic and hydrophobic properties with increased surface area and porosity. Superhydrophobicity is an important property for selective adsorption of oil especially when oil is mixed in aqueous solution.
Oil adsorption efficiency
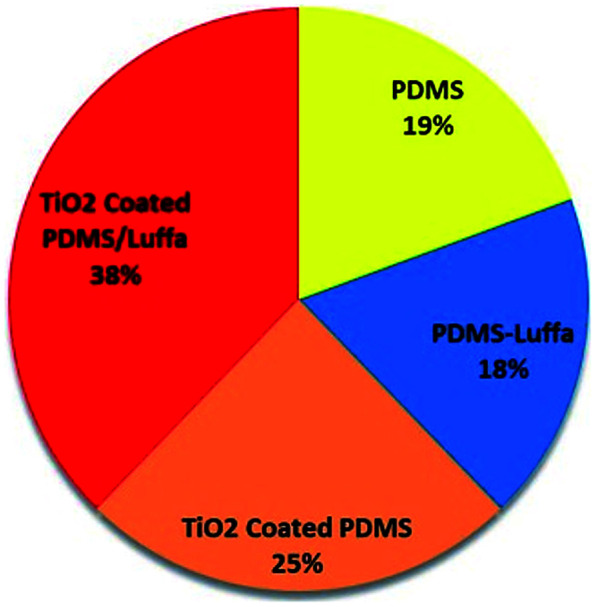
Adsorption capacity is defined as the mass ratio of the absorbed oil compared to the sponge itself when the sponge was oil saturated.61 It is an important parameter to evaluate the oil/water separation performance of the sponge. Fig. 6 show the percent oil absorption capacity of different sponges and found that maximum oil absorption occurred in PDMS-Luffa-TiO2 nanosponge (38%) while other sponges such as PDMS (19%) PDMS-Luffa (18%) and TiO2 coated PDMS (24%) displayed lesser oil absorption capacity. Since large oil absorption capacity of PDMS-Luffa-TiO2 nanosponge is because of higher porosity and specific surface area which offer a large amount of storage volume for absorbed oils.62
Fig. 6. Oil absorption efficiency (%) of different type of sponges.
Oil/water separation
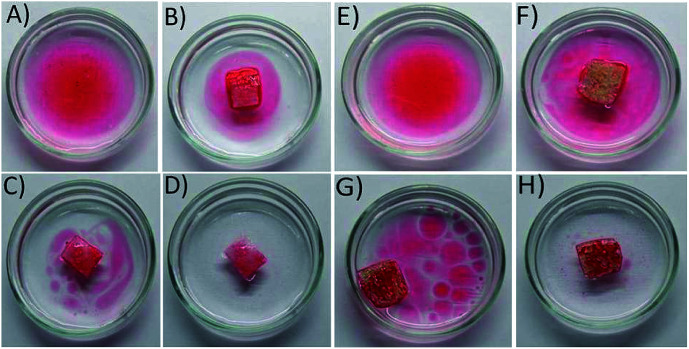
Selective oil absorptions study was conducted to demonstrate separation ability of both PDMS and PDMS-Luffa-TiO2 nanosponge toward oil/water mixtures (Fig. 7). The oils was stained with Sudan IV dye to facilitate evaluation by the naked eye. Experimental data showed that porous PDMS and PDMS-Luffa-TiO2 nanosponges absorb significant amount of oil and left water within T1 = 5 seconds showing an efficient selective oil adsorption capacity. Absorbed oil gets stored inside the porous structure of PDMS. It has been perceived that the sponge float over the water surfaces after oil absorption and can be easily removed without leakage. This characteristic is important for actual application. Absorption capacity of PDMS-Luffa-TiO2 nano sponge was higher than PDMS as it exhibit larger surface area and more porous structure due to the presence of Luffa fibers and TiO2 nanoparticles. There were no residual oil detected after T3 = 15 second of absorption, validating an excellent selective oil separation capacity of the sponges.
Fig. 7. Digital photographs showing the removal of oil from oil water mixture using PDMS sponge ((A) T0 = 0 s; (B) T1 = 5 s; (C) T2 = 10 s; (D) T3 = 15 s) and using PDMS-Luffa-TiO2 nanosponge ((E) T0 = 0 s; (F) T1 = 5 s; (G) T2 = 10 s; (H) T3 = 15 s).
Oil desorption under UV treatment
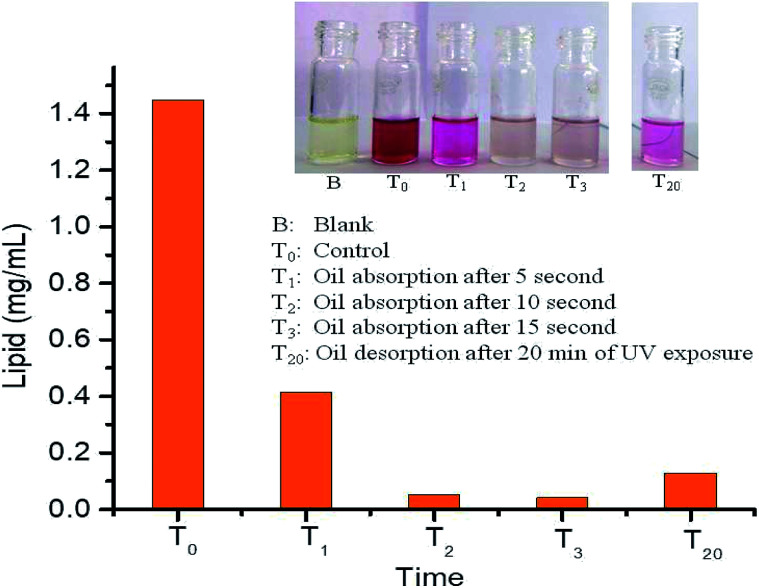
Quantitative absorption/desorption of oil from PDMS-Luffa-TiO2 nanosponge under UV light irradiation are shown in Fig. 8. The absorbed/desorbed oil was quantified by SPV method which revealed that concentration of oil in oil/water mixture was 1.448 mg mL−1 at T0 = 0 seconds (control) get decreased to 0.415 mg mL−1 at T1 = 05 second and 0.054 mg mL−1 at T2 = 10 seconds. Subsequently at T3 = 15 second, concentration of oil was 0.043 mg mL−1. After 20 min (T20) of UV light exposure, oil concentration reached to 0.129 mg mL−1 clearly showing that PDMS-Luffa-TiO2 NPs nanosponge is a good material for oil desorption under UV light treatment. Further increasing time may fully desorb oil from oil/water mixture which is an important application to be used in clean oil separation in DSP's, biofuel industries and oil spillage. There was no desorbed oil in undoped PDMS-Luffa sponge (ESI Fig. S5A†). Therefore, oil desorption under UV irradiation is enhanced because of TiO2 nanoparticles acting as photocatalyst. UV light (300 nm) can easily penetrate to PDMS sponge of ∼5 mm thickness. Intrinsic transmittance and porous structure of PDMS allowed TiO2 NPs within the sponge to get activated by UV irradiation.63 Hence, TiO2 NPs within porous PDMS sponge act as a suitable photocatalyst for oil absorption and desorption. Thus, it is clear that the oil desorption is a combined effect of air bubble growth, wetting transition and photocatalytic oxidation by the UV responsive TiO2 NPs.
Fig. 8. Quantitative chart showing absorption and desorption of oil from oil water mixture by SPV method in PDMS-Luffa-TiO2 nanosponge.
Conclusion
In this study a new and cost effective nanosponge was developed for selective and efficient oil absorption. Absorbent materials exhibited remarkable oleophilicity and can keep absorbed oil inside the nanosponge. The absorbed oil can be recovered from nanosponge either by squeezing or UV light irradiation. Therefore, same material can be reused without breakage and loss of activities. Another advantage of using PDMS-Luffa-TiO2 nanosponge over PDMS is improved mechanical strength owing the presence of cellulose fibre. It is cheaper and reusable and can be used for selective harvesting of oil from oil/water mixtures. Thus this PDMS-Luffa-TiO2 nanosponge can be used for separating of oil from diatom culture which has significant application in construction of diatom solar panels.
Conflicts of interest
There are no conflicts to declare.
Supplementary Material
Acknowledgments
MJK thanks DST Nanomission for Reseach Associateship; RS thanks UGC for Senior research fellowships, VV and KBJ thanks to DST Nanomission project no (SR/NM/NT-1090/2014(G)) for financial aids, National Centre for Solar and Photovoltaics Research and Education, IIT Bombay for project no Pid:P131581281_1 and Dr Hari Singh Gour Central University for State of Art Facilities.
Electronic supplementary information (ESI) available. See DOI: 10.1039/c9ra03821c
Notes and references
- Dhillon R. S. VonWuehlisch G. Biomass Bioenergy. 2013;48:75–89. doi: 10.1016/j.biombioe.2012.11.005. [DOI] [Google Scholar]
- Mata T. M. Martins A. A. Caetano N. S. Renewable Sustainable Energy Rev. 2010;14:217–232. doi: 10.1016/j.rser.2009.07.020. [DOI] [Google Scholar]
- Sharma Y. C. Singh B. Korstad J. Green Chem. 2011;13:2993–3006. doi: 10.1039/C1GC15535K. [DOI] [Google Scholar]
- Hu Q. Sommerfeld M. Jarvis E. Ghirardi M. Posewitz M. Seibert M. Darzins A. Plant J. 2008;54:621–639. doi: 10.1111/j.1365-313X.2008.03492.x. [DOI] [PubMed] [Google Scholar]
- Chisti Y. Biotechnol. Adv. 2007;25:294–306. doi: 10.1016/j.biotechadv.2007.02.001. [DOI] [PubMed] [Google Scholar]
- Jeffryes C. Gutu T. Jiao J. Rorrer G. L. Mater. Sci. Eng., C. 2008;28:107–118. doi: 10.1016/j.msec.2007.01.002. [DOI] [Google Scholar]
- Bromke M. A. Sabir J. S. Alfassi F. A. Hajarah N. H. Kabli S. A. Al-Malki A. L. Ashworth M. P. Méret M. Jansen R. K. Willmitzer L. PLoS One. 2015;10:e0138965. doi: 10.1371/journal.pone.0138965. [DOI] [PMC free article] [PubMed] [Google Scholar]
- Azizan A. Bustamam M. S. A. Maulidiani M. Shaari K. Ismail I. S. Nagao N. Abas F. Mar. Drugs. 2018;16:154. doi: 10.3390/md16050154. [DOI] [PMC free article] [PubMed] [Google Scholar]
- Narala R. R. Garg S. Sharma K. K. Thomas-Hall S. R. Deme M. Li Y. Schenk P. M. Front. Energy Res. 2016;4:29. [Google Scholar]
- Huang Q. Jiang F. Wang L. Yang C. Engineering. 2017;3:318–329. doi: 10.1016/J.ENG.2017.03.020. [DOI] [Google Scholar]
- Vinayak V. Gordon R. Gautam S. Rai A. Adv. Sci. Lett. 2014;20:1256–1267. doi: 10.1166/asl.2014.5591. [DOI] [Google Scholar]
- Chao J. T. Biggs M. J. P. Pandit A. S. Expert Opin. Drug Deliv. 2014;11:1687–1695. doi: 10.1517/17425247.2014.935336. [DOI] [PubMed] [Google Scholar]
- Ramachandra T. V. Mahapatra D. M. Karthick B. Gordon R. Ind. Eng. Chem. Res. 2009;48:8769–8788. doi: 10.1021/ie900044j. [DOI] [Google Scholar]
- Vinayak V. Kumar V. Kashyap M. Joshi K. B. Gordon R. Schoefs B. ICEE. 2016:1–6. [Google Scholar]
- Hamm C. E. Merkel R. Springer O. Jurkojc P. Maier C. Prechtel K. Smetacek V. Nature. 2003;421:841–843. doi: 10.1038/nature01416. [DOI] [PubMed] [Google Scholar]
- Kumar V. Singh R. Thakur S. Joshi K. B. Vinayak V. Mater. Res. Express. 2018;5:045503. doi: 10.1088/2053-1591/aab86a. [DOI] [Google Scholar]
- El-Roz M. Haidar Z. Lakiss L. Toufaily J. Thibault-Starzyk F. RSC Adv. 2013;3:3438–3445. doi: 10.1039/C2RA22438K. [DOI] [Google Scholar]
- Izadyar S. Fatemi S. Ind. Eng. Chem. Res. 2013;52:10961–10968. doi: 10.1021/ie400416e. [DOI] [Google Scholar]
- Varnagiris S. Girdzevicius D. Urbonavicius M. Milcius D. Energy Procedia. 2017;128:525–532. doi: 10.1016/j.egypro.2017.09.073. [DOI] [Google Scholar]
- Ribeiro Magalhães de Sousa R. Odolberto de Araújo F. Da Costa J. Nishimoto A. Cruz Viana B. Alves junior C. Mater. Res. 2016;19:1207–1212. doi: 10.1590/1980-5373-MR-2015-0358. [DOI] [Google Scholar]
- Subba Rao K. V. Rachel A. Subrahmanyam M. Boule P. Appl. Catal., B. 2003;46:77–85. doi: 10.1016/S0926-3373(03)00199-1. [DOI] [Google Scholar]
- Li J. W. Zhu W. Liu J. Liu X. Liu H. Q. Chin. Sci. Bull. 2012;57:2022–2028. doi: 10.1007/s11434-012-5038-x. [DOI] [Google Scholar]
- Shirley R. Kraft M. Inderwildi O. R. Phys. Rev. B: Condens. Matter Mater. Phys. 2010;81:075111. doi: 10.1103/PhysRevB.81.075111. [DOI] [Google Scholar]
- Han S. G. Newsome B. Hennig B. Toxicology. 2013;306:1–8. doi: 10.1016/j.tox.2013.01.014. [DOI] [PMC free article] [PubMed] [Google Scholar]
- Sha B. Y. Gao W. Wang S. Q. Xu F. Lu T. J. Composites, Part B. 2011;42:2136–2144. doi: 10.1016/j.compositesb.2011.05.009. [DOI] [Google Scholar]
- Gautam S. Kashyap M. Gupta S. Kumar V. Schoefs B. Gordon R. Jeffryes C. Joshi K. B. Vinayak V. RSC Adv. 2016;6:97276–97284. doi: 10.1039/C6RA18487A. [DOI] [Google Scholar]
- Mata A. Fleischman A. J. Roy S. Biomed. Microdevices. 2005;7:281–293. doi: 10.1007/s10544-005-6070-2. [DOI] [PubMed] [Google Scholar]
- Quake S. R. Scherer A. Science. 2000;290:1536–1540. doi: 10.1126/science.290.5496.1536. [DOI] [PubMed] [Google Scholar]
- Zhao X. Li L. Li B. Zhang J. Wang A. J. Mater. Chem. A. 2014;2:18281–18287. doi: 10.1039/C4TA04406A. [DOI] [Google Scholar]
- Choi S.-J. Kwon T.-H. Im H. Moon D.-I. Baek D. J. Seol M.-L. Duarte J. P. Choi Y.-K. ACS Appl. Mater. Interfaces. 2011;3:4552–4556. doi: 10.1021/am201352w. [DOI] [PubMed] [Google Scholar]
- Park J. Jeong H. J. Young Yoon E. Joo Moon S. Algae. 2016;31:391–401. doi: 10.4490/algae.2016.31.12.7. [DOI] [Google Scholar]
- Tran D. N. Kabiri S. Sim T. R. Losic D. Environ. Sci.: Water Res. Technol. 2015;1:298–305. doi: 10.1039/C5EW00035A. [DOI] [Google Scholar]
- Siqueira G. Bras J. Dufresne A. Bioresources. 2010;5:727–740. [Google Scholar]
- Karthik T. Ganesan P. J. J. Text. Inst. 2016;107:1412–1425. doi: 10.1080/00405000.2015.1114792. [DOI] [Google Scholar]
- d'Almeida A. L. F. S. Barreto D. W. Calado V. d'Almeida J. R. M. Polym. Polym. Compos. 2006;14:73–80. [Google Scholar]
- Tanobe V. O. A. Sydenstricker T. H. D. Munaro M. Amico S. C. Polym. Test. 2005;24:474–482. doi: 10.1016/j.polymertesting.2004.12.004. [DOI] [Google Scholar]
- Demir H. Atikler U. Balköse D. Tıhmınlıoğlu F. Composites, Part A. 2006;37:447–456. doi: 10.1016/j.compositesa.2005.05.036. [DOI] [Google Scholar]
- Seki Y. Sever K. Erden S. Sarikanat M. Neser G. Ozes C. J. Appl. Polym. Sci. 2012;123:2330–2337. doi: 10.1002/app.34744. [DOI] [Google Scholar]
- Rawal A. Sharma S. Kumar V. Saraswat H. Appl. Surf. Sci. 2016;389:469–476. doi: 10.1016/j.apsusc.2016.07.053. [DOI] [Google Scholar]
- Karbowiak T. Ferret E. Debeaufort F. Voilley A. P. J. Cayot J. Membr. Sci. 2011;370:82–90. doi: 10.1016/j.memsci.2010.12.037. [DOI] [Google Scholar]
- Lasagabaster A. Abad M. J. Barral L. Ares A. Eur. Polym. J. 2006;42:3121–3132. doi: 10.1016/j.eurpolymj.2006.03.029. [DOI] [Google Scholar]
- Lionetto F. Sole R. D. Cannoletta D. Vasapollo G. Maffezzoli A. Materials. 2012;5:1910–1922. doi: 10.3390/ma5101910. [DOI] [Google Scholar]
- Ciolacu D. Ciolacu F. Popa V. I. Cellul. Chem. Technol. 2011;45:13–21. [Google Scholar]
- Oh S. Y. Yoo D. I. Shin Y. Kim H. C. Kim H. Y. Chung Y. S. Park W. H. Youk J. H. Carbohydr. Res. 2005;340:2376–2391. doi: 10.1016/j.carres.2005.08.007. [DOI] [PubMed] [Google Scholar]
- Rosu D. Teaca C. A. Bodirlau R. Rosu L. J. J. Photochem. Photobiol., B. 2010;99:144–149. doi: 10.1016/j.jphotobiol.2010.03.010. [DOI] [PubMed] [Google Scholar]
- Karthik T. Murugan R. Fibers Polym. 2013;14:465–472. doi: 10.1007/s12221-013-0465-0. [DOI] [Google Scholar]
- Efimenko K. Wallace W. E. Genzer J. J. Colloid Interface Sci. 2002;254:306–315. doi: 10.1006/jcis.2002.8594. [DOI] [PubMed] [Google Scholar]
- Khorasani M. T. Mirzadeh H. Sammes P. G. Radiat. Phys. Chem. 1996;47:881–888. doi: 10.1016/0969-806X(95)00166-U. [DOI] [Google Scholar]
- Reynolds J. G. Coronado P. R. Hrubesh L. W. J. Non-Cryst. Solids. 2001;292:127–137. doi: 10.1016/S0022-3093(01)00882-1. [DOI] [Google Scholar]
- Singh R. Gupta S. Kumar V. Joshi K. B. ChemNanoMat. 2017;3:620. doi: 10.1002/cnma.201700129. [DOI] [Google Scholar]
- Singh R. Mishra N. K. Kumar V. Vinayak V. Joshi K. B. ChemBioChem. 2018;19:1630–1637. doi: 10.1002/cbic.201800220. [DOI] [PubMed] [Google Scholar]
- Kumar V. Singh R. Joshi K. B. New J. Chem. 2018;42:3452–3458. doi: 10.1039/C7NJ04248E. [DOI] [Google Scholar]
- Boynard C. A. Monteiro S. N. d'Almeida J. R. M. J. Appl. Polym. Sci. 2003;87:1927–1932. doi: 10.1002/app.11522. [DOI] [Google Scholar]
- Sreekala M. S. Kumaran M. G. Thomas S. J. Appl. Polym. Sci. 1997;66:821–835. doi: 10.1002/(SICI)1097-4628(19971031)66:5<821::AID-APP2>3.0.CO;2-X. [DOI] [Google Scholar]
- Mishra S. Mohanty A. K. Drzal L. T. Misra M. Parija S. Nayak S. K. Tripathy S. S. Compos. Sci. Technol. 2003;63:1377–1385. doi: 10.1016/S0266-3538(03)00084-8. [DOI] [Google Scholar]
- Cao Y. Shibata S. Fukumoto I. Composites, Part A. 2006;37:423–429. doi: 10.1016/j.compositesa.2005.05.045. [DOI] [Google Scholar]
- Allen K. W. Int. J. Adhes. Adhes. 1993;13:67. doi: 10.1016/0143-7496(93)90015-2. [DOI] [Google Scholar]
- Cyras V. P. Vallo C. Kenny J. M. Vazquez A. J. Compos. Mater. 2004;38:1387–1399. doi: 10.1177/0021998304042738. [DOI] [Google Scholar]
- Rong M. Z. Zhang M. Q. Liu Y. Yang G. C. Zeng H. M. Compos. Sci. Technol. 2001;61:1437–1447. doi: 10.1016/S0266-3538(01)00046-X. [DOI] [Google Scholar]
- Bledzki A. K. Gassan J. Prog. Polym. Sci. 1999;24:221–274. doi: 10.1016/S0079-6700(98)00018-5. [DOI] [Google Scholar]
- Li H. Liu L. Yang F. Procedia Environ. Sci. 2013;18:528–533. doi: 10.1016/j.proenv.2013.04.071. [DOI] [Google Scholar]
- Kim D. H. Jung M. C. Cho S.-H. Kim S. H. Kim H.-Y. Lee H. J. Oh K. H. Moon M.-W. Sci. Rep. 2015;5:12908. doi: 10.1038/srep12908. [DOI] [PMC free article] [PubMed] [Google Scholar]
- Kuo J. S. Ng L. Yen G. S. Lorenz R. M. Schiro P. G. Edgar J. S. Zhao Y. Lim D. S. W. Allen P. B. Jeffries G. D. M. Chiu D. T. Lab Chip. 2009;9:870–876. doi: 10.1039/B818873D. [DOI] [PMC free article] [PubMed] [Google Scholar]
Associated Data
This section collects any data citations, data availability statements, or supplementary materials included in this article.


