

Abstract
Several enteric pathogens can gain specific metabolic advantages over other members of the microbiota by inducing host pathology and inflammation. The pathogen Clostridium difficile is responsible for a toxin-mediated colitis that causes 450,000 infections and 15,000 deaths in the United States each year1; however, the molecular mechanisms by which C. difficile benefits from this pathology remain unclear. To understand how the metabolism of C. difficile adapts to the inflammatory conditions that its toxins induce, here we use RNA sequencing to define, in a mouse model, the metabolic states of wild-type C. difficile and of an isogenic mutant that lacks toxins. By combining bacterial and mouse genetics, we demonstrate that C. difficile uses sorbitol derived from both diet and host. Host-derived sorbitol is produced by the enzyme aldose reductase, which is expressed by diverse immune cells and is upregulated during inflammation–including during toxin-mediated disease induced by C. difficile. This work highlights a mechanism by which C. difficile can use a host-derived nutrient that is generated during toxin-induced disease by an enzyme that has not previously been associated with infection.
Many enteric pathogens cause disease in the gut by expressing virulence factors to create a modified niche that provides the pathogen with a competitive advantage over other community members. For example, Salmonella enterica serovar Typhimurium2,3, Citrobacter rodentium4, enterohaemorrhagic Escherichia coli5 and Vibrio cholerae6 couple metabolic strategies to specific aspects of the host response. We applied this framework to understand how the pathogen C. difficile—which has recently been reclassified as belonging to the genus Clostridioides–benefits from the pathology that it induces. Symptomatic C. difficile infection is mediated by two large glycosylating toxins, TcdA and TcdB, which inactivate the Rho family of GTPases. The host immune response has a crucial role in dictating the severity of infection7, but how C. difficile might exploit the distinct ecological niche of an inflamed gut—compared with a healthy gut–remains unknown8.
We proposed that toxin production and subsequent inflammation alters the biochemical landscape of the gut, and that C. difficile modifies its metabolism accordingly. RNA-sequencing (RNA-seq) studies in gnotobiotic mice colonized with wild-type C. difficile or with an isogenic toxin-deficient mutant enabled the identification of metabolic pathways in C. difficile that are specific to inflammatory or non-inflammatory conditions. Under gnotobiotic conditions and a controlled diet, and gnotobiotic conditions, we predicted that toxin-dependent shifts in C. difficile metabolism would reflect alterations in luminal nutrient availability due to host-derived metabolites.
Gene expression due to toxin production
Toxin production conferred an advantage in relative abundance to wild-type C. difficile in the presence of a commensal community (Extended Data Fig. 1a). To investigate toxin-dependent changes to C. difficile metabolism, we mono-colonized germ-free mice with wild-type C. difficile 630ΔErm or C. difficile 630ΔErmTcdA−B−, an isogenic mutant lacking the ability to produce toxins (Extended Data Fig. 1b). Colonization with the toxin-deficient mutant (Tox-) resulted in negligible inflammation in the proximal colon of mice compared to the wild-type (WT) strain (Fig. 1a). Histopathological scoring confirmed that mice infected with wild-type C. difficile had higher numbers of inflammatory cell infiltrates, mucosal hyperplasia, and vascular congestion (Supplementary Table 1).
Fig. 1. Toxin-induced inflammation leads to extensive differential gene expression of C. difficile in vivo.
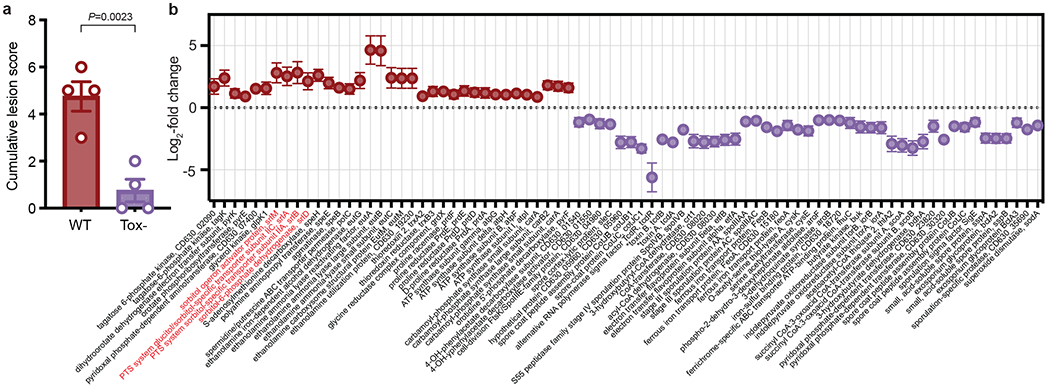
a, Blinded histopathological scoring of the proximal colon for mice infected with wild-type and Tox- mutant C. difficile at day 3 post-colonization (mean±SEM, n=4 mice/group, two-tailed unpaired Student’s t-test). b, Fold-change (mean±SEM, n=4 wild-type, 3 Tox- mice, Wald test P<0.05) of a subset of C. difficile genes differentially expressed between wild-type (positive) and Tox- (negative) C. difficile 3 days post-colonization in cecal contents of mono-colonized mice. Toxin proteins are denoted by asterisks, the putative sorbitol utilization locus highlighted in red. Genes included were involved in iron transport, sporulation, virulence, and metabolism (for metabolic genes, >= 2 genes in a predicted operon).
After 3 days of infection, we isolated total RNA from cecal contents for RNA-seq. 331 genes were differentially expressed between wild-type and toxin-deficient C. difficile (adjusted P-value < 0.05, Wald test with Benjamini-Hochberg correction). Several metabolic pathways were enriched due to the presence or absence of toxin in vivo (Extended Data Figs. 1c,d). Genes involved in sporulation, conjugative transposons, iron transport and butyrate production were more highly expressed in the absence of toxin-induced inflammation (Supplementary Table 2). More reads mapped to the mutated toxin genes in Tox− (Fig. 1b), despite the inability of this strain to produce toxin proteins. Genes involved in the metabolism of ethanolamine, a host-derived molecule that is used by other enteric pathogens5, were more highly expressed in the wild type (Fig. 1b).
Molecular basis for sorbitol metabolism
An operon that was putatively annotated for sorbitol utilization was more highly expressed in wild-type than in Tox- C. difficile (Fig. 1b,2a). Sorbitol metabolism has been described in C. difficile but the genetic locus not experimentally demonstrated nor its implications investigated in vivo. On the basis of work with E. coli9 and Streptococci10, it is predicted that C. difficile encodes a multi-step pathway that transports and metabolizes sorbitol into a glycolytic substrate (Extended Data Fig. 2a). wild-type and Tox- C. difficile grew using sorbitol as a sole carbohydrate source in vitro (Fig. 2b, Extended Data Fig. 2b), indicating that lower expression of the sorbitol operon by Tox- in vivo was not due to an inability to utilize the substrate.
Fig. 2. A putative sorbitol utilization locus is responsible for C. difficile metabolism of sorbitol in vitro and in vivo.
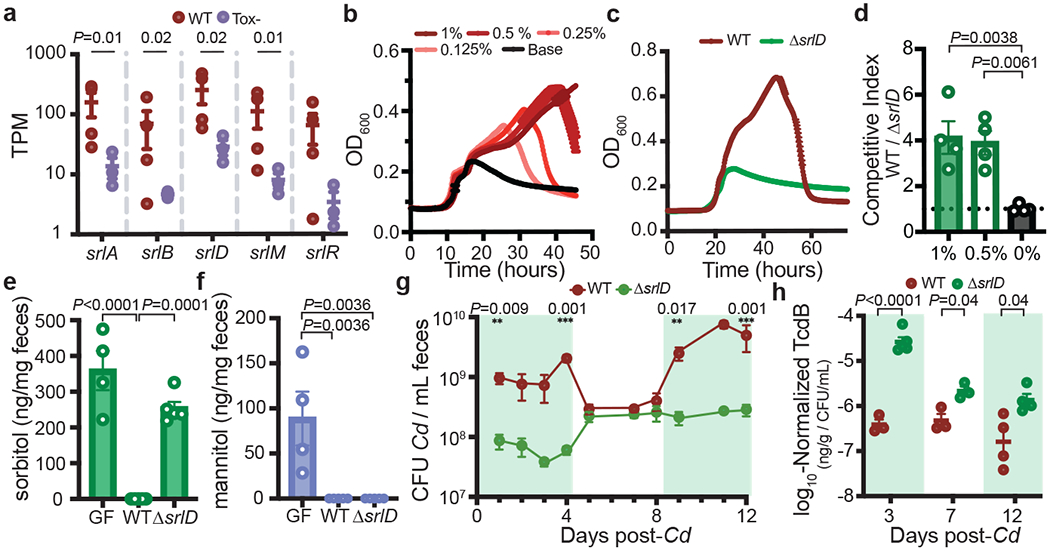
a, Normalized expression values of genes involved in the putative sorbitol utilization locus (mean ± s.e.m., n = 4 wild-type mice, 3 Tox– mice, Wald test). b, Dose-dependent growth of C. difficile in minimal medium supplemented with sorbitol (mean±SEM, n=5 replicates/condition). c, A C. difficile sorbitol dehydrogenase mutant (ΔsrlD) is unable to achieve increased growth yield in minimal medium supplemented with 0.5% w/v sorbitol (mean±SEM, n=5 replicates/condition. d, wild-type C. difficile outcompetes ΔsrlD in vitro after 24 hours when sorbitol (0.5%, 1% w/v) is added to minimal medium but not when sorbitol is absent (n=4 replicates/condition, mean±SEM, one-way ANOVA F(2,9)=11.37, Dunnett’s multiple comparisons with 0% as control). e, Colonization of mice fed standard diet with ΔsrlD C. difficile (n=5) does not alter fecal sorbitol levels compared to germ-free mice (GF, n=4), whereas colonization with wild-type C. difficile reduces sorbitol levels below the limit of detection (n=5, mean±SEM, F(2,11)=40.25, one-way ANOVA with Tukey’s multiple comparisons). f, Mannitol in GF mouse feces (n=4) is depleted upon colonization with either wild-type (n=5) or ΔsrlD C. difficile (n=5, mean±SEM, F(2,11)=11.56, one-way ANOVA, Tukey’s multiple comparisons). g, Exogenously provided sorbitol increases the abundance of wild-type C. difficile in vivo but not the ΔsrlD mutant. Green boxes indicate days when sorbitol was supplemented in drinking water (1% w/v, mean ± s.e.m., n = 5 mice per group, multiple unpaired t-tests with Holm–Sidak multiple comparisons). CFU, colony-forming units. h, Normalized TcdB abundance in feces of mice infected with wild-type or ΔsrlD C. difficile (n=5 mice/group). Green boxes denote sorbitol supplementation as in (g) (mean ± s.e.m., multiple unpaired t-tests adjusted using Holm–Sidak tests).
To determine whether the putative sorbitol locus was responsible for demonstrated growth on sorbitol (Fig. 2b), we created a mutant of C. difficile in which the sorbitol dehydrogenase gene was deleted (ΔsrlD). The mutant was unable to achieve increased growth on minimal medium supplemented with sorbitol (Fig. 2c, Extended Data Fig. 2c) despite maintaining induction of the srl locus (Extended Data Fig. 2d). Furthermore, wild-type outcompeted the ΔsrlD mutant in vitro only when sorbitol was added to the medium (Fig. 2d).
C. difficile consumes sorbitol in vivo
Next, we investigated sorbitol utilization by C. difficile within the mouse gut. Addition of exogenous sorbitol in drinking water led to up-regulation of srlD (Extended Data Fig. 2e), indicating that increased dietary sorbitol led to induction of the locus. In a previous untargeted metabolomic screen, after a course of antibiotics rendering mice susceptible to C. difficile infection, sorbitol and mannitol were the most enriched metabolites relative to pre- or post-antibiotic states11. We developed a gas chromatography–mass spectrometry (GC–MS) assay to differentiate and quantify sorbitol and mannitol and demonstrated that our antibiotic pre-treatment for C. difficile infection in conventional mice led to an increase in sorbitol and mannitol in stool (Extended Data Fig. 2f).
Because sorbitol and its stereoisomer mannitol are by-products of photosynthesis and are known carbon storage molecules in plants12, we predicted that both would be abundant in standard mouse chow. Accordingly, germ-free mice exhibited high levels of sorbitol and mannitol in feces (Fig. 2e,f). Subsequent colonization of germ-free mice with wild-type C. difficile led to complete consumption of both sugar alcohols, while colonization with ΔsrlD did not alter sorbitol levels (Fig. 2e), but depleted mannitol, indicating that srlD is highly specific to sorbitol (Fig. 2f). The inability to utilize sorbitol led to attenuated colonization 24 hours after infection in conventional mice fed standard diet (Extended data Fig. 2g). The lower colonization level of the ΔsrlD mutant was accompanied by increased relative toxin production compared to the wild type (Extended Data Fig. 2h), which is consistent with toxin production by C. difficile under nutrient-limited and stressed conditions8,13.
To determine whether sorbitol availability influenced C. difficile abundance in the gut, we placed gnotobiotic mice harboring a defined community of bacteria on a fully-defined diet devoid of sorbitol, and subsequently infected with either wild-type C. difficile or ΔsrlD. When sorbitol was supplemented in drinking water (1% w/v), wild-type reached an order of magnitude higher density than ΔsrlD; when sorbitol was removed, the abundance of wild-type dropped to levels indistinguishable from ΔsrlD (Fig. 2g). As seen in conventional mice, the inability to utilize sorbitol resulted in increased toxin production on a per-cell basis (Fig. 2h).
We tested whether exogenous mannitol supplementation would lead to an increase in C. difficile abundance as seen with sorbitol (Fig. 2g). Supplementation of 1% sorbitol or 1% mannitol in the drinking water of mice harbouring a defined consortium of bacteria led to an increased density of wild-type C. difficile (days 0–6 and days 11–14) compared to when sorbitol or mannitol was absent (days 7–10; Extended Data Fig. 3a). Supplementation of mannitol (1%) in the drinking water enabled the ΔsrlD mutant to achieve increased abundance (Extended Data Fig. 3b) and incite a histopathology score equivalent to that of the wild type (Extended Data Fig. 3c, d); this demonstrates that provision of a sugar alcohol that is stereoisomeric to sorbitol enables mutant outgrowth, whereas sorbitol itself does not. It is important to note that host inflammation during C. difficile infection is a function of several factors including cumulative toxin amount, changes in host immune response, gut motility, and dynamics of the resident microbiota, including changing density and biogeography of C. difficile.
Lack of sorbitol augments toxin production
We sought to define the influence of sorbitol metabolism on toxin production by C. difficile. Supplementation of 0.5% or 1% (w/v) sorbitol in minimal medium led to lower expression of tcdA and tcdC (which encodes the holin-like protein required for toxin secretion) compared to unsupplemented base medium (Extended Data Fig. 4a). In mice, provision of exogenous sorbitol or mannitol in vivo (through drinking water) led to lower levels of toxin production by wild-type C. difficile versus when sorbitol or mannitol was not supplemented (Extended Data Fig. 4b). By contrast, only mannitol–and not sorbitol–decreased toxin production in the ΔsrlD mutant (Extended Data Fig. 4c). Our data support a model in which amplified toxin production occurs in the absence of sorbitol metabolism by C. difficile, potentially as a mechanism to procure the sugar alcohol.
When comparing our data with previous reports that examined the effect of other simple sugars on the host colonization, sporulation and virulence of C. difficile, important and complex differences emerge. The disaccharide trehalose, a dietary additive to which some epidemic C. difficile strains recently adapted, led to induction of C. difficile virulence genes and decreased host survival in mice; a C. difficile trehalose mutant exhibited impaired toxin production and increased host survival14. A comparison of 906 whole-genome C. difficile isolates showed that transport and metabolism for many sugars, including glucose, mannitol, sorbitol, and fructose (also a product of sorbitol metabolism) were under positive selection in many strains15. Administration of glucose and fructose, but not ribose (not positively selected), enhanced C. difficile sporulation and host colonization in mice. The sources of these sugars vary: some are long-term components of human diet, others recent additions as stabilizers/sweeteners, some of which are also produced by the host. Each has undergone a unique rate of increase in the industrialized diet16, and their impacts on C. difficile physiology and evolution is an important area of investigation.
Aldose reductase is associated with immune cells
In our initial RNA-seq studies investigating inflammation-dependent changes in C. difficile metabolism (Fig. 1b), all mice were fed identical diets. The data indicated that sorbitol utilization during toxin-dependent disease resulted from the production of sorbitol in the host during an inflammatory response. In the mammalian polyol pathway, the enzyme aldose reductase (AR) reduces glucose to sorbitol; sorbitol dehydrogenase oxidizes sorbitol to fructose (Fig. 3a), a substrate for glycolysis. Under hyperglycemic conditions, up to 30% of glucose is shunted through the polyol pathway17.
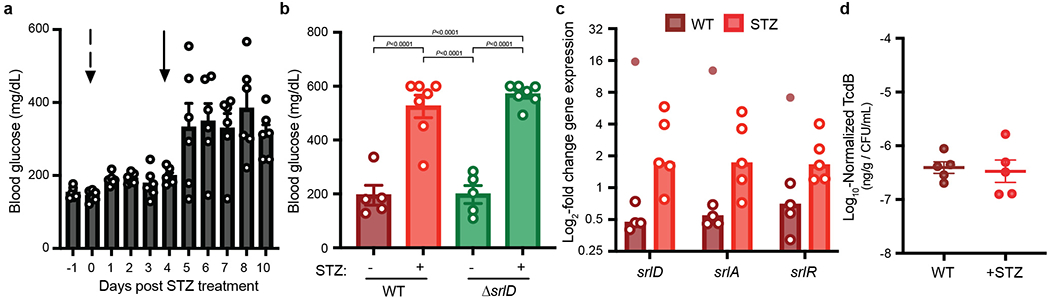
Fig. 3. Host aldose reductase responds to C. difficile infection.
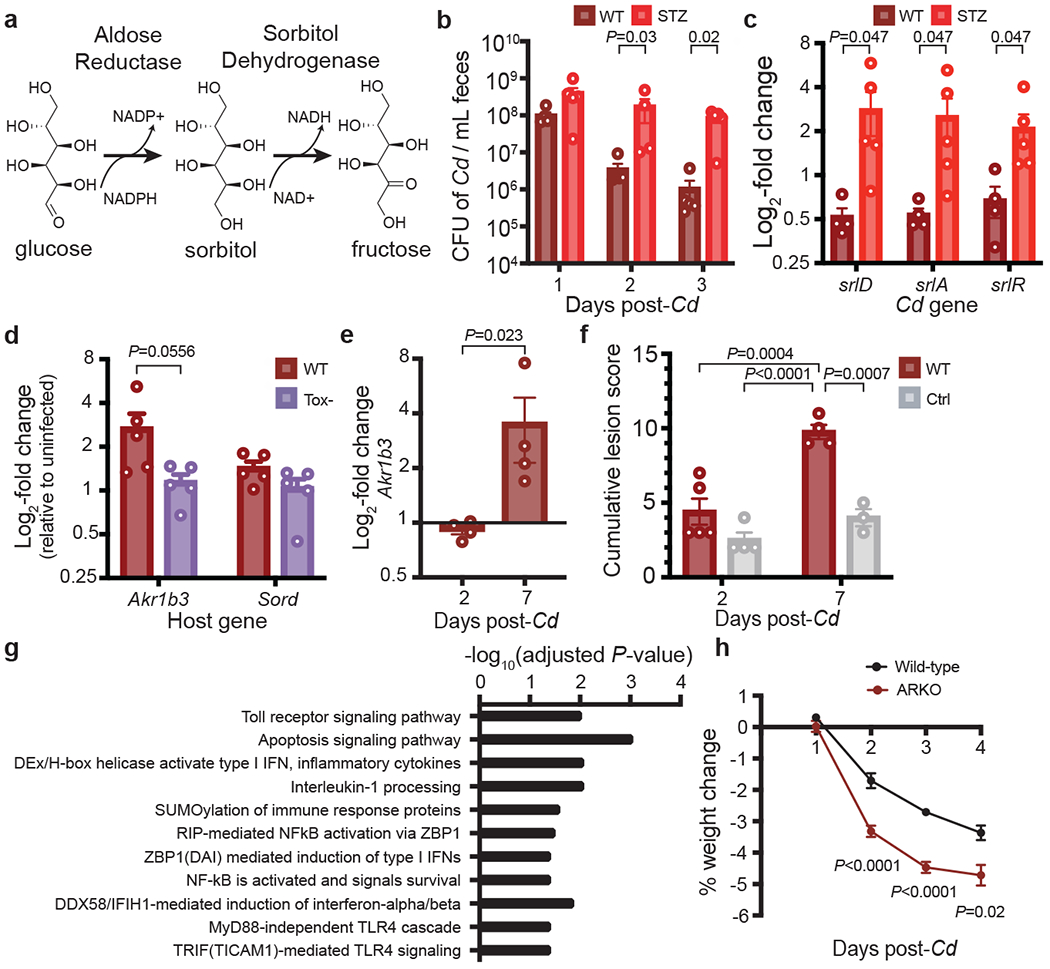
a, Schematic of the host polyol pathway. Aldose reductase reduces glucose to sorbitol using NADPH as a cofactor. Sorbitol is oxidized to fructose by sorbitol dehydrogenase, generating NADH. b, Faecal density of C. difficile in conventional mice with or without streptozotocin (STZ) treatment (n = 5 mice per group, mean ± s.e.m., multiple Mann–Whitney U-test with Holm–Sidak adjustment). c, Relative expression of the C. difficile sorbitol utilization locus in streptozotocin-treated mice versus controls as measured by quantitative PCR with reverse transcription (RT–qPCR) of RNA isolated from faeces 3 days after infection (n = 5 mice per group, mean ± s.e.m., multiple Mann–Whitney U-test with Holm–Sidak). d, Relative expression levels of Akr1b3 (encoding aldose reductase) and Sord (encoding sorbitol dehydrogenase) in the proximal colon of mice infected with hypervirulent wild-type (R20291) or Tox– (R20291 TcdA−TcdB−CDT−) C. difficile (n = 5 mice per group, mean + s.e.m., 5 days post-infection, expression normalized to uninfected control group not shown, two-tailed Mann–Whitney U-test). e, Proximal colonic aldose reductase (Akr1b3) expression in conventional mice after C. difficile infection 2 (n=5) and 7 (n=4) days after infection (mean±SEM, two-tailed Mann-Whitney). f, Blinded histopathological scoring of cecal blind tip 2 (n=4 control, n=5 wild-type) and 7 (n=3 control, n=4 wild-type) days post-C. difficile infection vs. antibiotic-treated controls (conventional mice, all treated with 1 mg clindamycin. Mean±SEM, one-way ANOVA F(3,12)=20.83 with Tukey’s post-hoc comparisons). g, Host pathways that are significantly positively correlated with host aldose reductase expression in response to purified C. difficile TcdA (GSEA, Bonferroni multiple hypothesis correction). h, Aldose reductase knockout mice lose significantly more weight than wild-type mice when infected with wild-type C. difficile (n=15 wild-type, n=16 ARKO mice from two independent experiments; mean±SEM, multiple unpaired t-tests with Benjamini, Krieger, and Yekutieli FDR). In c and e, one outlier was tested for and removed with robust nonlinear regression, Q=0.2%; the original data is provided in Extended Data Figs. 5c,7f.
Increasing blood glucose leads to higher aldose reductase activity18,19. We used a streptozotocin-induced model of hyperglycemia in conventional (Extended Data Fig. 5a) and germ-free mice (Extended Data Fig. 5b). streptozotocin-treated conventional mice were more susceptible to C. difficile colonization (Fig. 3b) and C. difficile upregulated the locus for sorbitol utilization during hyperglycemia (Fig. 3c, Extended data Fig. 5c) independent of a change to toxin production (Extended Data Fig. 5d), indicating increased availability of sorbitol from host tissue. As sorbitol and mannitol are both dietary components but only sorbitol can be generated by the mammalian host, we predicted that the two sugar alcohols would differentially affect C. difficile. In vitro transcriptional profiling confirmed20 distinct metabolic programs and physiological responses to sorbitol versus mannitol (Supplementary Text, Extended Data Fig. 6, Supplementary Table 3). There is a higher incidence of C. difficile in diabetic patients21,22, although the extent to which host aldose reductase activity and C. difficile sorbitol utilization contributes to this is unknown.
The polyol pathway has primarily been studied in diabetes, but some evidence suggests a role for aldose reductase in the innate immune response. aldose reductase inhibition prevents expression of inflammatory markers: cytokines, including TNF, IL-6, IL-1, IFNg; chemokines, such as MCP-1 and MIP-1; inflammatory proteins iNOS and Cox-223. To identify the principal host tissues that express aldose reductase, we examined published single-cell RNA-seq data from the Tabula muris study, which performed single-cell RNA-seq on 20 mouse organs24. Aldose reductase (Akr1b3) is most highly expressed in several bone marrow-derived cell types, including megakaryocyte-erythroid progenitors, granulocyte monocyte progenitors, pre- and natural killer cells (also in liver), multipotent progenitor cells, common lymphoid progenitors and basophils (Extended Data Fig. 7a)24, further indicating a role in immune function.
To determine what cell types express aldose reductase within the gastrointestinal tract, we analyzed single cell RNA-seq data from the mouse large intestine25 and human colonic explants26. Akr1b3 in mice (Extended data Fig. 7b) and Akr1b1 (Extended data Fig. 7c), the human homolog, were expressed at high prevalence by several immune cell types in the gut. Notably, sorbitol dehydrogenase was not comparably expressed in these cells, but was most expressed in enterocytes, goblet cells, and stem cells (Extended data Fig. 7b,c). Several immune cell types increased aldose reductase expression (Akr1b1 or Akr1b3) during inflammatory conditions in mice (Heligmosomoides polygyrus infection)25 and humans (inflammatory tissue from ulcerative colitis patients)26 relative to uninflamed controls (Extended data Fig. 7d,e).
Aldose reductase responds to C. difficile infection
To increase the host inflammatory response during C. difficile infection, we infected mice with the hypervirulent C. difficile strain R20291 or its isogenic triple-toxin knockout TcdA–TcdB–CDT– (CDT, C. difficile transferase; an ADP-ribosylating binary toxin). In mice infected with wild-type R20291, aldose reductase was more highly expressed in proximal colonic tissue compared to mice infected with Tox-, whereas there was no change in expression of host sorbitol dehydrogenase, indicating that aldose reductase selectively responded to C. difficile-induced inflammation (Fig. 3d). In conventional mice infected with C. difficile 630ΔErm, aldose reductase was more highly expressed in the proximal colon (Fig. 3e, Extended data Fig. 7f) concomitant with increased inflammation and tissue damage (Fig. 3f). When purified C. difficile TcdA was injected into the ceca of mice, host aldose reductase was significantly up-regulated in cells isolated from the epithelial layer of the cecum compared to sham-injected controls (adjusted P-values for three Akr1b3 microarray probes=0.0175, 0.0198, 0.0256, moderated t-statistic with Benjamini-Hochberg FDR correction)27. Host aldose reductase therefore responds to three different models of C. difficile-induced inflammation.
Finally, we conducted a differential correlation analysis to identify genes that were positively correlated with Akr1b3 in response to treatment with purified C. difficile TcdA27 but were negatively or non-correlated in control mice. Pathway enrichment analysis revealed that the expression of genes involved in several host immune pathways was significantly positively correlated with host Akr1b3 (Fig. 3g). Taken together, these data demonstrate that aldose reductase is a component of the host immune response during infection.
To decrease host aldose reductase activity in gnotobiotic mice, we administered the aldose reductase inhibitor epalrestat via gavage. Although epalrestat reduced the density of C. difficile in vivo, which is consistent with loss of host sorbitol, after follow-up investigation we determined that the drug acted as an antibiotic for C. difficile (Supplementary Information, Extended Data Fig. 8). We then investigated the genetic ablation of aldose reductase using aldose reductase knockout mice (ARKO). We found that ARKO mice lost weight more rapidly than did wild-type mice over the course of post-antibiotic C. difficile infection, further supporting the role of aldose reductase in the immune response (Fig. 3h).
C. difficile utilizes host-derived sorbitol
To determine whether C. difficile utilizes host-derived sorbitol, we co-infected conventional mice with equal amounts of wild-type C. difficile and the isogenic mutant ΔsrlD in the absence of dietary sorbitol. On a fully defined diet devoid of sorbitol, wild-type C. difficile outcompeted the ΔsrlD mutant by up to five orders of magnitude (Fig. 4). In mice lacking the ability to generate sorbitol (ARKO mice), wild-type C. difficile lost its competitive advantage over the mutant unable to metabolize sorbitol (Fig. 4, red bars). Exogenous administration of sorbitol to ARKO mice on a defined diet restored the competitive advantage to wild-type C. difficile (Fig 4, green bars). Although we cannot exclude the possibility that increased toxin production by ΔsrlD contributes to its disadvantage, previous studies demonstrated that sustained over-expression of protein-coding genes does not diminish competitive fitness in the gut over weeks28. Our data are consistent with the idea that, during infection, C. difficile utilizes sorbitol produced by host aldose reductase.
Fig. 4. C. difficile utilizes host-derived sorbitol to achieve high densities within the gut.
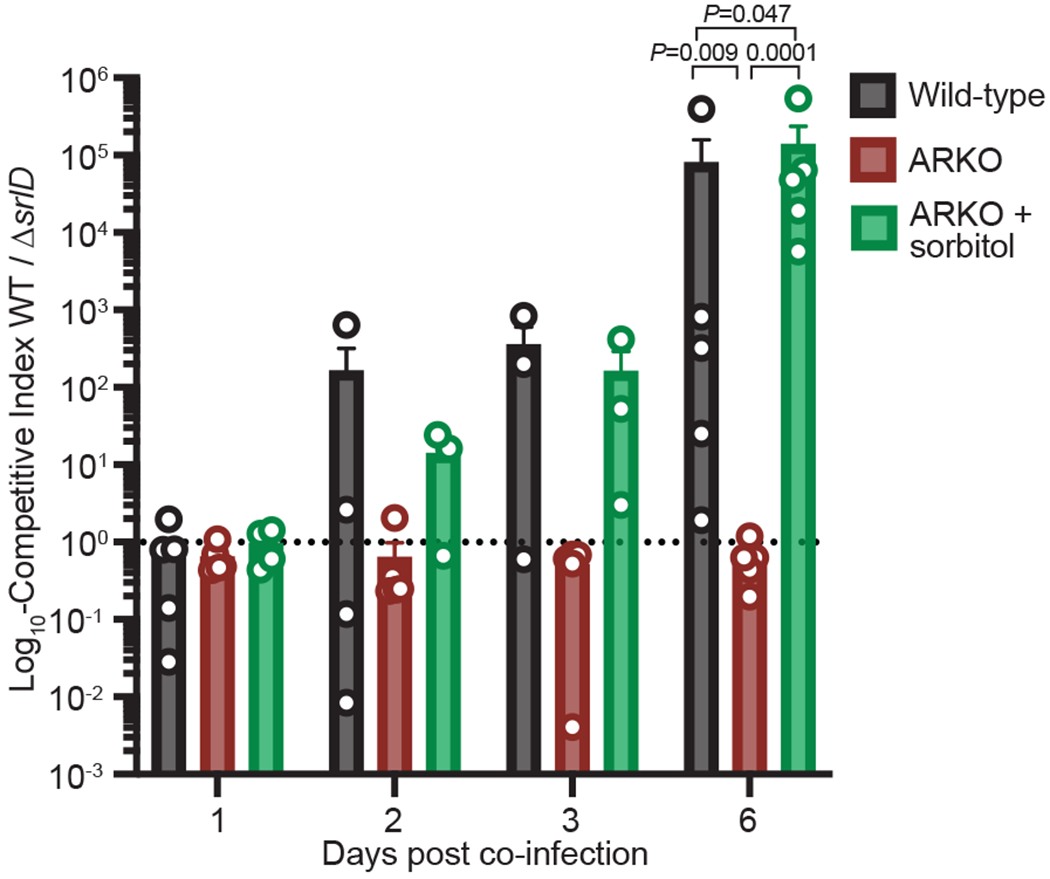
Mice were placed on a fully-defined diet devoid of sorbitol 1 day prior to treatment with Clindamycin. Wild-type C. difficile out-competes the ΔsrlD mutant in wild-type mice, but not in ARKO mice. Administration of exogenous sorbitol to ARKO mice complements host genetic deficiency and restores the competitive advantage to wild-type C. difficile (mean±SEM, n=5 mice/group. F(2,12)=20.02, one-way ANOVA at day 6 with Tukey’s post-hoc multiple comparison). Dashed line at a competitive index value of 1 denotes equal abundance.
Here we demonstrate, for the first time to our knowledge, that C. difficile induces and utilizes a host-derived metabolite in a mouse model of infection (Extended Data Fig. 9). Endogenous levels of sorbitol and mannitol are low; the sugar alcohols are competitively consumed by the commensal microbial community. Numerous studies have shown that upon microbiota disturbance, C. difficile capitalizes upon newly-available resources, including a transient increase in sorbitol and mannitol (Extended Data Fig. 2f, ref.11). Subsequently, diminished levels of perturbation-associated nutrients leads to C. difficile toxin production13. In the presence of toxin-induced inflammation, the expression of aldose reductase increases. The resulting host-produced sorbitol is released from tissue by cellular damage associated with toxin production, and represents a diet-independent resource for the pathogen during inflammation. The trans-kingdom metabolic interactions that we describe here suggest the potential for two distinct therapeutic strategies: one that targets C. difficile metabolism and is relevant to the inflammatory environment that the pathogen creates, and a second that is focused on host pathways or metabolites that support the persistence of C. difficile in vivo.
Methods
Mouse Strains and Husbandry
All animal experiments were performed in accordance with the Stanford Institutional Animal Care and Use Committee. Mice were maintained on a 12-hour light/dark cycle at 69 °F in ambient humidity, fed ad libitum, and maintained in flexible film gnotobiotic isolators for the duration of all experiments (Class Biologically Clean, Madison WI). Swiss-Webster mice were utilized for gnotobiotic experiments and sterility of germ-free mice was verified by 16S PCR amplification and anaerobic culture of feces. Sample sizes were chosen based on litter numbers and controlling for sex and age within experiments. Littermates were grouped at random prior to beginning experimentation by a researcher unaware of experimental design; researchers were unblinded during sample collection.
Aldose reductase knockout mice (ARKO, Akr1b3−/−29,30) in C57/B6 background, C57/B6 wild-type mice (Jackson Laboratories), and Swiss-Webster Excluded Flora mice bred in-house were used for conventional experiments. All experiments were performed between 9-15 weeks of age and animals were sex and age-matched except for in vivo co-infections, for which sexes were mixed equally in all groups. Mice were fed an autoclaved standard diet (Purina LabDiet 5010 for conventional, 5K67 for gnotobiotic) in all experiments except where fully-defined diets lacking sorbitol were used: Figs. 2g,h, Extended Data Figs. 3,4b,c: BioServ Product #S6183, Fig. 4: Teklad Diet TD.86489 or BioServ #S6185. Defined diets were used starting 48 hours prior to C. difficile infection, and cage bedding was replaced immediately subsequent. For experiments in which sorbitol or mannitol (Sigma) were provided in drinking water, 1% (w/v) of the sugar alcohol was filter-sterilized and provided ad libitum starting immediately prior to C. difficile infection.
Bacterial Strains and Growth Conditions
C. difficile culture conditions:
Isogenic C. difficile toxin-deficient mutants and parental strains obtained from refs.31,32 harbored ClosTron insertional mutations in each of the toxin genes. C. difficile strains were cultured anaerobically (85% N2, 10% CO2, 5% H2) on BHIS plates: Brain Heart Infusion Agar (BD Difco) supplemented with 0.5 mg/mL cysteine and 5 mg/mL yeast extract. Liquid medium used was Brain Heart Infusion broth (BD Difco) supplemented with 5 mg/mL yeast extract and 1 mg/mL cysteine. Minimal medium for growth curves, in vitro competition experiments, and in vitro RNA-seq was C. difficile defined medium (CDDM33) with no glucose added.
Selective culturing of C. difficile from stool samples:
Feces were collected from individual mice, 2 biological replicates of 1 μl feces resuspended in 200 μl 1X sterile PBS, serially diluted 1:10, and 10 μl of each dilution plated on CDDC selective medium (Clostridium difficile agar base (Oxoid) supplemented with 7% defibrinated horse blood, 0.5 mg/mL cysteine, 250 μg/mL D-cycloserine, and 16 μg/mL cefoxitin). Colony-forming units (CFUs) were counted after 24 hours anaerobic growth at 37 ºC.
Culture conditions for defined community members:
Bacteroides thetaiotaomicron VPI-5482, Bacteroides fragilis NCTC 9343, Clostridium sporogenes ATCC 15579, Clostridium symbiosum BEI #HM-309, and Bifidobacterium infantis ATCC 15697 were cultured anaerobically. B. thetaiotaomicron and B. fragilis were cultured on BHI Blood Agar plates (Brain Heart Infusion supplemented with 10% defibrinated horse blood and 200 μg/mL gentamycin) or BHIS for Bacteroides (Brain Heart Infusion supplemented with 5 μg/mL hemin and 2 μg/mL vitamin K1), which was also used for liquid medium. C. sporogenes was cultured in TYG, both solid and liquid medium (30 g/L tryptone, 20 g/L yeast extract, 1 g/L sodium thioglycolate; plates were supplemented with 125 μg/mL D-cycloserine, 38 μg/mL sulphamethoxazole, and 2 μg/mL trimethoprim). Escherichia coli K-12 MG1655, Edwardsiella tarda ATCC 23685, and Proteus penneri ATCC 35198, were cultured aerobically in LB medium supplemented with 10 μg/mL vancomycin or BHIS for Bacteroides. B. infantis and C. symbiosum were cultured in MRS (broth or agar, Sigma) and BHIS for Bacteroides.
C. difficile infection
For all mouse experiments, animals were gavaged with 200 μl culture C. difficile grown in 5 mL BHIS broth for 16 hours, corresponding to ~5x10⁷-1x10⁸ CFU/mL. Cultures were prepared for gavage anaerobically in sterile 2 mL cryovials with inner threading. For co-infections, a 1:1 mixture of each strain was used. No antibiotic pre-treatment was used for gnotobiotic experiments (mono-colonizations or defined community experiments). For conventional experiments (SWRF), mice were each gavaged with 1 mg clindamycin filter-sterilized in 200 μl water 24 hours prior to infection. Bedding was replaced immediately after both antibiotic administration and C. difficile gavage.
For weight loss comparisons between wild-type B6J and ARKO mice, mice were administered an antibiotic cocktail ad libitum in water for 3 days (0.4 g kanamycin, 0.035 g/L gentamycin, 0.057 g/L colistin, 0.215 g/L metronidazole, 0.045 g/L vancomycin34), ending 2 days prior to clindamycin treatment. Bedding was replaced at the onset of antibiotic cocktail administration and then mixed between ARKO and wild-type groups upon removal of antibiotic water to mitigate potential host genotype-specific influences on microbiota composition. In accordance with other conventional mouse experiments, clean bedding was replaced at the time of clindamycin treatment as well as C. difficile gavage.
For all data shown, mice were infected with the parental strain C. difficile 630ΔErm (wild-type) or mutant derivatives thereof (Tox- or ΔsrlD), except for tissue qRT-PCR data presented in Fig. 3d, for which mice were infected with the wild-type strain C. difficile R20291 or its triple-toxin isogenic mutant, TcdA−B− CDT−32.
Defined community associations:
For the relative abundance (Extended Data Fig. 1a) data and host polyol pathway expression data (Fig. 3d), germ-free mice were tri-colonized with B. thetaiotaomicron, E. coli, and C. sporogenes. Separate overnight cultures for each strain were combined anaerobically in equal parts and administered via 200 μl gavage. Commensal members equilibrated for ten to thirteen days prior to infection or gavage with anaerobic PBS for the uninfected control. For host expression data, mice were infected with wild-type R20291 or its triple-toxin isogenic knockout, TcdA−B−CDT−32.
For gnotobiotic defined community experiments in Figs. 2g,h, and Extended data Figs. 3,4b,c, overnight cultures of B. fragilis, B. infantis, C. symbiosum, P. penneri, and E. tarda were combined and administered to germ-free mice via gavage in 200 μl. Communities were allowed to stabilize on standard diet for 13 days prior to switching to the fully-defined diet 48 hours before C. difficile infection.
Generation of C. difficile mutant
The C. difficile 630ΔErmΔsrlD mutant was constructed via the pyrE allelic exchange system as previously described35,36. Briefly, regions 1kb up- and down-stream of the targeted deletion region were amplified from genomic DNA and inserted into the pMTL-YN3 vector backbone via Gibson Assembly, transformed into and propagated in Escherichia coli TG1 prior to transformation into E. coli HB101/pRK24 conjugation-proficient cells. The pMTL-YN3 deletion plasmid was transferred to C. difficile 630ΔErmΔpyrE via spot-plate mating conjugation. During conjugation and proximal selection steps, C. difficile and E. coli were cultured anaerobically with higher atmospheric H2 atmospheric levels (85% N2, 5% CO2, 10% H2). Plasmid integrants were selected on BHIS medium supplemented with 15 μg/mL thiamphenicol, 50 μg/mL kanamycin, 16 μg/mL cefoxitin, 5 μg/mL uracil, and deletion mutants selected for on CDDM supplemented with 5 μg/mL uracil and 2 mg/mL 5-fluoroorotic acid (5-FOA). Deletion loci were sequenced verified, after which the mutant pyrE locus was restored with a second round of mutagenesis using the pMTL-YN1C plasmid.
Histopathology scoring
Tissue segments of approximately 1 cm in length were taken from the cecal blind tip and proximal colon of mice, fixed in Formalin for 24-48 hours and then transferred to 70% ethanol for long-term storage. Tissues were embedded in paraffin, sectioned and stained with haematoxylin and eosin (H&E). Two sections from each tissue were given scores of 0-3 for each of the following parameters: inflammatory cell infiltration, mucosal hyperplasia, vascular congestion, epithelial disruption, and submucosal edema. The cumulative lesion score is the sum of each score in these independent categories. Scoring was performed blinded.
16S sequencing and analysis
Total DNA was extracted from frozen fecal samples using the DNeasy PowerSoil HTP 96 kit (Qiagen). Barcoded primers were used to amplify the V3-V4 region of the 16S rRNA gene using 515f and 806r primers, as described previously37,38. Amplicon clean-up was performed using the Ultra Clean 96 well PCR Clean Up kit (Qiagen) prior to fluorescent quantification of DNA yield (Quant-iT), library pooling, and quality control on BioAnalyzer. 300 bp paired-end reads were generated on Illumina MiSeq2500. Demultiplexing was performed with ‘split_libraries_fastq.py’ in QIIME 1.9.139 and reads were assigned to a custom 16S rRNA reference database of the defined community using ‘pick_closed_reference_otus.py’.
RNA-sequencing and analysis
RNA isolation:
RNA from cecal contents was isolated using the Qiagen RNA Power Microbiome kit per the manufacturer’s instructions. RNA from culture was extracted with the Qiagen RNEasy Mini kit. 10 mL culture was spun at 5,000 x g for 10 minutes, resuspended in kit buffer RLT + ßME, and bead-beat using acid-washed glass beads for 5 minutes at 4°C.
Library prep and Sequencing:
Ribosomal RNA was depleted from total RNA isolated from cecal contents using the Illumina Ribo-Zero Gold Epidemiology rRNA Removal Kit. No experimental rRNA removal was used for the in vitro RNA-seq experiment. Depletion of rRNA as well as RNA quality was verified with Agilent Bioanalyzer Prokaryote Total RNA Pico prior to moving forward with library preparation using the Illumina TruSeq mRNA Stranded HT Library Prep kit. Sequencing for the in vivo RNA-seq was performed on an Illumina HiSeq4000 instrument with 100 bp paired-end reads. In vitro RNA-seq was performed on Illumina NovaSeq with 150 bp reads.
Analysis:
Raw, paired reads were imported into CLC Genomics Workbench version 11 with a maximum distance of 1000 bp. In vivo reads were trimmed with a quality limit of 0.05, an ambiguous limit of 2, based on automatic read-through adaptor trimming, with a minimum number of nucleotides of 50. Broken pairs and discarded sequences were not saved. Reads were mapped to the C. difficile 630 genome (RefSeq Accession NC_009089.1) using standard parameters: paired reads were mapped to the gene track with a mismatch cost of 2, insertion cost of 3, deletion cost of 3, length and similarity fractions of 0.8. Read counts for each gene were exported and remaining ribosomal RNA reads were manually removed prior to differential expression analysis in R with DESeq240.
Genomic loci with fewer than 3 reads across all samples were filtered and removed. Standard parameters within DESeq2 were used for differential expression analysis: pairwise comparisons across all groups using the Wald test with a significance threshold of P < 0.01 was used to identify significantly differentially expressed genes. Row-normalized variance stabilization-transformed (vst) counts are presented in the heatmap for Extended Data Fig. 6d.
Pathway enrichment analysis for the in vivo RNA-seq was conducted using ShinyGO41 with the C. difficile String-DB reference using the UniProt code for genes significantly up-regulated in either wild-type or Tox- conditions. Six genomic loci annotated as pseudogenes were not included in the analysis.
Toxin B quantification
Free toxin concentration in feces or cecal contents was quantified with anti-tcdB-HRP as part of the tgcBIOMICS Toxin B ELISA kit (TGC-E002-1). 25-50 mg frozen fecal sample was thawed, weighed, and resuspended in 450 μl dilution buffer prior to proceeding via the manufacturer’s instructions. Toxin levels were quantified (ng toxin per g feces) using an external standard curve (40 ng/mL-0.31 ng/mL) and normalized to the absolute abundance of C. difficile levels (CFU/mL) as previously described13.
RT-qPCR
Total RNA from feces or culture was extracted as described above. RNA from frozen host proximal colon tissue was extracted with the RNEasy Mini Kit: 25-30 mg tissue was bead-beat with acid-washed glass beads in 600 μl RLT + ßME for 5 min at 4°C prior to proceeding with the kit protocol. cDNA was generated using random primers and Superscript III Reverse Transcriptase per the manufacturer’s instructions; RNase OUT was included. QPCR was performed with SYBR Brilliant III on an Agilent MX3000P instrument in 20 μl volumes with 0.3 μl reference dye added. Changes to expression were calculated by normalizing Ct value to a housekeeping gene and a control condition with the delta-delta Ct method.
Competition assays
In vivo and in vitro competition between wild-type and ΔsrlD C. difficile was assessed using qPCR. Primer pairs (listed in Supplementary Table 4) targeting the wild-type srlD locus (wild-type), surrounding the srlD deletion (ΔsrlD, used for in vivo competition experiments), or the LacZ locus, which is complemented in tandem with the restored pyrE gene using the pMTL-YN1C plasmid (ΔsrlD, used for in vitro competition experiments) were validated with eight 1:4 serial dilutions of purified genomic DNA from wild-type or ΔsrlD C. difficile. QPCR reactions were performed as described above. For in vitro competition assays, the ratio of each genotype was calculated relative to the C. difficile housekeeping gene rpoA, normalizing to levels with 0% sorbitol. For in vivo competition assays, the efficiency value (E) for each primer pair was calculated as 10(1/−slope) of log10(DNA input) against Ct value. The competitive index of each genotype was calculated as follows: E−Ct wild-type primer pair / E−Ct ΔsrlD primer pair. A competitive index of 1 indicates that each strain is at equal abundance.
Streptozotocin-induced hyperglycemia
A single high-dose injection of Streptozotocin was used to induce hyperglycemia in mice. Mice were fasted for 4-6 hours prior to IP injection of 350 μl 26 mg/mL Streptozotocin prepared in sterile sodium citrate buffer pH 4.5. Conventional mice were fasted for 4-6 hours prior to blood glucose measurements via tail vein snip with OneTouch blood glucose monitor. Blood glucose measurements taken in gnotobiotic mice at experimental endpoint were not fasted.
Sorbitol and mannitol quantification
A GCMS-based mass spectrometry assay was developed to quantify mannitol and sorbitol from biological samples. Fecal samples were dried at 70°C for 1-1.5 hours, weighed, and metabolites were extracted by bead-beating in 500 μl LCMS-grade MeOH. Samples were centrifuged at 16,000 x g for 10 minutes. 200 μl supernatant was mixed thoroughly with 400 μl dichloromethane and d8-sorbitol was added as an internal standard. Samples were evaporated completely at 70°C under high-purity nitrogen, and then derivatized with trimethylsilyl reagents for 1 hour at 70°C using a 8:2:1 ratio of pyridine:hexamethyldisilazane:chlorotrimethylsilane. Samples were centrifuged at 16,000 x g for 10 minutes; supernatant was transferred to autosampler vials and 1 μl injected into an Agilent 7890A GC System equipped with 5975C inert MSD with Triple-Axis Detector using electron ionization (EI). A J&W DB-5MS UI column (30 m length, 0.250 mm ID, 0.25 film thickness; Agilent PN 122-5332UI) was run at 1 mL/min helium, with the following temperature program: 180°C, 1 minute initial hold; ramp 1 5°C/min to 215°C; ramp 2 40°C/min to 320°C, 5 minute hold (total run time 15.625 minutes). Ion chromatogram extraction and peak integration were performed using Agilent ChemStation Enhanced Data Analysis software. Product ions used to identify mannitol and sorbitol: m/z 205, 217, and 319. Product ions for d8-sorbitol: m/z 208, 220, and 323. Sorbitol and Mannitol standards were derivatized as described above and used to generate standard curves to enable sugar alcohol quantification.
Analysis of published datasets
Tissue and cell-specific expression of aldose reductase from Tabula muris (https://tabula-muris.ds.czbiohub.org/)24 was searched for Akr1b3. Two single-cell sequencing studies targeting the large intestine25,26 were searched for all isoforms of aldose reductase and sorbitol dehydrogenase using the Single Cell Portal (https://singlecell.broadinstitute.org/single_cell). The tissue type (immune, epithelial, stromal) was designated using metadata provided by each study. For aldose reductase expression response to inflammatory conditions, data was downloaded and cells with non-zero expression levels were included in the analysis. Pairwise Wilcoxon rank-sum tests (implemented with rstatix) were conducted across all immune cell types; those with significantly increased aldose reductase expression in inflammatory conditions are shown.
Aldose reductase expression in response to purified C. difficile TcdA injection in the cecum27 was compared to the sham control at 16 hours and was implemented in GEO2R (NCBI, GSE44091). We performed a differential correlation analysis (DGCA)42 to identify genes positively correlated with aldose reductase in response to TcdA. The three microarray probes annotated as Akr1b3 were used as input for the differential correlation analysis. An adjusted P-value cut-off of P < 0.05 was used to identify genes that positively correlate in response to TcdA and negatively or do not correlate in control mice. This gene set was used to conduct gene set enrichment analysis with Bonferroni multiple hypothesis correction using Panther (Panther.org) with the Reactome database.43
Statistical Analysis
All statistics were performed in R (R Core Team, 2018) and Prism (GraphPad), and visualized with ggplot245, complexHeatmap, and Prism.
Extended Data
Extended Data Fig. 1. C. difficile toxin production confers an advantage and alters metabolic pathways in vivo.
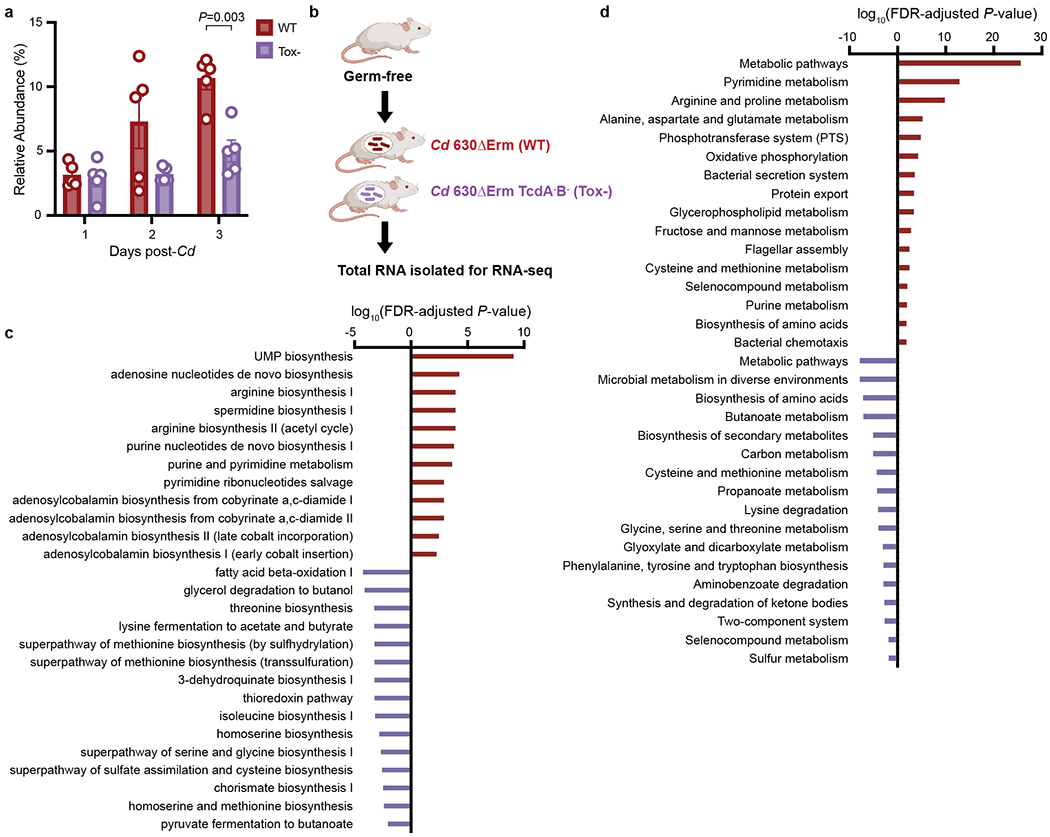
a, Toxin production (wild-type) confers an advantage in C. difficile relative abundance in the presence of a defined community (n=5 mice/group, mean ± SEM, multiple unpaired t-tests with Welch’s correction, two-stage step-up procedure of Benjaini, Krieger, and Yekutieli.). b, Transcriptional profiling experimental design: germ-free mice on standard diet were mono-colonized with either wild-type C. difficile 630ΔErm (wild-type) or 630ΔErmTcdA-B- (Tox-). Three days post-infection, total RNA was isolated from cecal contents for RNA-seq. Significantly enriched Ecocyc (c) and KEGG (d) pathways based on genes differentially expressed during wild-type (positive, red bars, n=4 mice) or Tox- C. difficile (negative, purple, n=3 mice) infection (hypergeometric distribution followed with FDR correction).
Extended Data Fig. 2. Sorbitol impacts C. difficile growth, gene expression, and increases in the mouse gut after antibiotic treatment.
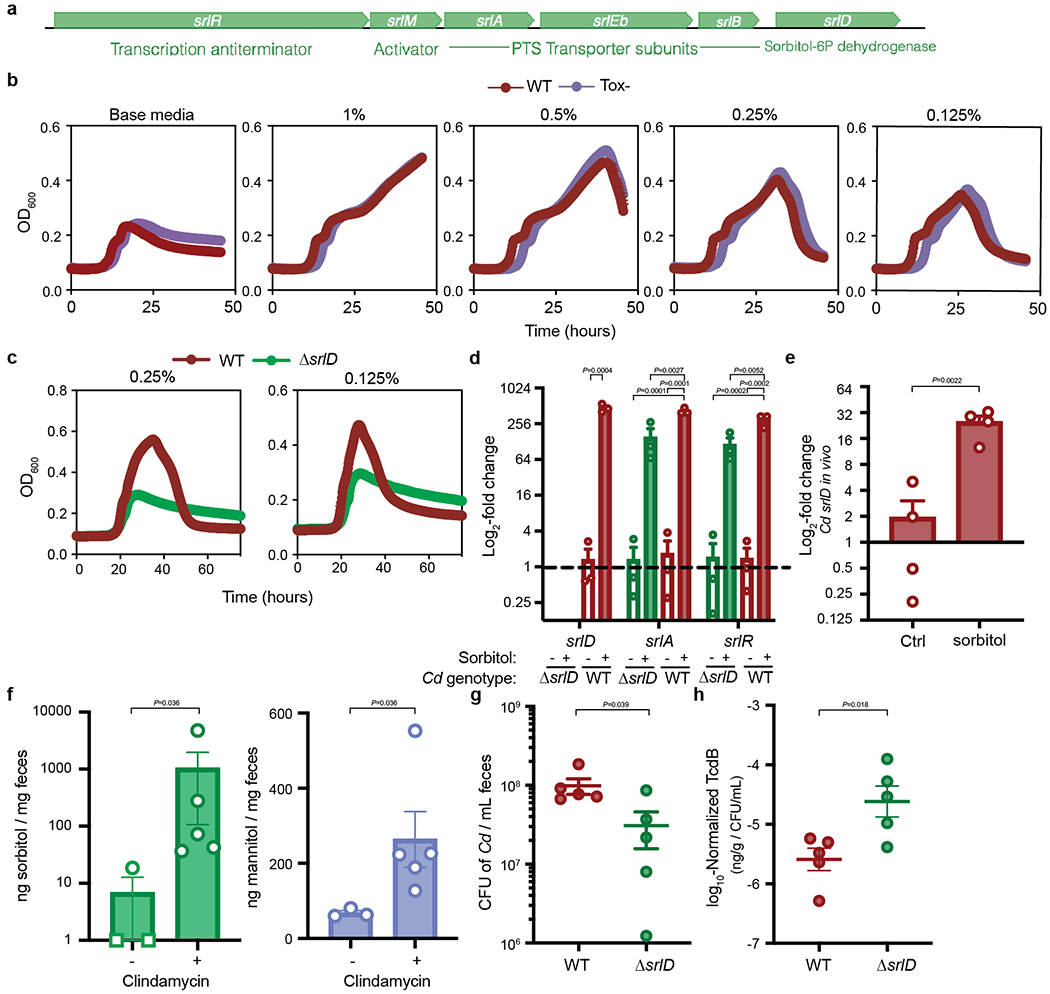
a, Schematic overview of the sorbitol utilization locus in C. difficile. The operon contains three PTS transporter subunits, a 6-phosphate dehydrogenase, an activator and an anti-terminator. b, wild-type (red) and Toxin-deficient (Tox-, purple) C. difficile grow comparably in minimal medium supplemented with various concentrations of sorbitol (mean±SEM, n=5 replicates/condition). c, ΔsrlD is unable to achieve increased growth yield with 0.25% or 0.125% w/v sorbitol supplemented to minimal medium (mean±SEM, n=5 replicates/condition). d, Addition of sorbitol to minimal medium leads to up-regulation of genes (srlD, annotated as sorbitol dehydrogenase; srlA, PTS transporter subunit; srlR, transcription anti-terminator) compared to base medium (mean±SEM, n=3 replicates/condition. Expression levels normalized to wild-type C. difficile in unsupplemented base medium, dotted line indicates baseline expression of 1; srlD: unpaired two-tailed t-test, srlA and srlR: one-way ANOVA with Tukey’s post-hoc comparisons; srlA: F(3,8)=31.85, srlR: F(3,8)=27.25.). e, Sorbitol administered to mice mono-colonized with wild-type C. difficile leads to induction of srlD in vivo (mean±SEM, n=4/group, unpaired two-tailed t-test). f, 1 mg Clindamycin treatment (n=5) leads to increased sorbitol and mannitol in stool from conventional mice on standard diet (n=3, mean±SEM, two-tailed Mann-Whitney. Sorbitol levels were below the limit of detection for two of three pre-antibiotic treatment samples and are denoted by squares at a value of 1. Samples are combined from 3 independent experiments). g, ΔsrlD C. difficile is attenuated in colonization of conventional mice fed a standard diet compared to wild-type C. difficile (n=5 mice/group, mean±SEM, unpaired two-tailed t-test with Welch’s correction). h, Toxin B detected by ELISA in fecal pellets of conventional mice 24 hours post-infection with wild-type or ΔsrlD C. difficile; values were normalized to the absolute abundance of C. difficile from the same stool sample (n=5 mice/group, mean±SEM, unpaired two-tailed t-test with Welch’s correction).
Extended Data Fig. 3. Dietary sorbitol or mannitol availability increases C. difficile density in vivo.
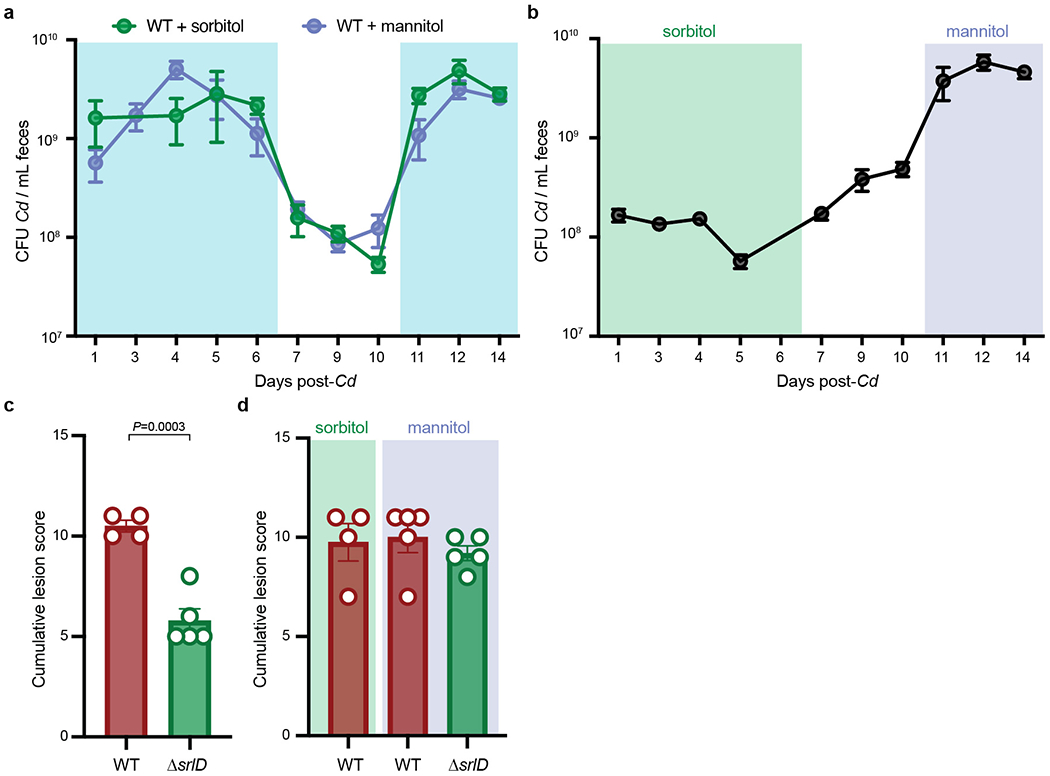
a, 1% sorbitol (green, n=4 mice) or 1% mannitol (purple, n=5 mice) were provided in drinking water to gnotobiotic mice harboring a defined consortium of bacteria for 6 days (days 0-6). Absolute abundance of wild-type C. difficile decreases when sorbitol and mannitol are removed from drinking water (days 7-10). Replacing 1% sorbitol and mannitol in drinking water (days 11-14) restores increase in absolute abundance (mean±SEM, shaded boxes denote sorbitol or mannitol supplementation). b, 1% sorbitol was provided in drinking water (days 0 to 6, green box) to mice colonized with a defined community and subsequently infected with ΔsrlD C. difficile. Supplementation of 1% mannitol in drinking water leads to an increase in ΔsrlD abundance (days 11-14, purple box) relative to sorbitol supplementation (mean±SEM, n=5 mice). c, ΔsrlD C. difficile (n=5 mice) incites a lower histopathological score than wild-type C. difficile (n=4 mice) when 1% sorbitol is supplemented in drinking water (12 days post-infection, mean+SEM, unpaired two-tailed Student’s t-test). d, No significant differences in blinded histopathological scoring 14 days post-infection in the cecal blind tip of mice infected with wild-type C. difficile when sorbitol (n=4) or mannitol (n=5) is supplemented (as in a) or when mannitol is supplemented to ΔsrlD C. difficile (as in b, n=5, mean±SEM).
Extended Data Fig. 4. Excess sorbitol represses toxin production in vitro and in vivo.
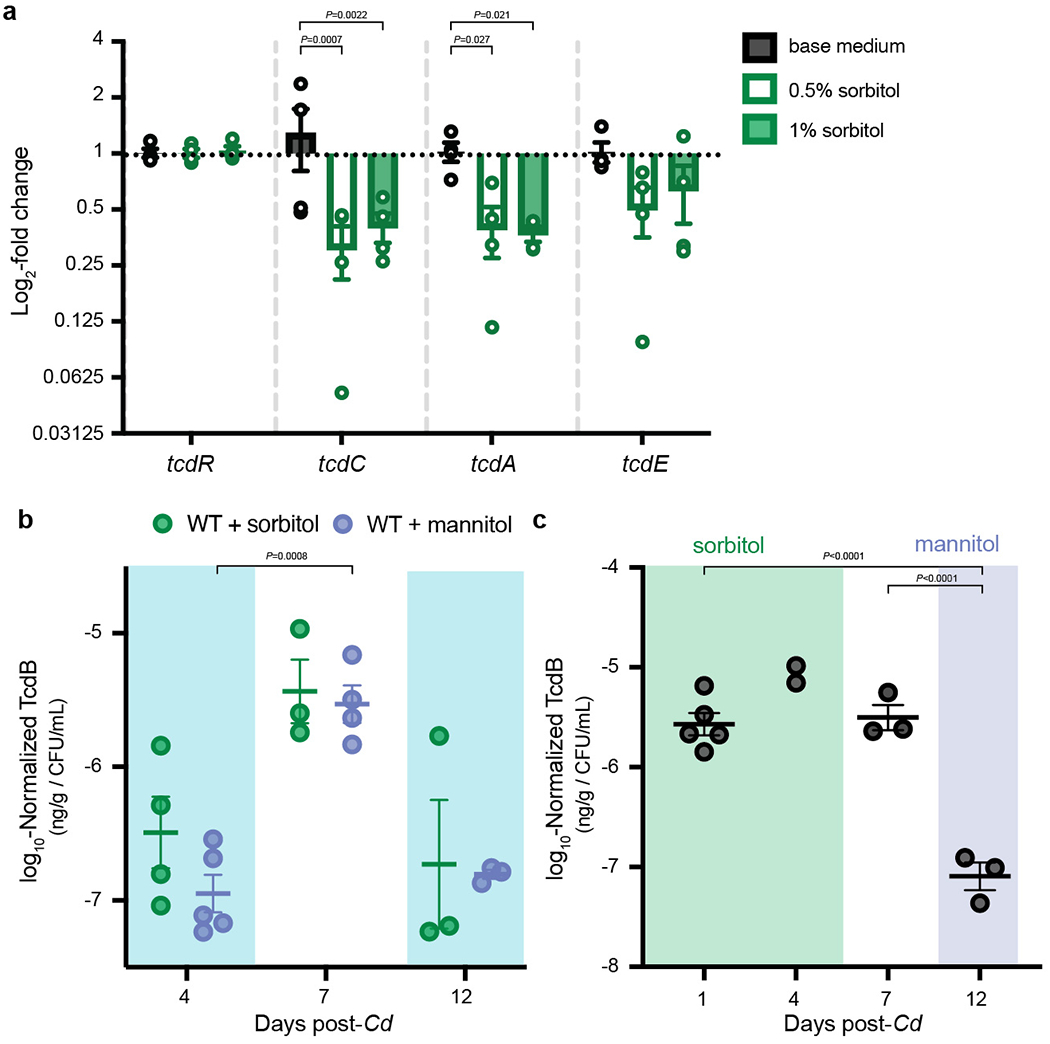
a, Minimal medium supplemented with 1% or 0.5% sorbitol leads to significantly lower expression of tcdA and tcdE after 8 hours growth compared to un-supplemented base medium (mean±SEM, n=4 replicates/condition. Two-way ANOVA across genes: F(3,36)=3.429, P=0.0271; across sorbitol supplementations: F(2,36)=11.17, P=0.0002 with Dunnett’s multiple comparisons test using base medium as the control for sorbitol supplementation comparisons within each gene). b, Presence of sorbitol (n=4 mice) or mannitol (n=5) in drinking water leads to relatively lower toxin production in vivo (days 4 and 12, sugar alcohol supplementation denoted by shaded boxes) compared to when sorbitol or mannitol are absent (day 7; mean±SEM, mixed effects analysis with Sidak’s multiple comparisons: day is significant F(0.8915,7.132)=18.37, P = 0.004, mannitol vs. sorbitol is not). c, Addition of exogenous mannitol (day 12) leads to lower production of toxin in vivo in ΔsrlD compared to sorbitol supplementation (days 1, 4) or regular water (day 7; n=5 mice, mean±SEM, one-way ANOVA F(2,8)=45.18 with Tukey’s post-hoc multiple comparisons. Day 4 was excluded from the ANOVA, as only 2 data points are present).
Extended Data Fig. 5. Streptozotocin treatment increases fasting blood glucose levels in conventional and mono-colonized mice.
a, Development of streptozotocin (STZ)-induced hyperglycemia model in Swiss-Webster Excluded Flora mice. Mice were fasted for 4-6 hours prior to measurement of blood glucose levels via tail vein snip. An initial injection (Day 0, indicated by dashed arrow) of 4.5 mg streptozotocin was insufficient to increase blood glucose levels. A larger dose of 9.1 mg streptozotocin administered on day 4 (solid arrow) was sufficient to increase blood glucose (mean±SEM, n=6 mice) and was used for subsequent experiments with C. difficile infection. b, Unfasted blood glucose in germ-free mice mono-colonized with wild-type or ΔsrlD at 3 days post-infection (mean±SEM, one-way ANOVA F(3,20)=36.73 with Tukey’s post-hoc comparisons); streptozotocin-treated groups (n=7 mice/group) were treated with streptozotocin via IP injection 4 days prior to C. difficile infection and had significantly elevated blood glucose compared to un-treated controls (n=5/group). c, C. difficile gene expression of the sorbitol utilization locus in conventional (wild-type) or streptozotocin-treated (streptozotocin) mice. An outlier (Fig. 3c, tested for with robust nonlinear regression, Q=0.2%) from one RNA sample isolated from one mouse is indicated by the filled circle (n=5 mice/group, bars denote median). d, Streptozotocin treatment does not alter toxin production in vivo. C. difficile Toxin B quantified in feces of conventional mice infected with wild-type C. difficile 24 hours post-infection (n=5 mice/group, mean±SEM).
Extended Data Fig. 6. Sorbitol and mannitol lead to distinct metabolic programs in vitro.
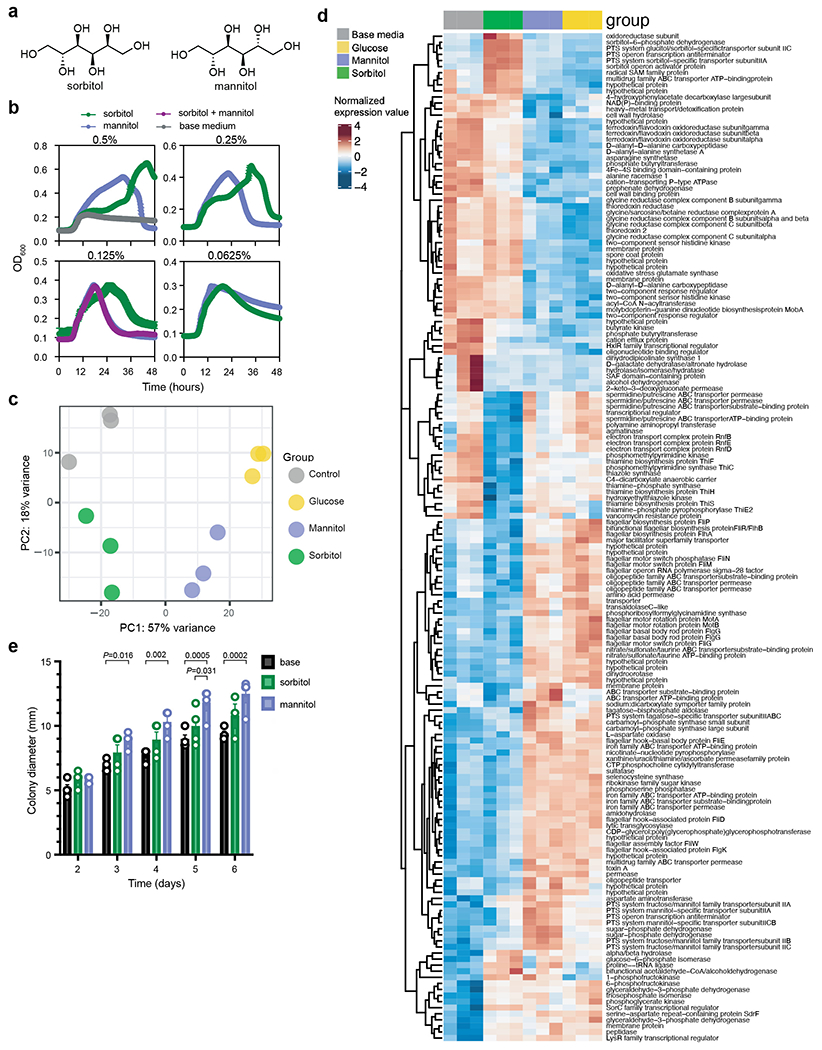
a, Chemical structures of isomers sorbitol and mannitol. b, Sorbitol and mannitol added to minimal medium engender distinct growth kinetics (mean±SEM, n=5 replicates/condition). c, Principal components analysis of variance stabilizing-transformed RNA-seq counts from C. difficile grown for 11 hours in minimal medium (control, grey), or minimal medium supplemented with 0.25% sorbitol (green), mannitol (purple), or glucose (yellow). d, Significantly differentially expressed genes between sorbitol supplementation and base medium or mannitol supplementation (n=3 replicates/condition; colors represent row-normalized variance stabilizing-transformed counts. P<0.01, Wald test with Bonferroni-adjusted P value.) e, Mannitol supplementation to 0.3% soft agar plates leads to significantly increased motility compared to base medium (days 3-6) and sorbitol supplementation (day 5). Sorbitol supplementation does not lead to a significant increase in motility compared to un-supplemented motility plates (n=4 replicates/condition, mean±SEM, two-way ANOVA significant by day F(4,44)=53.50 and growth condition F(2,44)=25.55, Tukey’s post-hoc comparisons).
Extended Data Fig. 7. Aldose reductase is an immune cell-associated gene.
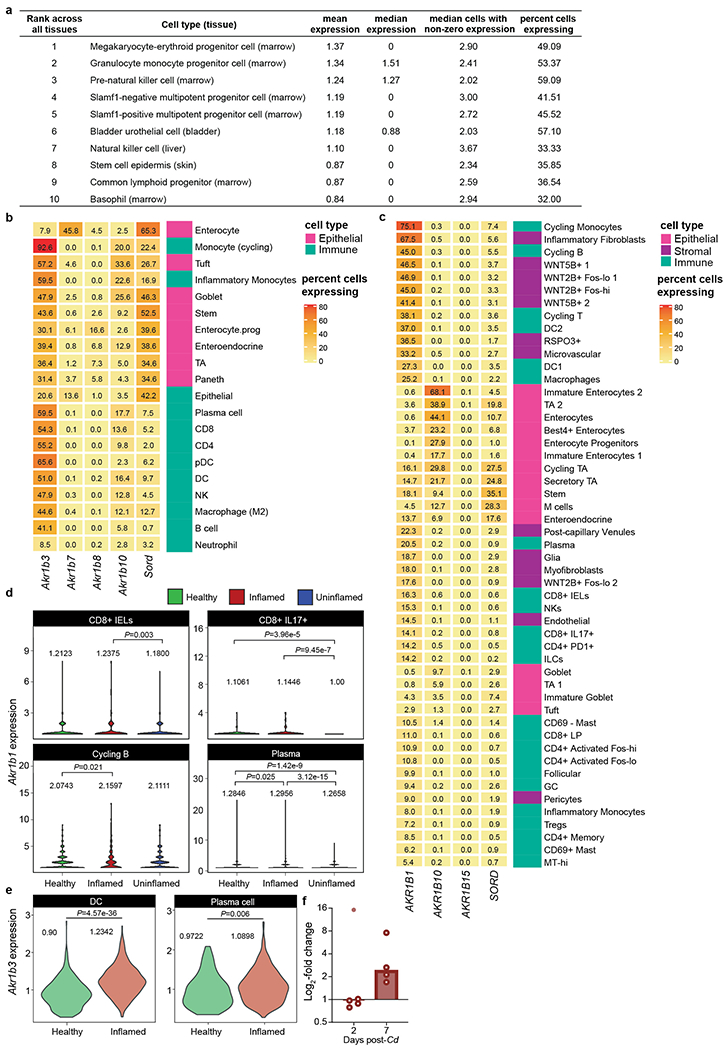
a, Top 10 cell types with highest Akr1b3 expression across 20 mouse organs demonstrates high prevalence of aldose reductase in immune-associated cell types24. b, Percent of cells in mouse colonic tissue expressing isoforms of aldose reductase and sorbitol dehydrogenase. c, Percent of different cell types in human colonic explants expressing the three isoforms of aldose reductase and sorbitol dehydrogenase. d, Akr1b1 expression (log2-TP10K+1) in cell types exhibiting significantly increased aldose reductase expression in inflammatory colonic explants from humans with ulcerative colitis (Inflamed) compared to within-subject non-inflamed tissue (Uninflamed) vs. healthy controls that do not have ulcerative colitis (Healthy; pairwise Wilcoxon-rank sum test across all immune cell types using non-zero expression levels. Means for each cell type are shown.). e, Dendritic cells (DC) and plasma cells in mouse large intestine exhibited significant increase in Akr1b3 expression (log2-TPM+1) during infection with H. polygyrus (Wilcoxon-rank sum test across all immune cell types using non-zero expression levels. Means for each cell type shown.). f, Expression of Akr1b3 in the proximal colon of conventional mice infected with wild-type C. difficile. An outlier (Fig. 3e, detection method: robust nonlinear regression, Q=0.2%) is denoted by the filled point, bars denote median.
Extended Data Fig. 8. Epalrestat inhibits C. difficile growth in vitro and in vivo.
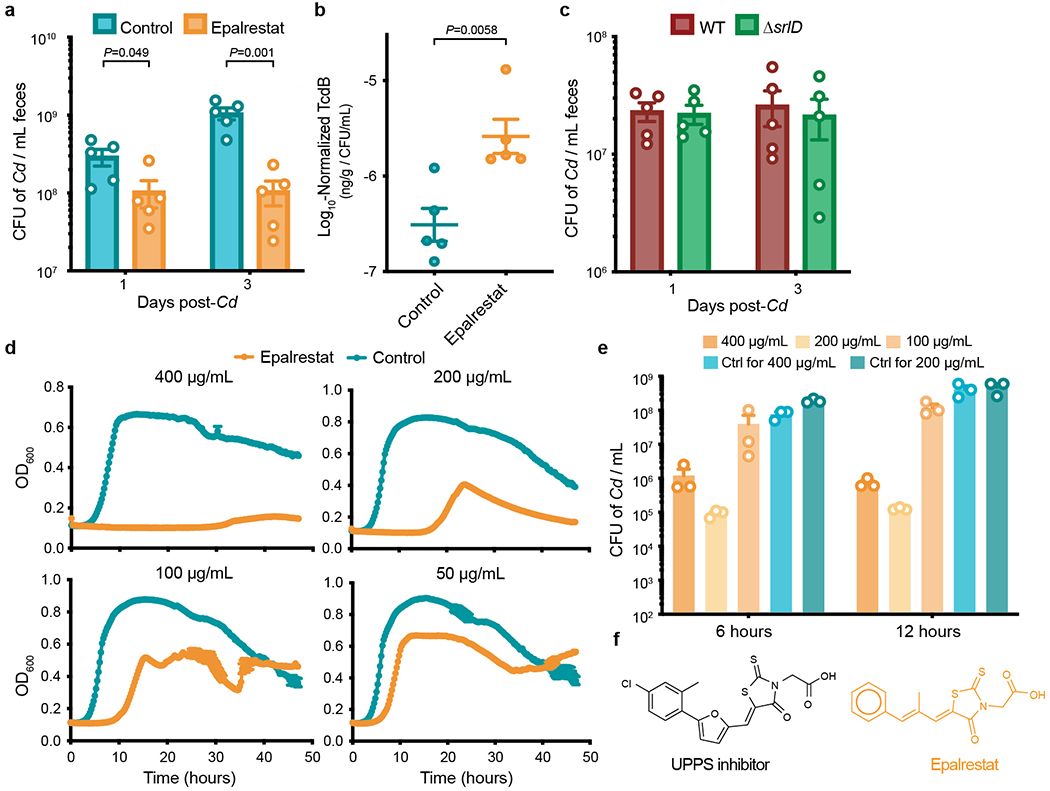
a, Germ-free mice were mono-colonized with wild-type C. difficile and gavaged with the aldose reductase inhibitor epalrestat or vehicle control once daily. Epalrestat treatment significantly reduces C. difficile abundance (n=5 mice/group, mean±SEM, unpaired two-tailed t-tests). b, In the presence of epalrestat, wild-type C. difficile produces relatively more toxin in vivo (n=5 mice/group, mean±SEM, unpaired two-tailed t-test). c, ΔsrlD mutant colonizes germ-free mice fed standard diet equally well as wild-type C. difficile (n=5 mice/group, mean±SEM). d, Epalrestat inhibits wild-type C. difficile 630ΔErm growth in rich medium in a dose-dependent manner (n=5 replicates/condition, mean±SEM). e, Absolute abundance of wild-type C. difficile after 6 or 12 hours of growth in rich medium is inhibited due to incubation with epalrestat (mean+SEM, n=3 replicates/condition). f, Chemical structures of aldose reductases inhibitor epalrestat and an antibiotic with activity against cis-prenyl transferase undecaprenyl diphosphate synthase (UPPS).
Extended Data Fig. 9. A model for C. difficile sorbitol utilization.
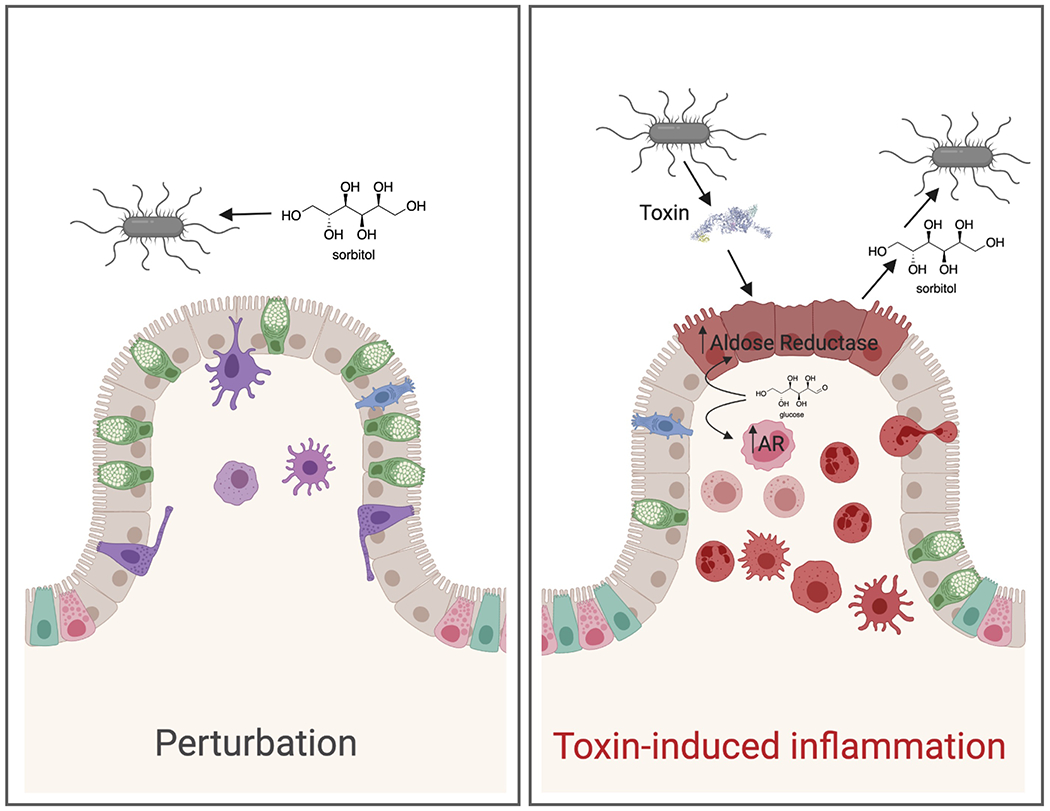
C. difficile can utilize diet-derived sorbitol, which spikes after disturbance to the microbiota (left). Toxin-induced tissue damage (right) leads to upregulation of host aldose reductase in the epithelium as well as recruitment of immune cells that express aldose reductase. C. difficile is able to utilize host-derived sorbitol. Created with BioRender.com.
Supplementary Material
Acknowledgements
The authors would like to give special thanks to Steven Higginbottom for assistance with all animal experiments. Allis Chien at the Stanford University Mass Spectrometry Facility provided assistance with GC-MS protocol development. Sarah Kuehne and Nigel Minton from the University of Nottingham provided the toxin-mutant C. difficile strains and Aimee Shen provided reagents for generation of new C. difficile mutants. Aruni Bhatnagar and Donald Mosely from the University of Louisville generously provided the aldose reductase knockout mice. Dawn Davis shared protocols and advice regarding the development of the streptozotocin model of hyperglycemia. BioRender was used to aid in generation of Extended Data Figs. 1b and 9 (Created with BioRender.com). This study was supported by R01-DK08502510 (special thanks to Bob Karp for his service and support at NIDDK) and Chan Zuckerberg Biohub, and a Ford Foundation Fellowship and NSF Graduate Fellowship to K.M.P. The authors thank all members of the Sonnenburg laboratory who provided thoughtful feedback throughout the development of the project.
Footnotes
Code Availability
Code is available at https://github.com/kpruss/Cdiff-AR.
Competing Interests
The authors declare no competing interests.
Data Availability
Raw RNA-seq source data is available through the NCBI Sequence Read Archive (SRA, https://www.ncbi.nlm.nih.gov/sra). In vivo RNA-seq (Figs. 1b., 2a, Extended Data Figs. 1c, 1d, Supplementary Table 2): PRJNA666929, in vitro RNA-seq (Extended Data Fig. 6, Supplementary Table 3): PRJNA667108. Publicly available single-cell RNA-seq data (Extended Data Figs. 7b–e): Single Cell Portal accession numbers SCP259, SCP241 (https://singlecell.broadinstitute.org/single_cell). Microarray data (Fig. 3g): GSE44091 (https://www.ncbi.nlm.nih.gov/geo/).
References
- 1.Lessa FC et al. Burden of Clostridium difficile infection in the United States. N. Engl. J. Med 372, 825–834 (2015). [DOI] [PMC free article] [PubMed] [Google Scholar]
- 2.Rivera-Chávez F & Bäumler AJ The pyromaniac inside you: Salmonella metabolism in the host gut. Annu. Rev. Microbiol 69, 31–48 (2015). [DOI] [PubMed] [Google Scholar]
- 3.Faber F et al. Host-mediated sugar oxidation promotes post-antibiotic pathogen expansion. Nature 534, 697–699 (2016). [DOI] [PMC free article] [PubMed] [Google Scholar]
- 4.Lopez CA et al. Virulence factors enhance Citrobacter rodentium expansion through aerobic respiration. Science 353, 1249–1253 (2016). [DOI] [PMC free article] [PubMed] [Google Scholar]
- 5.Bäumler AJ & Sperandio V Interactions between the microbiota and pathogenic bacteria in the gut. Nature 535, 85–93 (2016). [DOI] [PMC free article] [PubMed] [Google Scholar]
- 6.Rivera-Chávez F & Mekalanos JJ Cholera toxin promotes pathogen acquisition of host-derived nutrients. Nature 572, 244–248 (2019). [DOI] [PMC free article] [PubMed] [Google Scholar]
- 7.El Feghaly RE et al. Markers of intestinal inflammation, not bacterial burden, correlate with clinical outcomes in clostridium difficile infection. Clin. Infect. Dis 56, 1713–1721 (2013). [DOI] [PMC free article] [PubMed] [Google Scholar]
- 8.Hryckowian AJ, Pruss KM & Sonnenburg JL The emerging metabolic view of Clostridium difficile pathogenesis. Curr. Opin. Microbiol 35, 42–47 (2017). [DOI] [PMC free article] [PubMed] [Google Scholar]
- 9.Yamada M & Saier H Glucitol-specific enzymes of the phosphotransferase system in Escherichia coli. J. Biol. Chem 262, 5455–5463 (1987). [PubMed] [Google Scholar]
- 10.Svensäter G, Edwardsson S & Kalfas S Purification and properties of sorbitol‐6‐phosphate dehydrogenase from oral streptococci. Oral Microbiol. Immunol 7, 148–154 (1992). [DOI] [PubMed] [Google Scholar]
- 11.Theriot CM et al. Antibiotic-induced shifts in the mouse gut microbiome and metabolome increase susceptibility to Clostridium difficile infection. Nat. Commun 5, 3114 (2014). [DOI] [PMC free article] [PubMed] [Google Scholar]
- 12.Moing A Sugar alcohols as carbohydrate reserves in some higher plants. Dev. Crop Sci 26, 337–358 (2000). [Google Scholar]
- 13.Hryckowian AJ et al. Microbiota-accessible carbohydrates suppress Clostridium difficile infection in a murine model. Nat. Microbiol 3, 662–669 (2018). [DOI] [PMC free article] [PubMed] [Google Scholar]
- 14.Collins J et al. Dietary trehalose enhances virulence of epidemic Clostridium difficile. Nature 553, 291–294 (2018). [DOI] [PMC free article] [PubMed] [Google Scholar]
- 15.Kumar N et al. Adaptation of host transmission cycle during Clostridium difficile speciation. Nat. Genet 51, 1315–1320 (2019). [DOI] [PubMed] [Google Scholar]
- 16.Rienzi SC Di & Britton, R. A. Adaptation of the gut microbiota to modern dietary sugars and sweeteners. Adv Nutr 00, 1–14 (2019). [DOI] [PMC free article] [PubMed] [Google Scholar]
- 17.Tang WH, Martin KA & Hwa J Aldose reductase, oxidative stress, and diabetic mellitus. Front. Pharmacol 3, 1–8 (2012). [DOI] [PMC free article] [PubMed] [Google Scholar]
- 18.Pal PB, Sonowal H, Shukla K, Srivastava SK & Ramana KV Aldose reductase mediates NLRP3 inflammasome-initiated innate immune response in hyperglycemia-induced thp1 monocytes and male mice. Endocrinology 158, 3661–3675 (2017). [DOI] [PMC free article] [PubMed] [Google Scholar]
- 19.Kashima K, Sato N, Sato K, Shimizu H & Mori M Effect of epalrestat, an aldose reductase inhibitor, on the generation of oxygen-derived free radicals in neutrophils from streptozotocin-induced diabetic rats. Endocrinology 139, 3404–3408 (1998). [DOI] [PubMed] [Google Scholar]
- 20.Antunes A et al. Global transcriptional control by glucose and carbon regulator CcpA in Clostridium difficile. Nucleic Acids Res. 40, 10701–10718 (2012). [DOI] [PMC free article] [PubMed] [Google Scholar]
- 21.Shakov R, Salazar RS, Kagunye SK, Baddoura WJ & DeBari VA Diabetes mellitus as a risk factor for recurrence of Clostridium difficile infection in the acute care hospital setting. Am. J. Infect. Control 39, 194–198 (2011). [DOI] [PubMed] [Google Scholar]
- 22.Hassan SA, Rahman RA, Huda N, Wan Bebakar WM & Lee YY Hospital-acquired Clostridium difficile infection among patients with type 2 diabetes mellitus in acute medical wards. J. R. Coll. Physicians Edinb 43, 103–107 (2013). [DOI] [PubMed] [Google Scholar]
- 23.Ramana KV Aldose reductase: New insights for an old enzyme. Biomol. Concepts 2, 103–114 (2011). [DOI] [PMC free article] [PubMed] [Google Scholar]
- 24.Schaum N et al. Single-cell transcriptomics of 20 mouse organs creates a Tabula Muris. Nature 562, 367–372 (2018). [DOI] [PMC free article] [PubMed] [Google Scholar]
- 25.Biton M et al. T helper cell cytokines modulate intestinal stem cell renewal and differentiation. Cell 175, 1307–1320 (2018). [DOI] [PMC free article] [PubMed] [Google Scholar]
- 26.Smillie CS et al. Intra- and inter-cellular rewiring of the human Colon during ulcerative Ccolitis. Cell 178, 714–730 (2019). [DOI] [PMC free article] [PubMed] [Google Scholar]
- 27.D’Auria KM et al. In vivo physiological and transcriptional profiling reveals host responses to Clostridium difficile toxin A and toxin B. Infect. Immun 81, 3814–3824 (2013). [DOI] [PMC free article] [PubMed] [Google Scholar]
- 28.Whitaker WR, Shepherd ES & Sonnenburg JL Tunable expression tools enable single-cell strain distinction in the gut microbiome. Cell 169, 538–546 (2017). [DOI] [PMC free article] [PubMed] [Google Scholar]
- 29.Tang J, Du Y, Petrash JM, Sheibani N & Kern TS Deletion of aldose reductase from mice inhibits diabetes-induced retinal capillary degeneration and superoxide generation. PLoS One 8, e62081 (2013). [DOI] [PMC free article] [PubMed] [Google Scholar]
- 30.Ho HT et al. Aldose reductase-deficient mice develop nephrogenic diabetes insipidus. Mol. Cell. Biol 20, 5840–5846 (2000). [DOI] [PMC free article] [PubMed] [Google Scholar]
- 31.Kuehne S. a et al. The role of toxin A and toxin B in Clostridium difficile infection. Nature 467, 711–713 (2010). [DOI] [PubMed] [Google Scholar]
- 32.Kuehne SA et al. Importance of toxin A, toxin B, and CDT in virulence of an epidemic Clostridium difficile strain. J. Infect. Dis 209, 83–86 (2014). [DOI] [PMC free article] [PubMed] [Google Scholar]
- 33.Karasawa T, Ikoma S & Yamakawa K A defined growth medium for C. difficile. Microbiology 141, 371–375 (1995). [DOI] [PubMed] [Google Scholar]
- 34.Ng KM et al. Microbiota-liberated host sugars facilitate post-antibiotic expansion of enteric pathogens. Nature 502, 96–9 (2013). [DOI] [PMC free article] [PubMed] [Google Scholar]
- 35.Ng YK et al. Expanding the repertoire of gene tools for precise manipulation of the Clostridium difficile genome: allelic exchange using pyrE alleles. PLoS One 8, e56051 (2013). [DOI] [PMC free article] [PubMed] [Google Scholar]
- 36.Minton NP et al. A roadmap for gene system development in Clostridium. Anaerobe 41, 104–112 (2016). [DOI] [PMC free article] [PubMed] [Google Scholar]
- 37.Thompson LR et al. A communal catalogue reveals Earth’s multiscale microbial diversity. Nature 551, 457–463 (2017). [DOI] [PMC free article] [PubMed] [Google Scholar]
- 38.Caporaso JG et al. Ultra-high-throughput microbial community analysis on the Illumina HiSeq and MiSeq platforms. ISME J. 6, 1621–1624 (2012). [DOI] [PMC free article] [PubMed] [Google Scholar]
- 39.Caporaso JG et al. QIIME allows analysis of high-throughput community sequencing data. Nat. Methods 7, 335–336 (2010). [DOI] [PMC free article] [PubMed] [Google Scholar]
- 40.Love MI, Huber W & Anders S Moderated estimation of fold change and dispersion for RNA-seq data with DESeq2. Genome Biol. 15, 550 (2014). [DOI] [PMC free article] [PubMed] [Google Scholar]
- 41.Ge SX, Jung D & Yao R ShinyGO : a graphical gene-set enrichment tool for animals and plants. Bioinformaticse 36, 2628–2629 (2020). [DOI] [PMC free article] [PubMed] [Google Scholar]
- 42.McKenzie AT, Katsyv I, Song WM, Wang M & Zhang B DGCA: A comprehensive R package for Differential Gene Correlation Analysis. BMC Syst. Biol 10, 1–25 (2016). [DOI] [PMC free article] [PubMed] [Google Scholar]
- 43.Mi H et al. Protocol update for large-scale genome and gene function analysis with the PANTHER classification system (v.14.0). Nat. Protoc 14, 703–721 (2019). [DOI] [PMC free article] [PubMed] [Google Scholar]
- 44.Team, R. C. R: A language and environment for statistical computing. (2018). [Google Scholar]
- 45.Wickham H ggplot2: Elegant Graphics for Data Analysis. (Springer-Verlag, 2016). [Google Scholar]
Associated Data
This section collects any data citations, data availability statements, or supplementary materials included in this article.
Supplementary Materials
Data Availability Statement
Raw RNA-seq source data is available through the NCBI Sequence Read Archive (SRA, https://www.ncbi.nlm.nih.gov/sra). In vivo RNA-seq (Figs. 1b., 2a, Extended Data Figs. 1c, 1d, Supplementary Table 2): PRJNA666929, in vitro RNA-seq (Extended Data Fig. 6, Supplementary Table 3): PRJNA667108. Publicly available single-cell RNA-seq data (Extended Data Figs. 7b–e): Single Cell Portal accession numbers SCP259, SCP241 (https://singlecell.broadinstitute.org/single_cell). Microarray data (Fig. 3g): GSE44091 (https://www.ncbi.nlm.nih.gov/geo/).