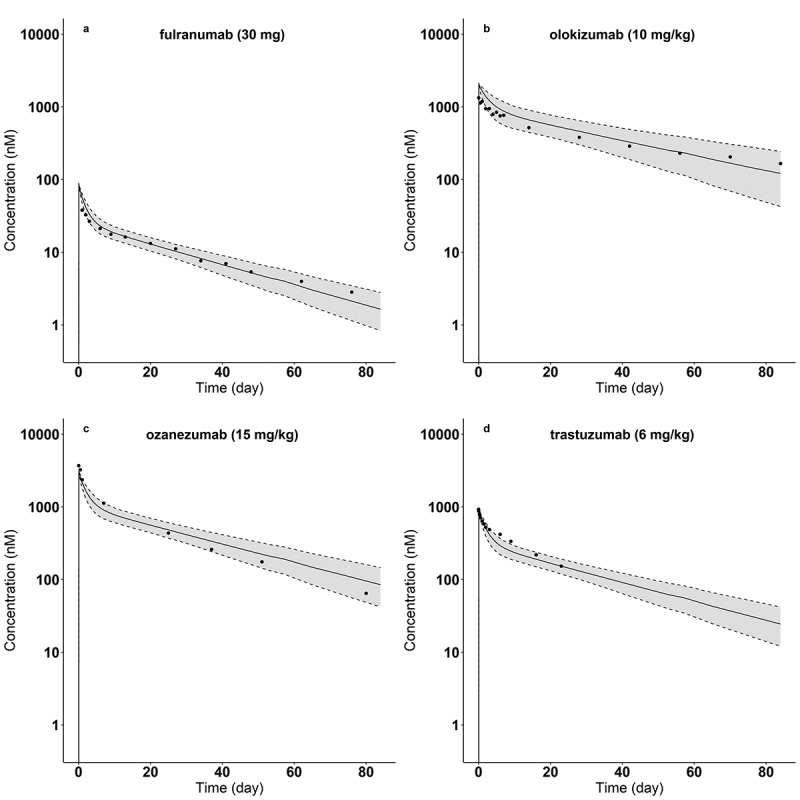
Figure 5.
Model-predicted and observed plasma concentrations of four antibodies: (a) fulranumab (hep_RT = 0.90), (b) olokizumab (hep_RT = 0.21), (c) ozanezumab (hep_RT = 0.64), and (d) trastuzumab (hep_RT = 0.66) for the indicated doses. Dots are mean concentrations from literature (Table 1). Solid lines indicate the predicted median concentration from the population simulations. Dash lines display the 5th and 95th percentiles of the predicted plasma concentrations from the population simulations.
ALT Text: Four plots arranged into two rows and two columns, with about ten dots in each plot. A decaying curve is plotted in each panel surrounded with gray areas, showing a fast drop followed by a slower decaying phase. The grays areas include dots in each panel. The x axis title is “Time (day)” from 0 to 80. The y axis is in log scale ranging from 0 to 10000 with a title of “Concentration (nM).” Each panel has different titles on the top with: (a) fulranumab (30 mg); (b) olokizumab (10 mg/kg); (c) ozanezumab (15 mg/kg); (d) trastuzumab (6 mg/kg).

