

ABSTRACT
Background: Altered DNA methylation may be an intermediate phenotype between breast cancer risk factors and disease. Mammographic density is a strong risk factor for breast cancer. However, no studies to date have identified an epigenetic signature of mammographic density. We performed an epigenome-wide association study of mammographic density.
Methods: White blood cell DNA methylation was measured for 385 postmenopausal women using the Illumina Infinium MethylationEPIC BeadChip array. Differential methylation was assessed using genome-wide, probe-level, and regional analyses. We implemented a resampling-based approach to improve the stability of our findings.
Results: On average, women with elevated mammographic density exhibited DNA hypermethylation within CpG islands and gene promoters compared to women with lower mammographic density. We identified 250 CpG sites for which DNA methylation was significantly associated with mammographic density. The top sites were located within genes associated with cancer, including HDLBP, TGFB2, CCT4, and PAX8, and were more likely to be located in regulatory regions of the genome. We also identified differential DNA methylation in 37 regions, including within the promoters of PAX8 and PF4, a gene involved in the regulation of angiogenesis. Overall, our results paint a picture of epigenetic dysregulation associated with mammographic density.
Conclusion: Mammographic density is associated with differential DNA methylation throughout the genome, including within genes associated with cancer. Our results suggest the potential involvement of several genes in the biological mechanisms behind differences in breast density between women. Further studies are warranted to explore these potential mechanisms and potential links to breast cancer risk.
KEYWORDS: DNA methylation, epigenome-wide association study, breast cancer, mammographic density, postmenopausal, epigenetics, illumina epic array
Introduction
Breast cancer is the most common cancer among women in the United States, with 266,120 new cases estimated in 2018 [1]. The extent of radiologically dense fibroglandular tissue appearing on a mammogram, known as mammographic density, varies between women and is largely heritable [2,3], but also influenced by an individual’s lifestyle [4–6] and exposure to exogenous hormones or other drugs [7,8]. Increased mammographic density is a strong risk factor for breast cancer, with women in the highest density category exhibiting more than a four-fold increase in breast cancer risk compared to women in the lowest density category [9–11]. A number of studies have shown that mammographic density mediates the associations between breast cancer risk factors, such as history of breast biopsy, nulliparity, age at first birth, and hormone therapy, and breast cancer risk [12–14]. However, the molecular mechanisms underlying mammographic density and how density influences cancer risk are largely unknown.
Epigenetic changes, such as DNA methylation, may serve as an intermediate phenotype for risk factors and their associated diseases [15–17]. As such, DNA methylation may provide a powerful tool for understanding the aetiology of breast cancer. It is well established that tumour tissue frequently exhibits changes in DNA methylation compared to normal tissue, such as global hypomethylation and hypermethylation of the promoters of tumour suppressor genes [18–22]. A developing avenue of research involves examining DNA methylation in surrogate tissues, such as blood. A number of studies have shown that epigenome-wide DNA methylation in white blood cells, especially at non-promoter regions, is associated with decreased breast cancer risk (reviewed in [23]).
Epigenetic signatures associated with specific cancer risk factors may provide a better understanding of how these risk factors promote the development of breast cancer. White blood cell DNA methylation has provided epigenetic signatures for risk factors, such as ageing [24,25], lifetime oestrogen exposure [17], body mass index (BMI) [26,27], alcohol [28,29], and smoking [30,31]. The goal of this study was to identify DNA methylation loci associated with mammographic density in postmenopausal women. Discovering and validating such loci may advance our understanding of the biological mechanism linking mammographic density and breast cancer risk.
Methods
Study recruitment
Study participants were postmenopausal women between the ages of 45–66 with no personal history of breast cancer or mastectomy and for whom a mammogram report indicating mammographic density was available within the last 3 years (N = 385). Recruitment, questionnaires, and specimen collection and processing were described previously [32]. Women were considered postmenopausal if they had not had a menstrual cycle for 1 year or more. Participants answered questionnaires about their breast health history and provided a blood sample for DNA methylation analysis. The study was approved by the University of California, Irvine (UCI) Institutional Review Board, HS #2016-3127.
Assessment of mammographic density and covariates
Each participant completed questionnaires that provided age at menarche, age at menopause, parity, age at first birth, use of hormone replacement therapy (HRT), height, weight, smoking status, and alcohol intake. The number of years since menopause was calculated by subtracting the age at menopause from the age at blood draw. HRT use was categorized as current user, former user, and never user. BMI was calculated from self-reported height and weight by dividing the weight in kilograms by the height in metres squared. Participants who smoked cigarettes regularly at the time of blood draw were categorized as current smokers, those who had smoked regularly for 6 months or more but did not currently smoke were categorized as former smokers, and all others were categorized as never smokers. Alcohol use was assessed with two questions: the frequency of alcohol consumption (never, once per month or less, 2–4 times per month, 2–3 times per week, and 4 times or more per week) and the number of drinks per occasion (1–2, 3–4, 5 or more). The responses were categorized as zero, 1 or fewer, 2–6, and 7 or more drinks per week.
Mammographic breast density was obtained from participants’ most recent mammogram report. Mammographic density was classified according to the Breast Imaging Reporting and Data System (BI-RADS), with possible categories: A, almost entirely fatty; B, scattered fibroglandular densities; C, heterogeneously dense; and D, extremely dense [33]. For all data analyses, density was treated as an ordinal variable, with category A being the lowest and category D being the highest.
DNA extraction and methylation profiling
Peripheral blood samples were obtained from each study participant and stored at 4°C until processing. Within 6 hours of collection, samples were centrifuged at 2000 rpm for 10 minutes, and DNA was extracted from the buffy coat using the QIAamp DNA Blood Maxi Kit (QIAGEN, Hilden, Germany). Extracted DNA was quantitated by Synergy HT microplate reader (BioTek, Winooski, VT, USA) using the Qubit™ dsDNA HS Assay Kit (Thermo Fisher Scientific, Waltham, MA, USA) and stored at −80°C.
1.5 µg of DNA was sent to the University of Southern California Molecular Genomics Core in three batches for methylation profiling. Genomic DNA was bisulphite converted using the Zymo EZ DNA methylation kit (Zymo Research, Irvine, CA, USA) and then DNA methylation at over 850,000 CpG sites was measured using the Illumina Infinium MethylationEPIC BeadChip (Illumina, San Diego, CA, USA). Laboratory staff were blinded to the mammographic density status of the samples. All samples passed internal controls and were included in the final data analysis.
Methylation data pre-processing
First, the raw intensities were background corrected and adjusted for dye bias using the noob normalization procedure within the minfi package, version 1.28.3 [36]. Probes with a detection p-value >0.05 in a sample were considered missing for that sample. Low-quality probes were filtered and removed from further analysis for all samples, including probes that: 1) were missing in at least 20% of the samples (n = 648); 2) had SNPs with global minor allele frequency >1% within 5 base pairs of the target sequence or mapping problems with the probe sequence (n = 99,109) [37]; 3) hybridize to multiple locations (n = 15) [38]; or 4) were located on the sex chromosomes (n = 16,927). Beta mixture quantile normalization (BMIQ) was applied to correct for type II probe bias [39]. Previous empirical data suggest that the combined noob and BMIQ methods are the most effective for methylation array normalization [40]. Except for noob normalization, filtering and normalization were completed using the ChAMP package, version 2.10.2 [41]. To address batch effects, the ComBat procedure was applied using sva, version 3.30.1, adjusting for batch and position on chip [42,43].
Finally, the proportions of white blood cell types (monocytes, CD8T, CD4T, B cells, natural killer cells, and neutrophils) were estimated with minfi, which implements the reference-based method described by Houseman [44] (Table S1). Methylation was quantified using β values, representing the percent methylation at the site, and M values, the logit transformation of the β value. Because of its more desirable statistical properties, the M value was used for differential methylation analysis [45], but β values were used for reporting of results to simplify interpretation.
Epigenome-wide analysis
Genome-wide average methylation and epigenetic age acceleration
First, genome-wide DNA methylation was estimated by averaging the methylation levels (β values) of all probes on the array. Linear regression was used to examine associations between genome-wide average methylation and mammographic density. The model was adjusted for age, race/ethnicity, BMI, HRT use, parity, time since menopause, alcohol use, smoking status, batch, position on chip, and estimated white blood cell proportions. These covariates were selected a priori based on known relationships with either DNA methylation, mammographic density, or both. Analyses were repeated for genome-wide average methylation stratified by genomic context as described below.
Epigenetic age was calculated using Horvath’s epigenetic clock [24]. Epigenetic age acceleration, or the difference between chronological age and epigenetic age, was compared for women with varying mammographic densities. Linear regression was used to determine whether there was a statistically significant relationship between epigenetic age acceleration and mammographic density.
Probe- and region-level analyses
For probe-level analyses, linear models with the M value at each site as the dependent variable and mammographic density as the predictor were implemented using the limma package, version 3.38.3 [46]. Models were adjusted for the same covariates as the genome-wide average methylation analysis above. The threshold for genome-wide significance was set at a false discovery rate (FDR) of q < 0.05.
Regional analysis was conducted using DMRcate [47], version 1.18.0, using the same model as for the probe-level analysis. This approach identifies regions of differential methylation in adjacent probes using a kernel smoothing method. We used a threshold of FDR q < 0.05 for genome-wide significance and the package developer-suggested values of 1000 bases for λ and 2 for the scaling factor C. To rank the relative significance of the regions, q-values for the probes contained in the region were combined using Stouffer’s method.
For both probe- and region-level analysis, a resampling-based approach was applied in order to improve the reproducibility and stability of the list of differentially methylated loci (Figure 1). Because of the high dimensionality of microarray data, the results from a single experiment are highly sensitive to small differences in the sample [48–51]. By aggregating results from a large number of subsamples of the main study sample, we can identify methylation differences that are stably associated with our outcome of interest. This approach has only recently been applied to DNA methylation microarray data [52,53].
Figure 1.
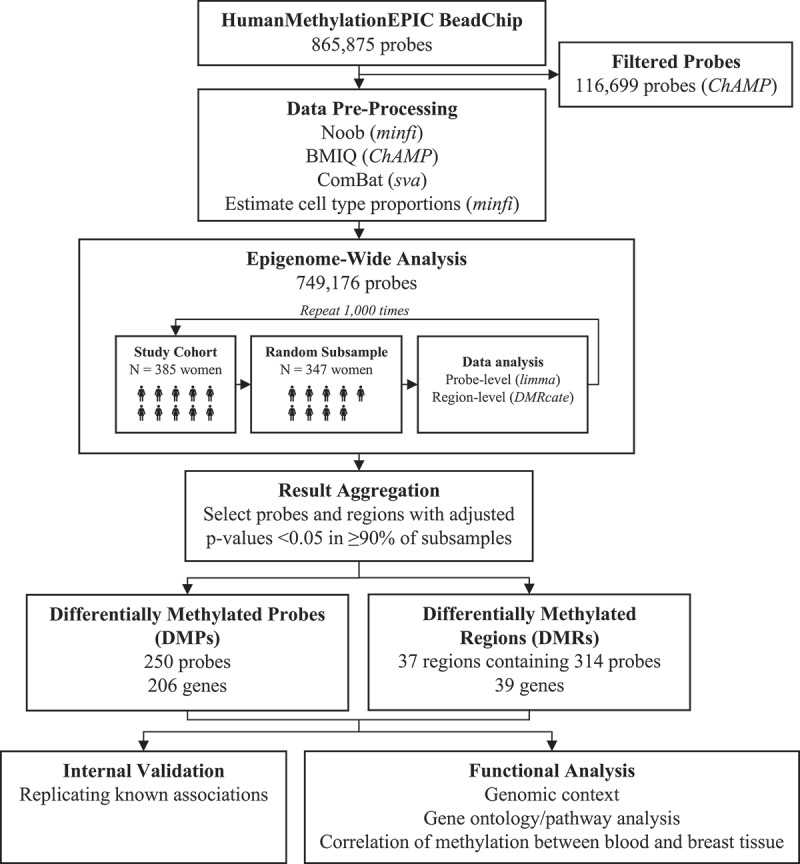
Summarizes the data pre-processing and analysis pipeline. Methylation array data were pre-processed according to recommended steps for Illumina methylation BeadChip data [34]. All data processing and analysis was performed in R, version 3.5.1 [35]
The study cohort was randomly sampled without replacement 1000 times to select subsamples consisting of 90% of the study participants. Each subsample was used to perform probe- and region-level analysis as described above using the UCI High Performance Computing Cluster. Results were aggregated to identify probes and regions that were consistently associated with mammographic density. Probes that were called as differentially methylated in ≥90% of the subsamples were selected as differentially methylated probes (DMPs). After combining overlapping regions, regions that were associated with mammographic density in ≥90% of the subsamples were selected as differentially methylated regions (DMRs).
Internal validation
To demonstrate the validity of our approach, we used the same method to identify DMPs associated with smoking status in our study cohort. We then compared our list of DMPs to results from previous epigenome-wide association studies of smoking.
Biological and functional analyses
DMPs were annotated using the Illumina manifest (version B4) to identify associated genes and genomic context. Probes were also mapped to ChromHMM data from ENCODE [54] to determine the predicted chromatin state; data from the GM12878 lymphoblastic cell line was used as it is the tissue most similar to leukocytes. Chromatin states from the 15-state ChromHMM model were pooled into six categories as follows: promoter (active, weak, or poised promoters), enhancer (strong or weak enhancers), transcribed (transcriptional transition, transcriptional elongation, or weak transcribed), repressed, inactive (heterochromatin and repetitive regions), and insulators. DMPs were examined for enrichment of certain genomic locations, location relative to CpG islands, or chromatin states, compared to the background of all non-DMP probes included on the array. Proportions were compared using a chi-squared test. We used DAVID [55] to examine the enrichment of Kyoto Encyclopaedia of Genes and Genomes (KEGG) pathways and gene ontology terms in genes associated with DMPs, and assessed enrichment of pathways using Ingenuity Pathway Analysis software, version 57,662,101 (Release Date: 2020–09-15).
Correlation with breast tissue
To determine the correlation of methylation at DMPs and DMRs between blood cells and breast tissue, we used DNA methylation data from paired samples from the Susan G. Komen Tissue Bank [56]. Details of the study cohort and specimen processing were described previously [57]. Briefly, 40 women provided blood and breast tissue specimens at two time points spaced at least a year apart, for a total of 160 specimens. DNA methylation for these specimens was characterized using the Illumina Infinium HumanMethylation450 BeadChip array [57]. We calculated Pearson correlations to determine the relationship between methylation in paired blood and breast tissue at each time point at each DMP and all CpG sites located within DMRs.
Results
Cohort characteristics
Cohort characteristics are presented in Table 1. Race/ethnicity was associated with density, with a higher proportion of Asian women in the heterogeneously dense or extremely dense category. BMI was inversely associated with density (p < 0.0001), consistent with previous literature [5]. A higher proportion of current HRT users had extremely dense breasts, also consistent with previous literature [7]. Other variables of interest, including age, smoking status, alcohol use, and reproductive history, were not associated with mammographic density.
Table 1.
Cohort characteristics by BI-RADs mammographic density category. Values are frequency (percentage) for categorical variables and median (interquartile range) for continuous variables. P-values are from Fisher’s exact test (categorical variables) and Kruskal–Wallis test (continuous variables). Missing data: 6 for race/ethnicity, 1 for smoking status, 1 for alcohol use, 1 for age at menarche, 3 for age at menopause. BMI: body mass index; HRT: hormone replacement therapy
| |
|
BI-RADs Mammographic Density |
|
|
|
|
|---|---|---|---|---|---|---|
| A: Almost entirely fatty | B: Scattered fibroglandular densities | C: Heterogeneously dense | D: Extremely dense | Total | p | |
| Total | 42 (10.9%) | 107 (27.8%) | 160 (41.6%) | 76 (19.7%) | 385 | |
| Age | 58.0 (54.0, 60.0) | 56.0 (53.5, 60.0) | 58.0 (55.0, 61.0) | 56.0 (54.0, 60.0) | 385 | 0.25 |
| Race/ethnicity | 0.044 | |||||
| White | 31 (77.5%) | 70 (65.4%) | 99 (63.5%) | 50 (65.8%) | 250 | |
| Asian | 1 (2.5%) | 7 (6.5%) | 19 (12.2%) | 15 (19.7%) | 42 | |
| Hispanic | 5 (12.5%) | 22 (20.6%) | 31 (19.9%) | 10 (13.2%) | 68 | |
| Other | 3 (7.5%) | 8 (7.5%) | 7 (4.5%) | 1 (1.3%) | 19 | |
| BMI | 33.6 (27.3, 38.8) | 27.4 (24.4, 31.8) | 24.4 (22.1, 28.2) | 22.1 (20.3, 24.6) | 385 | <0.0001 |
| Smoking status | 0.13 | |||||
| Never | 26 (63.4%) | 76 (71.0%) | 115 (71.9%) | 63 (82.9%) | 280 | |
| Former | 13 (31.7%) | 24 (22.4%) | 37 (23.1%) | 13 (17.1%) | 87 | |
| Current | 2 (4.9%) | 7 (6.5%) | 8 (5.0%) | 0 (0.0%) | 17 | |
| Alcohol use (drinks per week) | 0.81 | |||||
| None | 13 (31.7%) | 26 (24.3%) | 45 (28.1%) | 21 (27.6%) | 105 | |
| 1 or fewer | 18 (43.9%) | 47 (43.9%) | 66 (41.3%) | 27 (35.5%) | 158 | |
| 2–6 | 8 (19.5%) | 19 (17.8%) | 26 (16.3%) | 17 (22.4%) | 70 | |
| 7 or more | 2 (4.9%) | 15 (14.0%) | 23 (14.4%) | 11 (14.5%) | 51 | |
| Age at menarche | 12.0 (12.0, 13.0) | 13.0 (12.0, 13.0) | 13.0 (12.0, 14.0) | 13.0 (12.0, 14.0) | 384 | 0.54 |
| Parity | 0.21 | |||||
| 0 | 7 (16.7%) | 18 (16.8%) | 37 (23.1%) | 22 (28.9%) | 84 | |
| ≥1 | 35 (83.3%) | 89 (83.2%) | 123 (76.9%) | 54 (71.0%) | 301 | |
| Age at first birth | ||||||
| (for parous women) | 28.0 (21.0, 31.0) | 28.0 (23.0, 32.0) | 27.0 (23.0, 31.0) | 29.0 (27.0, 31.0) | 301 | 0.18 |
| Age at menopause | 48.0 (42.3, 52.0) | 50.0 (47.0, 53.0) | 50.0 (46.0, 53.0) | 50.5 (48.0, 52.3) | 382 | 0.11 |
| HRT use | 0.0028 | |||||
| Never | 29 (69.0%) | 78 (72.9%) | 99 (61.9%) | 37 (48.7%) | 243 | |
| Former | 5 (11.9%) | 17 (15.9%) | 28 (17.5%) | 10 (13.2%) | 60 | |
| Current | 8 (19.0%) | 12 (11.2%) | 33 (20.6%) | 29 (38.2%) | 82 |
Genome-wide average methylation
Genome-wide average DNA methylation was calculated by taking the average of all probes on the array after filtering out low-quality probes and probes on the sex chromosomes (mean 62.15%, range 61.10–63.25%). Average methylation was higher in women with higher mammographic density (Figure 2), increasing 0.034% per density category (95% CI 0.001–0.067, p = 0.043) (Table 2). The adjusted R2 of 0.40 suggests that the variables included in the model explain a moderate amount of the overall variance in genome-wide average DNA methylation. To further characterize this relationship, analyses were repeated after stratifying probes based on their relationship to CpG islands and chromatin state (Table 2). The association between mammographic density and genome-wide DNA methylation was present in probes located on CpG islands and shores (Figure 2), but not those on CpG shelves or distal to CpG islands. Mammographic density was also associated with hypermethylation at predicted promoters, enhancers, transcribed regions, repressed regions and insulators (Figure 2), but not in inactive/heterochromatin regions, gene bodies, or intergenic regions.
Figure 2.
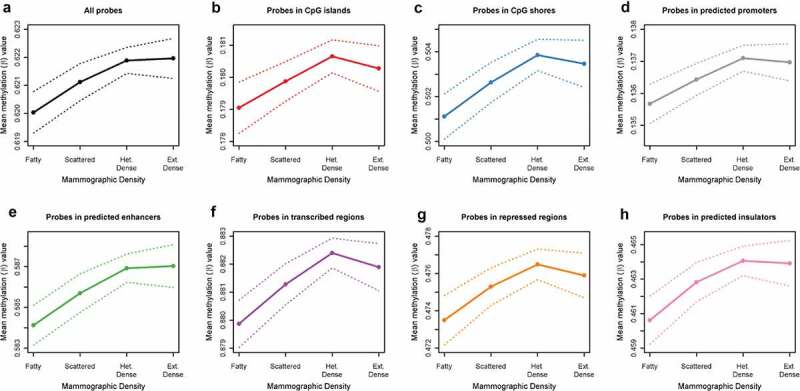
Relationship between mammographic density and genome-wide average methylation, for all probes on HumanMethylationEPIC BeadChip (Figure 2a), for probes in CpG Islands (Figure 2b) and CpG shores (Figure 2c), and for probes by chromatin state predicted by ChromHMM from ENCODE data for the GM12878 cell line: promoters (Figure 2d), enhancers (Figure 2e), transcribed (figure 2f), repressed (Figure 2g) and insulators (Figure 2h). Dashed lines show 95% confidence intervals.
Table 2.
Association of mammographic density with genome-wide average methylation, stratified by genomic context. Model adjusted for age, race/ethnicity, BMI, HRT use, parity, time since menopause, alcohol use, smoking status, batch, position on chip, and cell-type proportions. Chromatin states are predicted by ChromHMM from ENCODE data for the GM12878 cell line. BMI: body mass index; HRT: hormone replacement therapy
| Estimate | (95% CI) | p | Adjusted R2 | |
|---|---|---|---|---|
| All Probes | 0.034 | (0.001, 0.067) | 0.043 | 0.40 |
| CpG Island | ||||
| Island | 0.050 | (0.021, 0.080) | 0.00089 | 0.54 |
| Shore | 0.054 | (0.009, 0.099) | 0.020 | 0.45 |
| Shelf | 0.021 | (−0.015, 0.057) | 0.26 | 0.40 |
| None | 0.023 | (−0.017, 0.064) | 0.26 | 0.42 |
| Relationship to Gene | ||||
| Gene Body | 0.031 | (−0.001, 0.063) | 0.060 | 0.43 |
| Intergenic | 0.030 | (−0.015, 0.074) | 0.19 | 0.35 |
| Chromatin State | ||||
| Promoter | 0.040 | (0.016, 0.065) | 0.0014 | 0.49 |
| Enhancer | 0.055 | (0.012, 0.098) | 0.014 | 0.51 |
| Transcribed | 0.033 | (0.003, 0.063) | 0.034 | 0.62 |
| Repressed | 0.069 | (0.015, 0.124) | 0.013 | 0.41 |
| Inactive | 0.013 | (−0.033, 0.060) | 0.58 | 0.39 |
| Insulator | 0.073 | (0.011, 0.135) | 0.021 | 0.34 |
Epigenetic age acceleration
Chronologic age was moderately correlated with epigenetic age in the study cohort (r = 0.64, p < 0.0001, Figure S1). The mean epigenetic age acceleration was −2.9 years (95% CI −3.3, −2.5), indicating a trend of epigenetic age deceleration. There was no association between mammographic density and epigenetic age acceleration, both in the crude model (p = 0.77) and when adjusted for age, race/ethnicity, BMI, HRT use, parity, time since menopause, alcohol use, smoking status, batch, position on chip, and estimated white blood cell proportions (p = 0.71).
Internal validation of resampling methodology
We sought to test the validity of our resampling-based methodology by identifying probes associated with cigarette smoking in our dataset. Since the relationships between DNA methylation at specific sites and smoking exposure have been well characterized across many studies [30,31,58–61], this exposure serves as a useful positive control.
We identified 40 probes associated with smoking status (current/former/never) in ≥90% of the subsamples (Table S2). The majority have been previously associated with smoking, either for the specific probe itself (N = 21, 53%) or for other probes within the same gene (N = 14, 35%). Only 5 (13%) of our smoking-associated probes had never been previously associated with smoking. All but one of these probes were exclusive to the Illumina EPIC array, which was used in just one of the previous studies of smoking and DNA methylation [60].
Probe-specific analyses
We identified 250 DMPs significantly associated with mammographic density in ≥90% of the subsamples after adjustment for age, race/ethnicity, BMI, HRT use, parity, time since menopause, alcohol use, smoking status, batch, position on chip, and estimated cell-type proportions (Table S3). The majority (N = 192, 77%) were hypermethylated in women with higher mammographic density (Figure 3). Probes with the smallest median p-values were located within the HDLBP, TGFB2, CCT4, PAX8/PAX8-AS1, and TACC2 genes. The largest effect sizes (delta-β) were observed in probes within the HLA-DRB1, HLA-DRB5, PCDHA1/PCDHA2/PCDHA3, TMEM176A/TMEM176B, and PDGFD genes. Boxplots for the top 4 intragenic DMPs by p-value are presented in Figure 4 and for the top 4 intragenic DMPs by delta-β in Figure S2.
Figure 3.
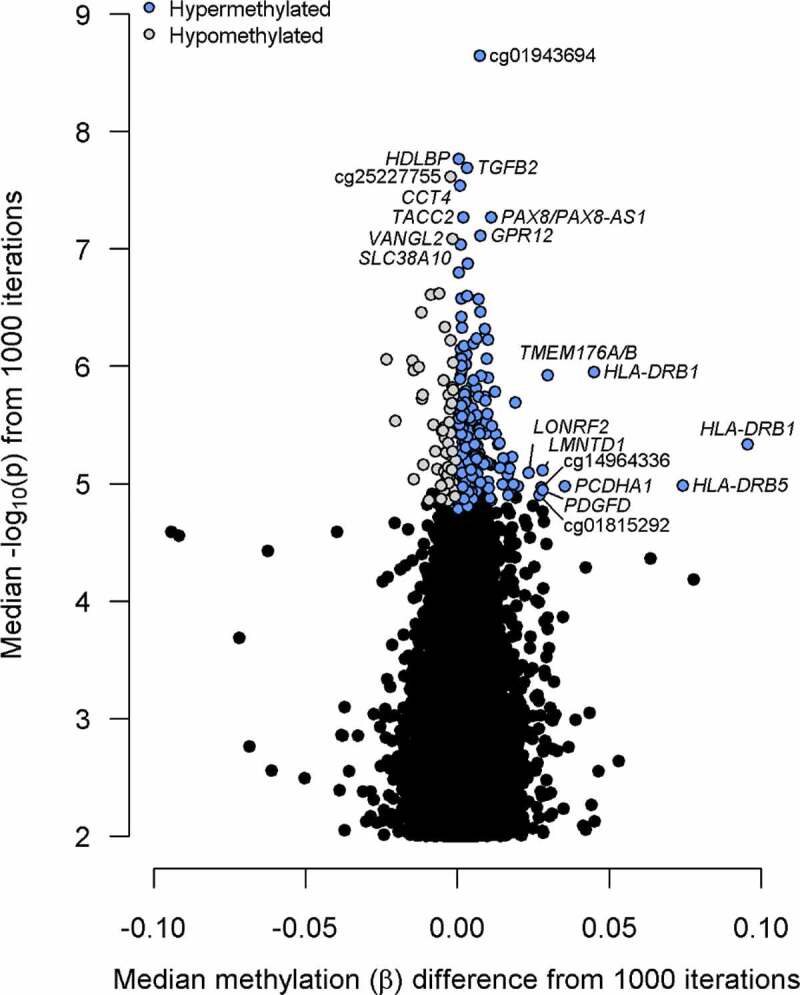
Volcano plot of results from probe-level differential methylation analysis. Top 10 probes by methylation difference (delta-β) and p-value are labelled with the gene or Illumina identifier (if intergenic).
Figure 4.
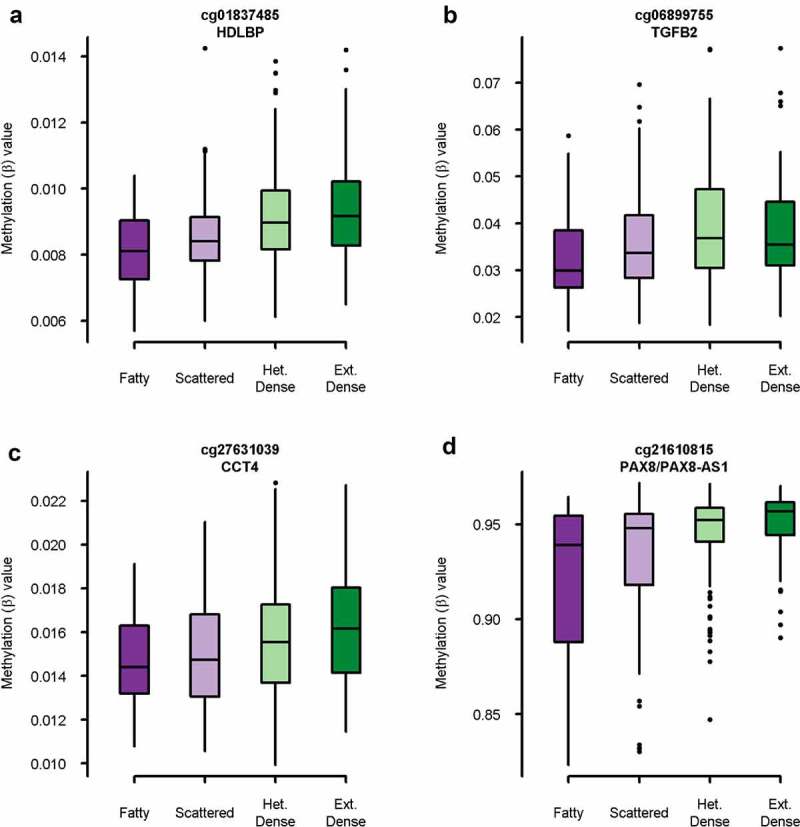
Boxplot of methylation (β) value by mammographic density category for top 4 intragenic probes by p-value. A: cg01837485 in HDLBP (p = 1.7 x 10−[8]), B: cg06899755 in TGFB2 (p = 2.0 x 10−[8]), C: cg27631039 in CCT4 (p = 2.9 x 10−[8]), D: cg21610815 in PAX8/PAX8-AS1 (p = 5.4 x 10−[8]).
Hypermethylated probes were more likely to be located within CpG islands and less likely to be in the open sea, while the opposite was true for hypomethylated probes (Figure 5). Furthermore, hypermethylated probes were more likely to be located within predicted promoters and actively repressed regions and less likely to be located in the transcribed and inactive regions. Hypomethylated probes were more often located in actively transcribed regions and less often in promoter regions.
Figure 5.
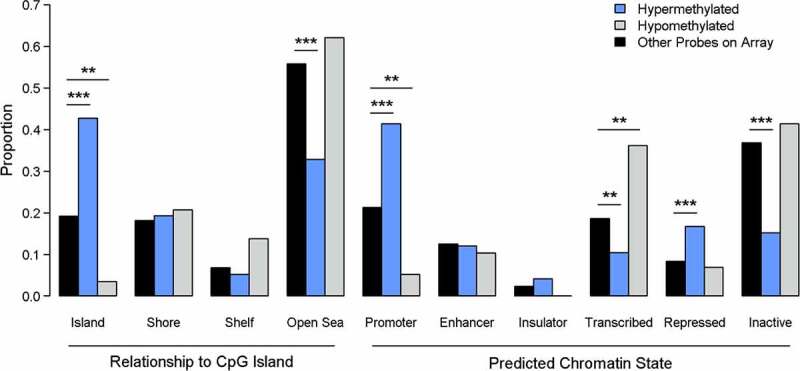
Enrichment analysis for genomic context of differentially methylated probes (DMPs). P-values are from Χ2 test. *** indicates p < 0.001, ** indicates p < 0.01, * indicates p < 0.05.
One hundred and forty of the 250 DMPs are also on the 450-k array and could thus be examined for consistency of DNA methylation between paired blood cells and breast tissue. For 13 of the 140 DMPs with data available (9%), methylation in blood samples was statistically significantly correlated with methylation in paired breast tissue after strict Bonferroni correction (p < 3.6 × 10−[4], r ≥ 0.39). DMPs with the greatest correlation between blood and breast tissue included cg17416722 and cg13910785 in HLA-DRB1 (r ≥ 0.98), two intergenic probes on chromosomes 4 and 5 (cg01815292 and cg14964336), and cg21610815 in PAX8/PAX8-AS1 (r = 0.54) (Table S3).
Regional analyses
There were 37 DMRs significantly associated with the mammographic density in ≥90% of the subsamples (Table S4). Thirty-six (97%) of these regions were hypermethylated in women with higher mammographic density. The smallest FDRs were for regions within the PAX8/PAX8-AS1 genes, intergenic regions at chr5p15.33 and chr1q21.3, and the HLA-DRB1 gene; these same regions and another region within the PF4 promoter had the largest effect sizes. Probes in these five regions also exhibited the strongest correlation between blood and breast tissue (r ≥ 0.5) among the DMRs. Methylation in seven DMRs (19%) was significantly correlated between blood and breast tissue after Bonferroni correction (r ≥ 0.36).
Gene ontology/pathway analysis
Enriched gene ontology (GO) terms, KEGG pathways, and Ingenuity canonical pathways with a significance level of p < 0.05 and a minimum of three genes were identified (Table S5). For genes mapping to DMPs, 24 GO terms were enriched, including several relating to regulation of transcription or DNA binding. Twelve KEGG pathways were enriched, including pathways in cancer, the Ras signalling pathway, non-small cell lung cancer, and thyroid cancer. A further 24 Ingenuity canonical pathways were enriched, including several cancer-related pathways (non-small cell lung cancer signalling, molecular mechanisms of cancer, and glioma signalling) and oestrogen receptor signalling. For genes associated with DMRs, six GO terms were enriched, again including transcription- and DNA-binding-related terms.
Discussion
We performed an epigenome-wide association study of mammographic density using the Illumina Infinium MethylationEPIC BeadChip array. First, we identified a pattern of hypermethylation in CpG islands and gene promoters in women with elevated mammographic density. Second, we identified 250 CpG sites for which DNA methylation was significantly associated with mammographic density using a resampling-based method. The top sites were located within genes associated with cancer, including HDLBP, TGFB2, CCT4, and PAX8, and were more likely to be located in regulatory regions of the genome. Finally, we identified 37 regions in which DNA methylation was associated with mammographic density, including within the promoters of PAX8 and PF4, a gene involved in the regulation of angiogenesis. Overall, our results paint a picture of epigenetic dysregulation associated with mammographic density, which may impact transcription of cancer-related genes.
There was increased genome-wide DNA methylation associated with mammographic density, particularly among probes within CpG islands and predicted promoters. This pattern was robust to sensitivity analysis. This is consistent with the pattern of promoter hypermethylation that is commonly associated with cancer [62], including breast cancer [63]. Some previous studies have associated genome-wide hypomethylation measured with the 450 K array with the risk of breast cancer [63,64], but other studies [65] and meta-analyses [66,67] do not support those findings, and a study directly examining the impact of mammographic density on genome-wide methylation did not find a relationship [68]. Epigenetic age acceleration has been associated with breast cancer risk [69,70]; however, consistent with a previous study [68], we did not observe an increase in epigenetic age acceleration with mammographic density.
The top intragenic DMPs by p-value were located within the HDLBP, TGFB2, CCT4, and PAX8 genes. HDLBP codes for the protein vigilin, which is strongly expressed in normal breast epithelium [71] and is a candidate tumour suppressor [72] that has been shown to impair proliferation of breast cancer cells in vitro [73]. TGFB2 encodes an isoform of TGF-β, a key regulator of cell development and proliferation with both tumour-suppressor and oncogenic functions [74], including in breast cancer [75]. Epigenetic dysregulation of TGF- β signalling is a feature of breast cancer cells [76] and suppression (although not by DNA methylation) of TGF-β2 expression has been previously described in breast cancer cells and tumour samples [77]. Hypermethylation of TGFB2 has been associated with poorer survival in pancreatic cancer [78] and with prostate cancer progression [79]. CCT4 encodes a subunit of chaperonin-containing TCP-1 or CCT, which supervises the folding of proteins, including those critical for the development of cancer [80]. Little data are available regarding the role of CCT4 in carcinogenesis, although one study found a relationship between CCT4 expression and overall survival in breast cancer [81]. Other CCT subunits, particularly CCT2 and CCT3, are overexpressed in a significant proportion of breast cancers and their expression is associated with increased invasiveness [82], proliferation [83], and poor overall survival [81,84] in breast cancer. PAX8 is commonly expressed in tumours of Mullerian origin [85], and some studies have identified PAX8 expression in a significant proportion of metastatic breast cancers [86] and breast cancer cell lines [87]. Another found evidence that reduced expression of an isoform of the PAX8 antisense RNA PAX8-AS1 was associated with poor survival in breast cancer [88]. Interestingly, a CpG site in the closely related and breast-cancer associated [89,90] PAX6 gene was also hypermethylated in women with high mammographic density.
In addition to the hypermethylation in the PAX8 promoter, our regional analysis identified a hypermethylated region at the PF4 promoter associated with the mammographic density. PF4 encodes a chemokine, CXCL4, which can inhibit the proliferation and migration of endothelial cells [91] and suppress angiogenesis [92]. Its expression is dysregulated in many cancers [91], including breast cancer [93]. One study found silencing of PF4 associated with promoter hypermethylation in multiple myeloma patients [94]. Since it is often assumed that regional analysis identifies differential methylation with a greater likelihood of impacting gene expression [95], our results suggest that PF4 and PAX8 expression may be associated with elevated mammographic density, a question that should be studied further.
Overall, the top DMPs and DMRs point to epigenetic dysregulation in genes associated with breast carcinogenesis. It is important to note that none of these genes has clear mechanistic links to mammographic density, but rather to breast cancer risk. This may suggest that the differential methylation described in this study is part of the biological mechanism linking mammographic density and breast cancer development. Without follow-up data on breast cancer outcomes, it is impossible to state if methylation at these sites is a prelude to or mediator of breast cancer development, but methylation at 9 of the 206 genes located near the 250 DMPs and one of the 37 regions has been associated with breast cancer risk in previous studies (TACC296, PDGFD [65], ZFAND465, HSCB [96], MAD1L [97], PRDM1665, C6orf14165, SLITRK565, NCOR265). Further studies are warranted to understand the role of DNA methylation in the relationship between mammographic density and breast cancer.
A recent epigenome-wide association study of mammographic density using the Illumina Infinium HumanMethylation450 BeadChip array did not show any loci associated with mammographic density after adjusting for multiple testing [98]. Several factors may explain these disparate results. First, we used the updated MethylationEPIC array, which covers an additional 400,000 CpG sites compared to the 450k array used in the previous study. Also, we used the qualitative BI-RADs density categorization, rather than the quantitative measures used in the previous study (percentage density, dense area, and non-dense area). These measures are generally correlated [99,100], but nonetheless reflect different approaches to measuring mammographic density. Finally, we used the false discovery rate adjustment for multiple comparisons, while the previous study used the stricter Bonferroni correction. If we had used the same statistical approach, we would have identified just seven DMPs, including those near the HDLBP, TGFB2, CCT4, PAX8, and TACC2 genes, and two intergenic probes at chr6p22.3 and chr20q11.23.
We undertook several important steps to improve the validity of our results. We implemented a resampling-based method to improve the stability of results from epigenome-wide association studies. In 1000 subsamples of our study cohort, we identified 33,015 unique CpG sites associated with mammographic density; however, the vast majority of these sites (79%) were found in ≤5% of subsamples. The number of sites significant at FDR <0.05 varied greatly for each subsample, from a minimum of 123 to a maximum of 17,209. These results highlight the sensitivity of EWAS methods to even small differences in the study cohort, and emphasize the importance of screening lists of DMPs for false positives.
The sample size of 385 women should be sufficient to identify DMPs and DMRs associated with mammographic density; epigenome-wide studies of other disease risk factors have used cohorts of a similar size [17,25,27,28,30,31]. Our resampling method is designed to improve the specificity of the results and reduce the number of false positives identified, which are a major hurdle to replication of epigenome-wide association results. The results of the positive control (identifying loci associated with cigarette smoking) suggest that the method can efficiently identify true positive associations while limiting the number of spurious findings. Using our method versus a ‘traditional’ epigenome-wide association approach with the entire study cohort, we compared the proportion of DMPs with previously established relationships with smoking in other, larger cohort studies. Our study was not designed or powered to examine relationships between smoking and DNA methylation, so it is a reasonable assumption that most results inconsistent with previous literature are false positives. 35/40 (87.5%) DMPs from the resampling method and 164/297 (55.2%) from the traditional method had been previously associated with smoking. These results suggest that resampling-based methods can facilitate identification of differential methylation signals with a high degree of sensitivity and specificity, even in the absence of an external validation dataset.
Blood is a convenient tissue to use to measure DNA methylation and develop biomarkers; however, the extent to which it can be used as a surrogate tissue for breast tissue is unknown. To examine this question, we leveraged a dataset from a previous study [57] which measured DNA methylation in both white blood cells and breast tissue from 40 women. We calculated the correlation between paired blood and breast tissue DNA methylation among our DMPs and DMRs and found that, where data were available, about 9% of DMPs were significantly correlated between blood and breast tissue after multiple testing correction. Similarly, 19% of DMRs overall were statistically significantly correlated between blood and breast tissue, including regions located in the PF4 and PAX8 promoters. These data show that, at least for some loci associated with mammographic density, differences in DNA methylation in blood may reflect similar differences in the breast tissue. In particular, blood DNA methylation at regions associated with mammographic density was more likely to be well correlated with breast tissue DNA methylation, which supports the common assumption that DMRs have greater functional significance than individual probes [95].
There are several important limitations of this study. First, this is a cross-sectional study and cannot determine the temporal relationship between the differential methylation observed and mammographic density. Although we observed differential methylation in active regulatory regions and near genes with possible connections to breast cancer development, we did not examine differences in gene expression to determine whether these differences had a functional impact. This is an important consideration, especially given the small effect sizes observed for some DMPs and DMRs, which are unlikely to have biological impact. In addition, because our study population consisted entirely of postmenopausal women aged 45–66, our results may not be generalizable to all women, for example, premenopausal women or women substantially older. We used a qualitative measure of mammographic density rather than the quantitative percentage density. We chose to use the qualitative BI-RADs density category because it is the most commonly used clinical measurement of mammographic density in the United States, but it may suffer from decreased interobserver reliability, especially for the middle two categories [101–103], which could have reduced our power to detect differential DNA methylation. However, a sensitivity analysis with the cohort limited to women with category A or category D BI-RADs density (n = 118) yielded similar results to the main analysis, suggesting that this limitation did not majorly impact our results. Lastly, we did not validate our results in an independent cohort; however, our identification of previously established smoking-associated probes suggests that the resampling-based method we used yields results that are stable and replicable.
Our study identifies differential DNA methylation associated with mammographic density, an important risk factor for breast cancer. We leveraged a well-characterized cohort and a novel resampling-based method to improve the stability and reproducibility of our findings. Our results suggest the potential involvement of several genes, including PAX8, PF4, HDLBP, TGFB2, and CCT4, in the biological mechanisms behind differences in mammographic density between women. Further studies are warranted to explore these potential mechanisms and potential links to breast cancer risk.
Acknowledgments
The authors would like to thank our patient advocates (Susie Brain, Diane Heditsian, and Vivian Lee) as well as our undergraduate students (Melodie Elyasian, Amanda Hidajat, Daphne Thampy, and Kailynn Yang) for supporting this study. We also thank our study participants and the Athena Breast Health Network for support of this study. Data from samples from the Susan G. Komen Tissue Bank at the IU Simon Cancer Center were used in this study; we thank the contributors, including Indiana University investigators, who collected the samples, and the tissue donors and their families.
Funding Statement
This research was supported by funds from the California Breast Cancer Research Grants Program Office of the University of California, Grant Number 22UB-2311. Support of the Athena Breast Health Network was provided by the Safeway Foundation, University of California Office of the President (UCOP), and Salesforce.
Disclosure of potential conflicts of interest
No potential conflict of interest was reported by the author(s).
References
- [1].Noone AM, Howlader N, Krapcho M, et al., eds. SEER cancer statistics review, 1975-2015. National Cancer Institute, Bethesda, MD; 2018. [Google Scholar]
- [2].Boyd NF, Dite GS, Stone J, et al. Heritability of mammographic density, a risk factor for breast cancer. N Engl J Med. 2002;347(12):886–894. [DOI] [PubMed] [Google Scholar]
- [3].Brand JS, Humphreys K, Thompson DJ, et al. Volumetric mammographic density: heritability and association with breast cancer susceptibility loci. J Natl Cancer Inst. 2014;106(12):dju334–dju334. [DOI] [PubMed] [Google Scholar]
- [4].Soguel L, Durocher F, Tchernof A, et al. Adiposity, breast density, and breast cancer risk: epidemiological and biological considerations. Eur J Cancer Prev. 2017;26(6):511–520. [DOI] [PMC free article] [PubMed] [Google Scholar]
- [5].Hart V, Reeves KW, Sturgeon SR, et al. The effect of change in body mass index on volumetric measures of mammographic density. Cancer Epidemiol Biomarkers Prev. 2015;24(11):1724–1730. [DOI] [PMC free article] [PubMed] [Google Scholar]
- [6].Ziembicki S, Zhu J, Tse E, et al. The association between alcohol consumption and breast density: a systematic review and meta-analysis. Cancer Epidemiol Biomarkers Prev. 2017;26(2):170–178. [DOI] [PubMed] [Google Scholar]
- [7].McTiernan A, Martin CF, Peck JD, et al. Estrogen-Plus-progestin use and mammographic density in postmenopausal women: women’s health initiative randomized trial. JNCI J Natl Cancer Inst. 2005;97(18):1366–1376. [DOI] [PubMed] [Google Scholar]
- [8].Cuzick J, Warwick J, Pinney E, et al. Tamoxifen and breast density in women at increased risk of breast cancer. J Natl Cancer Inst. 2004;96(8):621–628. [DOI] [PubMed] [Google Scholar]
- [9].McCormack VA, Dos Santos Silva I.. Breast density and parenchymal patterns as markers of breast cancer risk: a meta-analysis. Cancer Epidemiol Biomarkers Prev. 2006;15(6):1159–1169. [DOI] [PubMed] [Google Scholar]
- [10].Masala G, Ambrogetti D, Assedi M, et al. Mammographic breast density and breast cancer risk in a Mediterranean population: a nested case-control study in the EPIC Florence cohort. Breast Cancer Res Treat. 2017;164(2):467–473. [DOI] [PubMed] [Google Scholar]
- [11].Boyd NF, Martin LJ, Yaffe MJ, et al. Mammographic density and breast cancer risk: current understanding and future prospects. Breast Cancer Res. 2011;13(6):223. [DOI] [PMC free article] [PubMed] [Google Scholar]
- [12].Byrne C, Ursin G, Martin CF, et al. Mammographic density change with estrogen and progestin therapy and breast cancer risk. J Natl Cancer Inst. 2017;109(9). [DOI] [PMC free article] [PubMed] [Google Scholar]
- [13].Rice MS, Bertrand KA, VanderWeele TJ, et al. Mammographic density and breast cancer risk: a mediation analysis. Breast Cancer Res. 2016;18(1). [DOI] [PMC free article] [PubMed] [Google Scholar]
- [14].Rice MS, Tamimi RM, Bertrand KA, et al. Does mammographic density mediate risk factor associations with breast cancer? An analysis by tumor characteristics. Breast Cancer Res Treat. 2018;170(1):129–141. [DOI] [PMC free article] [PubMed] [Google Scholar]
- [15].Martin EM, Fry RC.. Environmental influences on the epigenome: exposure- associated DNA methylation in human populations. Annu Rev Public Health. 2018;39(1):309–333. [DOI] [PubMed] [Google Scholar]
- [16].Park HL. Epigenetic biomarkers for environmental exposures and personalized breast cancer prevention. Int J Environ Res Public Health. 2020;17(4):1181. [DOI] [PMC free article] [PubMed] [Google Scholar]
- [17].Johansson A, Palli D, Masala G, et al. Epigenome-wide association study for lifetime estrogen exposure identifies an epigenetic signature associated with breast cancer risk. Clin Epigenetics. 2019;11(1):66. [DOI] [PMC free article] [PubMed] [Google Scholar]
- [18].Varley KE, Gertz J, Bowling KM, et al. Dynamic DNA methylation across diverse human cell lines and tissues. Genome Res. 2013;23(3):555–567. [DOI] [PMC free article] [PubMed] [Google Scholar]
- [19].Klutstein M, Nejman D, Greenfield R, et al. DNA methylation in cancer and aging. Cancer Res. 2016;76(12):3446–3450. [DOI] [PubMed] [Google Scholar]
- [20].Feinberg AP, Ohlsson R, Henikoff S. The epigenetic progenitor origin of human cancer. Nat Rev Genet. 2006;7(1):21–33. [DOI] [PubMed] [Google Scholar]
- [21].Esteller M, Corn PG, Baylin SB, et al. A gene hypermethylation profile of human cancer. Cancer Res. 2001;61(8):3225–3229. [PubMed] [Google Scholar]
- [22].Baylin SB, Herman JG. DNA hypermethylation in tumorigenesis: epigenetics joins genetics. Trends Genet. 2000;16(4):168–174. [DOI] [PubMed] [Google Scholar]
- [23].Ennour-Idrissi K, Dragic D, Durocher F, et al. Epigenome-wide DNA methylation and risk of breast cancer: a systematic review. BMC Cancer. 2020;20(1). [DOI] [PMC free article] [PubMed] [Google Scholar]
- [24].Horvath S. DNA methylation age of human tissues and cell types. Genome Biol. 2013;14(10):R115. [DOI] [PMC free article] [PubMed] [Google Scholar]
- [25].Hannum G, Guinney J, Zhao L, et al. Genome-wide methylation profiles reveal quantitative views of human aging rates. Mol Cell. 2013;49(2):359–367. [DOI] [PMC free article] [PubMed] [Google Scholar]
- [26].Wilson LE, Harlid S, Xu Z, et al. An epigenome-wide study of body mass index and DNA methylation in blood using participants from the Sister Study cohort. Int J Obes. 2017;41(1):194–199. [DOI] [PMC free article] [PubMed] [Google Scholar]
- [27].Dick KJ, Nelson CP, Tsaprouni L, et al. DNA methylation and body-mass index: a genome-wide analysis. Lancet. 2014;383(9933):1990–1998. [DOI] [PubMed] [Google Scholar]
- [28].Philibert R, Dogan M, Noel A, et al. Genome-wide and digital polymerase chain reaction epigenetic assessments of alcohol consumption. Am J Med Genet Part B Neuropsychiatr Genet. 2018;177(5):479–488. [DOI] [PMC free article] [PubMed] [Google Scholar]
- [29].Liu C, Marioni RE, Hedman AK, et al. A DNA methylation biomarker of alcohol consumption. Mol Psychiatry. 2018;23(2):422–433. [DOI] [PMC free article] [PubMed] [Google Scholar]
- [30].Breitling LP, Yang R, Korn B, et al. Tobacco-smoking-related differential DNA methylation: 27K discovery and replication. Am J Hum Genet. 2011;88(4):450–457. [DOI] [PMC free article] [PubMed] [Google Scholar]
- [31].Shenker NS, Polidoro S, Van Veldhoven K, et al. Epigenome-wide association study in the European prospective investigation into cancer and nutrition (EPIC-Turin) identifies novel genetic loci associated with smoking. Hum Mol Genet. 2013;22(5):843–851. [DOI] [PubMed] [Google Scholar]
- [32].Lucia RM, Huang WL, Alvarez A, et al. Rationale, study design, and cohort characteristics for the markers for environmental exposures (MEE) study. Int J Environ Res Public Health. 2020;17(5):1774. [DOI] [PMC free article] [PubMed] [Google Scholar]
- [33].D’Orsi CJ, Sickles EA, Mendelson EB, et al. 2013. ACR BI-RADS® Atlas, breast imaging reporting and data system (Reston, VA).
- [34].Dedeurwaerder S, Defrance M, Bizet M, et al. A comprehensive overview of Infinium HumanMethylation450 data processing. Brief Bioinform. 2014;15(6):929–941. [DOI] [PMC free article] [PubMed] [Google Scholar]
- [35].R Core Team . R: a language and environment for statistical computing. R Foundation for Statistical Computing, Vienna, Austria; 2018. [Google Scholar]
- [36].Fortin J-P, Triche TJ, Hansen KD. Preprocessing, normalization and integration of the Illumina HumanMethylationEPIC array with minfi. Bioinformatics. 2016;33:558–560. [DOI] [PMC free article] [PubMed] [Google Scholar]
- [37].Zhou W, Laird PW, Shen H. Comprehensive characterization, annotation and innovative use of Infinium DNA methylation BeadChip probes. Nucleic Acids Res. 2017;45(4):e22. [DOI] [PMC free article] [PubMed] [Google Scholar]
- [38].Nordlund J, Bäcklin CL, Wahlberg P, et al. Genome-wide signatures of differential DNA methylation in pediatric acute lymphoblastic leukemia. Genome Biol. 2013;14(9):r105. [DOI] [PMC free article] [PubMed] [Google Scholar]
- [39].Teschendorff AE, Marabita F, Lechner M, et al. A beta-mixture quantile normalization method for correcting probe design bias in Illumina Infinium 450 k DNA methylation data. Bioinformatics. 2013;29(2):189–196. [DOI] [PMC free article] [PubMed] [Google Scholar]
- [40].Liu J, Siegmund KD. An evaluation of processing methods for HumanMethylation450 BeadChip data. BMC Genomics. 2016;17(1):469. [DOI] [PMC free article] [PubMed] [Google Scholar]
- [41].Tian Y, Morris TJ, Webster AP, et al. ChAMP: updated methylation analysis pipeline for Illumina BeadChips. Bioinformatics. 2017;33(24):3982–3984. [DOI] [PMC free article] [PubMed] [Google Scholar]
- [42].Leek JT, Johnson WE, Parker HS, et al. The sva package for removing batch effects and other unwanted variation in high-throughput experiments. Bioinformatics. 2012;28(6):882–883. [DOI] [PMC free article] [PubMed] [Google Scholar]
- [43].Johnson WE, Li C, Rabinovic A. Adjusting batch effects in microarray expression data using empirical Bayes methods. Biostatistics. 2007;8(1):118–127. [DOI] [PubMed] [Google Scholar]
- [44].Houseman EA, Accomando WP, Koestler DC, et al. DNA methylation arrays as surrogate measures of cell mixture distribution. BMC Bioinformatics. 2012;13(1):86. [DOI] [PMC free article] [PubMed] [Google Scholar]
- [45].Du P, Zhang X, Huang -C-C, et al. Comparison of Beta-value and M-value methods for quantifying methylation levels by microarray analysis. BMC Bioinformatics. 2010;11(1):587. [DOI] [PMC free article] [PubMed] [Google Scholar]
- [46].Ritchie ME, Phipson B, Wu D, et al. limma powers differential expression analyses for RNA-sequencing and microarray studies. Nucleic Acids Res. 2015;43(7):e47. [DOI] [PMC free article] [PubMed] [Google Scholar]
- [47].Peters TJ, Buckley MJ, Statham AL, et al. De novo identification of differentially methylated regions in the human genome. Epigenetics Chromatin. 2015;8(1):6. [DOI] [PMC free article] [PubMed] [Google Scholar]
- [48].He Z, Yu W. Stable feature selection for biomarker discovery. Comput Biol Chem. 2010;34(4):215–225. [DOI] [PubMed] [Google Scholar]
- [49].Michiels S, Koscielny S, Hill C. Prediction of cancer outcome with microarrays: a multiple random validation strategy. Lancet. 2005;365(9458):488–492. [DOI] [PubMed] [Google Scholar]
- [50].Ein-Dor L, Zuk O, Domany E. Thousands of samples are needed to generate a robust gene list for predicting outcome in cancer. Proc Natl Acad Sci U S A. 2006;103(15):5923–5928. [DOI] [PMC free article] [PubMed] [Google Scholar]
- [51].Qiu X, Xiao Y, Gordon A, et al. Assessing stability of gene selection in microarray data analysis. BMC Bioinformatics. 2006;7(1):50. [DOI] [PMC free article] [PubMed] [Google Scholar]
- [52].Gonseth S, Roy R, Houseman EA, et al. Periconceptional folate consumption is associated with neonatal DNA methylation modifications in neural crest regulatory and cancer development genes. Epigenetics. 2015;10(12):1166–1176. [DOI] [PMC free article] [PubMed] [Google Scholar]
- [53].Connell SP, O’Reilly E, Tuzova A, et al. Development of a multivariable risk model integrating urinary cell DNA methylation and cell‐free RNA data for the detection of significant prostate cancer. Prostate. 2020;80(7):547–558. [DOI] [PMC free article] [PubMed] [Google Scholar]
- [54].Ernst J, Kheradpour P, Mikkelsen TS, et al. Mapping and analysis of chromatin state dynamics in nine human cell types. Nature. 2011;473(7345):43–49. [DOI] [PMC free article] [PubMed] [Google Scholar]
- [55].Huang DW, Sherman BT, Lempicki RA. Systematic and integrative analysis of large gene lists using DAVID bioinformatics resources. Nat Protoc. 2009;4(1):44–57. [DOI] [PubMed] [Google Scholar]
- [56].Sherman ME, Figueroa JD, Henry JE, et al. The Susan G. Komen for the cure tissue bank at the IU Simon cancer center: a unique resource for defining the “molecular histology” of the breast. Cancer Prev Res. 2012;5(4):528–535. [DOI] [PMC free article] [PubMed] [Google Scholar]
- [57].Sehl ME, Henry JE, Storniolo AM, et al. DNA methylation age is elevated in breast tissue of healthy women. Breast Cancer Res Treat. 2017;164(1):209–219. [DOI] [PMC free article] [PubMed] [Google Scholar]
- [58].Ambatipudi S, Cuenin C, Hernandez-Vargas H, et al. Tobacco smoking-associated genome-wide DNA methylation changes in the EPIC study. Epigenomics. 2016;8(5):599–618. [DOI] [PubMed] [Google Scholar]
- [59].Joehanes R, Just AC, Marioni RE, et al. Epigenetic signatures of cigarette smoking. Circ Cardiovasc Genet. 2016;9(5):436–447. [DOI] [PMC free article] [PubMed] [Google Scholar]
- [60].Hong Y, Choi H-M, Cheong HS, et al. Epigenome-wide association analysis of differentially methylated signals in blood samples of patients with non-small-cell lung cancer. J Clin Med. 2019;8(9):1307. [DOI] [PMC free article] [PubMed] [Google Scholar]
- [61].Dugué PA, Jung CH, Joo JE, et al. Smoking and blood DNA methylation: an epigenome-wide association study and assessment of reversibility. Epigenetics. 2020;15(4):358–368. [DOI] [PMC free article] [PubMed] [Google Scholar]
- [62].Kulis M, Esteller M. DNA methylation and cancer. Adv Genet. 2010;70:27-56. [DOI] [PubMed] [Google Scholar]
- [63].Severi G, Southey MC, English DR, et al. Epigenome-wide methylation in DNA from peripheral blood as a marker of risk for breast cancer. Breast Cancer Res Treat. 2014;148(3):665–673. [DOI] [PubMed] [Google Scholar]
- [64].Van Veldhoven K, Polidoro S, Baglietto L, et al. Epigenome-wide association study reveals decreased average methylation levels years before breast cancer diagnosis. Clin Epigenetics. 2015;7(1):67. [DOI] [PMC free article] [PubMed] [Google Scholar]
- [65].Xu Z, Sandler DP, Taylor JA. Blood DNA methylation and breast cancer: a prospective case-cohort analysis in the sister study. J Natl Cancer Inst. 2020;112(1):87–94. [DOI] [PMC free article] [PubMed] [Google Scholar]
- [66].Tang Q, Cheng J, Cao X, et al. Blood-based DNA methylation as biomarker for breast cancer: a systematic review. Clin Epigenetics. 2016;8(1):115. [DOI] [PMC free article] [PubMed] [Google Scholar]
- [67].Bodelon C, Ambatipudi S, Dugué PA, et al. Blood DNA methylation and breast cancer risk: a meta-analysis of four prospective cohort studies. Breast Cancer Res. 2019;21(1). [DOI] [PMC free article] [PubMed] [Google Scholar]
- [68].Chen M, Wong EM, Nguyen TL, et al. DNA methylation-based biological age, genome-wide average DNA methylation, and conventional breast cancer risk factors. Sci Rep. 2019;9:15055. [DOI] [PMC free article] [PubMed] [Google Scholar]
- [69].Kresovich JK, Xu Z, O’Brien KM, et al. Methylation-based biological age and breast cancer risk. J Natl Cancer Inst. 2019;111(10):1051–1058. [DOI] [PMC free article] [PubMed] [Google Scholar]
- [70].Ambatipudi S, Horvath S, Perrier F, et al. DNA methylome analysis identifies accelerated epigenetic ageing associated with postmenopausal breast cancer susceptibility. Eur J Cancer. 2017;75:299–307. [DOI] [PMC free article] [PubMed] [Google Scholar]
- [71].Woo HH, Lee SC, Stoffer JB, et al. Phenotype of vigilin expressing breast cancer cells binding to the 69 nt 3′UTR element in CSF-1R mRNA. Transl Oncol. 2019;12(1):106–115. [DOI] [PMC free article] [PubMed] [Google Scholar]
- [72].Molyneux SD, Waterhouse PD, Shelton D, et al. Human somatic cell mutagenesis creates genetically tractable sarcomas. Nat Genet. 2014;46(9):964–972. [DOI] [PubMed] [Google Scholar]
- [73].Woo -H-H, Yi X, Lamb T, et al. Posttranscriptional suppression of proto-oncogene c-fms expression by Vigilin in breast cancer. Mol Cell Biol. 2011;31(1):215–225. [DOI] [PMC free article] [PubMed] [Google Scholar]
- [74].Kubiczkova L, Sedlarikova L, Hajek R, et al. TGF-β - an excellent servant but a bad master. J Transl Med. 2012;10(1):1–24. [DOI] [PMC free article] [PubMed] [Google Scholar]
- [75].Donovan J, Slingerland J. Transforming growth factor-β and breast cancer: cell cycle arrest by transforming growth factor-β and its disruption in cancer. Breast Cancer Res. 2000;2(2):116–124. [DOI] [PMC free article] [PubMed] [Google Scholar]
- [76].Suriyamurthy S, Baker D, Ten Dijke P, et al. Epigenetic reprogramming of TGF-β signaling in breast cancer. Cancers (Basel). 2019;11(5):726. [DOI] [PMC free article] [PubMed] [Google Scholar]
- [77].Hinshelwood RA, Huschtscha LI, Melki J, et al. Concordant epigenetic silencing of transforming growth factor-β signaling pathway genes occurs early in breast carcinogenesis. Cancer Res. 2007;67(24):11517–11527. [DOI] [PubMed] [Google Scholar]
- [78].Huang BZ, Binder AM, Sugar CA, et al. Methylation of immune-regulatory cytokine genes and pancreatic cancer outcomes. Epigenomics. 2020;12(15):1273–1285. [DOI] [PMC free article] [PubMed] [Google Scholar]
- [79].Liu L, Kron KJ, Pethe VV, et al. Association of tissue promoter methylation levels of APC, TGFβ2, HOXD3 and RASSF1A with prostate cancer progression. Int J Cancer. 2011;129(10):2454–2462. [DOI] [PubMed] [Google Scholar]
- [80].Roh SH, Kasembeli M, Bakthavatsalam D, et al. Contribution of the type II chaperonin, TRiC/ CCT,to oncogenesis. Int J Mol Sci. 2015;16(11):26706–26720. [DOI] [PMC free article] [PubMed] [Google Scholar]
- [81].Klimczak M, Biecek P, Zylicz A, et al. Heat shock proteins create a signature to predict the clinical outcome in breast cancer. Sci Rep. 2019;9. [DOI] [PMC free article] [PubMed] [Google Scholar]
- [82].Showalter AE, Martini AC, Nierenberg D, et al. Investigating chaperonin-containing TCP-1 subunit 2 as an essential component of the chaperonin complex for tumorigenesis. Sci Rep. 2020;10(1). [DOI] [PMC free article] [PubMed] [Google Scholar]
- [83].Qu H, Zhu F, Dong H, et al. Upregulation of CCT-3 induces breast cancer cell proliferation through miR-223 competition and Wnt/β-catenin signaling pathway activation. Front Oncol. 2020;10. [DOI] [PMC free article] [PubMed] [Google Scholar] [Retracted]
- [84].Guest ST, Kratche ZR, Bollig-Fischer A, et al. Two members of the TRiC chaperonin complex, CCT2 and TCP1 are essential for survival of breast cancer cells and are linked to driving oncogenes. Exp Cell Res. 2015;332(2):223–235. [DOI] [PubMed] [Google Scholar]
- [85].Laury AR, Perets R, Piao H, et al. A comprehensive analysis of PAX8 expression in human epithelial tumors. Am J Surg Pathol. 2011;35(6):816–826. [DOI] [PubMed] [Google Scholar]
- [86].Kilgore MR, Bosch DE, Adamson KH, et al. Unexpected PAX8 immunoreactivity in metastatic high-grade breast cancer. Appl Immunohistochem Mol Morphol. 2019;27(9):637–643. [DOI] [PubMed] [Google Scholar]
- [87].Muratovska A, Zhou C, He S, et al. Paired-Box genes are frequently expressed in cancer and often required for cancer cell survival. Oncogene. 2003;22(39):7989–7997. [DOI] [PubMed] [Google Scholar]
- [88].Yu X, Cao Y, Tang L, et al. Baicalein inhibits breast cancer growth via activating a novel isoform of the long noncoding RNA PAX8-AS1-N. J Cell Biochem. 2018;119(8):6842–6856. [DOI] [PubMed] [Google Scholar]
- [89].Moelans CB, Verschuur-Maes AH, Van Diest PJ. Frequent promoter hypermethylation of BRCA2, CDH13, MSH6, PAX5, PAX6 and WT1 in ductal carcinoma in situ and invasive breast cancer. J Pathol. 2011;225(2):222–231. [DOI] [PubMed] [Google Scholar]
- [90].Zong X, Yang* H, Yu Y, et al. Possible role of Pax-6 in promoting breast cancer cell proliferation and tumorigenesis. BMB Rep. 2011;44(9):595–600. [DOI] [PubMed] [Google Scholar]
- [91].Ruytinx P, Proost P, Struyf S. CXCL4 and CXCL4L1 in cancer. Cytokine. 2018;109:65–71. [DOI] [PubMed] [Google Scholar]
- [92].Maurer AM, Zhou B, Han ZC. Roles of platelet factor 4 in hematopoiesis and angiogenesis. Growth Factors. 2006;24(4):242–252. [DOI] [PubMed] [Google Scholar]
- [93].Solassol J, Rouanet P, Lamy PJ, et al. Serum protein signature may improve detection of ductal carcinoma in situ of the breast. Oncogene. 2010;29(4):550–560. [DOI] [PubMed] [Google Scholar]
- [94].Suk HC, Ng MHL, Kin ML, et al. 4q loss is potentially an important genetic event in MM tumorigenesis: identification of a tumor suppressor gene regulated by promoter methylation at 4q13.3, platelet factor 4. Blood. 2007;109(5):2089–2099. [DOI] [PubMed] [Google Scholar]
- [95].Michels KB, Binder AM, Dedeurwaerder S, et al. Recommendations for the design and analysis of epigenome-wide association studies. Nat Methods. 2013;10(10):949–955. [DOI] [PubMed] [Google Scholar]
- [96].Yang Y, Wu L, Shu XO, et al. Genetically predicted levels of DNA methylation biomarkers and breast cancer risk: data from 228 951 women of European descent. J Natl Cancer Inst. 2020;112(3):295–304. [DOI] [PMC free article] [PubMed] [Google Scholar]
- [97].Bermejo JL, Huang G, Manoochehri M, et al. Long intergenic noncoding RNA 299 methylation in peripheral blood is a biomarker for triple-negative breast cancer. Epigenomics. 2019;11(1):81–93. [DOI] [PubMed] [Google Scholar]
- [98].Li S, Dugué P-A, Baglietto L, et al. Genome-wide association study of peripheral blood DNA methylation and conventional mammographic density measures. Int J Cancer. 2019;145(7):1768–1773. [DOI] [PubMed] [Google Scholar]
- [99].Winkel RR, Von Euler-chelpin M, Nielsen M, et al. Inter-observer agreement according to three methods of evaluating mammographic density and parenchymal pattern in a case control study: impact on relative risk of breast cancer. BMC Cancer. 2015;15(1):274. [DOI] [PMC free article] [PubMed] [Google Scholar]
- [100].Van Der Waal D, Den Heeten GJ, Pijnappel RM, et al. Comparing visually assessed BI-RADS breast density and automated volumetric breast density software: a cross-sectional study in a breast cancer screening setting. PLoS One. 2015;10(9):e0136667. [DOI] [PMC free article] [PubMed] [Google Scholar]
- [101].Alikhassi A, Esmaili Gourabi H, Baikpour M. Comparison of inter- and intra-observer variability of breast density assessments using the fourth and fifth editions of breast imaging reporting and data system. Eur J Radiol Open. 2018;5:67–72. [DOI] [PMC free article] [PubMed] [Google Scholar]
- [102].Gard CC, Aiello Bowles EJ, Miglioretti DL, et al. Misclassification of breast imaging reporting and data system (BI-RADS) mammographic density and implications for breast density reporting legislation. Breast J. 2015;21(5):481–489. [DOI] [PMC free article] [PubMed] [Google Scholar]
- [103].Nicholson BT, LoRusso AP, Smolkin M, et al. Accuracy of assigned BI-RADS breast density category definitions. Acad Radiol. 2006;13(9):1143–1149. [DOI] [PubMed] [Google Scholar]