

ABSTRACT
Genome-wide DNA methylation analysis is one of the most common epigenetic processes analysed for genome characterization and differential DNA methylation assessment. Previous genome-wide analysis has suggested an important variable in DNA methylation methods involves CpG density. The current study was designed to investigate the CpG density in a variety of different species genomes and correlate this to various DNA methylation analysis data sets. The majority of all genomes had >90% of the genome in the low density 1–3 CpG/100 bp category, while <10% of the genome was in the higher density >5 CpG/100 bp category. Similar observations with human, rat, bird, and fish genomes were observed. The methylated DNA immunoprecipitation (MeDIP) procedure uses the anti-5-methylcytosine antibody immunoprecipitation followed by next-generation sequencing (MeDIP-Seq). The MeDIP procedure is biased to lower CpG density of <5 CpG/100 bp, which corresponds to >95% of the genome. The reduced representation bisulphite (RRBS) protocol generally identifies DMRs in higher CpG density regions of ≥3 CpG/100 bp which corresponds to approximately 20% of the genome. The whole-genome bisulphite (WGBS) analyses resulted in higher CpG densities, often greater than 10 CpG/100bp. WGBS generally identifies ≥2 CpG/100bp, which corresponds to approximately 50% of the genome. Limitations and potential optimization approaches for each method are discussed. None of the procedures can provide complete genome-wide assessment of the genome, but MeDIP-Seq provides coverage of the highest percentage. Observations demonstrate that CpG density is a critical variable in DNA methylation analysis, and different molecular techniques focus on distinct genomic regions.
KEYWORDS: DNA methylation, CpG density, MeDIP, RRBS, WGBS, genome, human, rat, bird, fish, methods, review
Introduction
Genome-wide analysis of DNA sequence and molecular components is an essential aspect of systems biology and understanding genome activity. Epigenetics is defined as ‘molecular factors and processes around DNA that regulate genome activity, independent of DNA sequencing, and are mitotically stable’ [1,2]. One of the first epigenetic processes identified [3] and investigated was DNA methylation [4]. DNA methylation involves the enzymatic actions of DNA methyltransferases to methylate a cytosine residue when a CpG dinucleotide is present. Similar DNA methylation processes occur in all organisms from plants to humans [5]. Therefore, DNA methylation analysis investigates CpG site methylation in the genome, and needs to consider the CpG density as a variable in DNA methylation analysis.
One of the initial DNA methylation analyses developed was methylated DNA immunoprecipitation (MeDIP) that involves immunoprecipitation with a methylated cytosine antibody followed by next-generation sequencing (MeDIP-Seq) [6–8]. Previous studies have demonstrated that this method is biased to lower CpG density compared to a procedure involving methylated DNA binding proteins (MBP) that is biased to higher density CpG regions [9]. A limitation with MeDIP-Seq is that it is not as high-throughput, and also more technically challenging than the chromosomal bisulphite based protocols. The other DNA methylation methods are based on bisulphite conversion of cytosine residues to uracil/thymine residues followed by next-generation sequencing [10–12]. The methylation of the CpG site prevents the bisulphite conversion so it can be used to distinguish DNA methylation after DNA sequencing. A whole-genome bisulphite (WGBS) sequencing procedure can be used [12], as well as reduced representation bisulphite (RRBS) [13]. RRBS uses an enzymatic digestion of the DNA to reduce the targeted portion of the genome (i.e., high GC content) and allow greater read depth compared to WGBS [14]. This restriction enzyme digestion allows for an increased sequencing coverage of high CpG density sites (CpG islands), but examines a reduced component of the genome. One limitation with bisulphite procedures is that the genome sequence conversion of C to T can create alignment issues in the bioinformatics due to the increased divergence in the sequenced reads from the reference genome. This causes a reduction in sequence alignment [13–15], so regions of the genome with reduced complexity resulting from the C to T conversion may be missed by bisulphite-based analyses.
The current study was designed to compare the genome characterization and different DNA methylation protocols using existing data sets in the context of CpG density bias and genome-wide analysis. The various species genome CpG density are determined such that the DNA methylation protocols can be correlated to the genome content assessed. The observations allow the different procedures to be correlated to the percent of the genome. None of the procedures can identify genome-wide 100% of DNA methylation, so the procedure limitations are clarified. The highest percentage of the genome can be assessed with MeDIP-Seq followed by WGBS. RRBS, methyl-binding protein (MBP), and array based methods can only analyse a portion of the genome [16]. Future studies and method development are needed to assess DNA methylation on a genome-wide level. The current study clarifies the advantages and limitations to the current DNA methylation procedures and puts this in the context of genome-wide CpG density distributions.
Methods
Protocol summaries
Each technique starts with DNA extraction and purification from the targeted cell type or tissue. For methylated DNA immunoprecipitation followed by next-generation sequencing (MeDIP-seq) the DNA is sonicated into short fragments of a few hundred base pairs [8]. Single stranded DNA is generated to enable efficient antibody binding. A 5-methylcytosine antibody is then used to bind fragments that include methylated CpG sites. These fragments are generally isolated with magnetic beads that bind the antibody and the DNA amplified with PCR then sequenced [8]. The PCR involves a universal primer and an index primer and bar code primers to amplify all DNA fragments (Table 1).
Table 1.
DNA methylation protocols, limitations and analysis characteristics. The protocol limitations, characteristics and CpG density characteristics are presented
| MeDIP-Seq | RRBS | WGBS |
|---|---|---|
|
Protocol - DNA extraction and sonication - Antibody incubation and Precipitation - Sequencing primers and PCR - Sequencing - Bioinformatics |
Protocol - DNA extraction and sonication - Enzymatic methylation enzyme digestion - Size selection - Bisulphite conversion - Sequencing primers and PCR - Sequencing - Bioinformatics |
Protocol - DNA extraction and sonication - Sequencing primers and PCR - Sequencing - Bioinformatics |
|
Limitations - Low density CpG bias - Batch effects MeDIP can occur - Not possible to do base pair analysis |
Limitations - High density CpG bias - Low percentage genome assessed - Reduced read alignment |
Limitations - High density CpG bias - High sequencing depth required - Reduced read alignment |
|
% Sequence Alignment >95% |
% Sequence Alignment ~75% |
% Sequence Alignment ~75% |
|
% Genome Assessed >95% |
% Genome Assessed <20% |
% Genome Assessed ~50% |
|
CpG/100 bp Density <5 CpG/100 bp |
CpG/100 bp Density >3 CpG/100 bp |
CpG/100 bp Density ≥ 2 CpG/100 bp |
Reduced representation bisulphite (RRBS) uses a methylation sensitive restriction enzyme digestion to cleave unmethylated DNA into fragments at high GC density CpG sites [17]. These fragments are further processed and size selected to target promoters and CpG islands. The resulting fragments then undergo bisulphite conversion which converts unmethylated cytosines to uracil while leaving methylated cytosines unconverted. The fragments are then PCR amplified and sequenced [17], Table 1.
Whole-genome bisulphite (WGBS) analysis performs bisulphite treatment and analysis on the entire genome. No methylated fragment isolation is performed prior to bisulphite conversion. The entire bisulphite converted genome is sequenced and various bioinformatics protocols used [14,18], Table 1. This procedure is often used for genome characterization [16].
Bioinformatics summaries
After sequencing quality control, which may include removing low-quality bases and reads, the informatics and data analysis is different for each technology. For MeDIP-seq, the sequence reads are mapped to the reference genome. The number of reads mapping to each site in the genome is then used as a measure of the methylation at that site. For MeDIP-seq, the mapping step is straightforward and can be performed with standard mapping tools such as Bowtie [19] or BWA [20] (http://bowtie-bio.sourceforge.net, http://bio-bwa.sourceforge.net/). In contrast, the bisulphite conversion step in RRBS and WGBS results in reads that diverge from the reference genome at each converted CpG site. The converted cytosine residues appear as thymine residues. This reduced complexity and increased dissimilarity from the original sequence requires specialized mapping tools such as Bismark [21] (https://www.bioinformatics.babraham.ac.uk/projects/bismark/) or BS-Seeker2 [22] (https://github.com/BSSeeker/BSseeker2). After mapping the alignment is assessed and methylated CpG sites are identified using the presence of an unconverted cytosine residue.
Bioinformatics
The reference genomes used in this study were generally obtained from NCBI or Ensembl. Where available (Supplemental Table S1), the RefSeq assembly was used. The specific assembly versions were Rnor_6.0 for rat, GRCz11 for zebrafish, GRCh38 for human, and GRCg6a for chicken. For the steelhead, two reference genomes were used. The MeDIP-seq study used the Omyk_1.0 reference, while the RRBS study used a published [23] reference. The datasets used in this study were obtained from publicly available sources, predominantly the Gene Expression Omnibus (GEO) data repository (Supplemental Table S1). Due to variability in the analysis methods and data presentation for each study, some further data processing was required. Some studies identify DMR sites with single base pair resolution (zebrafish.wgbs2). This is one of the advantages of bisulphite conversion methods. For these DMRs, the 1kb region centred at the differential CpG site was used to calculate CpG density. The included studies use several different reference genome versions. To increase consistency, the DMR genomic coordinates were converted to a common version prior to CpG density calculation. This conversion was done using liftOver files obtained from UCSC Genome Browser (https://genome.ucsc.edu/). This applies to rat.wgbs2, zebrafish.wgbs1, zebrafish.wgbs2, zebrafish.rrbs1, zebrafish.rrbs2, zebrafish.medip2, and chicken.medip1 (Supplemental Table S1). There are no liftOver files available for conversion between the steelhead reference genomes. For these studies, no common reference genome was used. The genomic position conversion process can split DMR into multiple segments. These split DMR were considered different DMR for the purposes of CpG density calculations. DMR were identified using different statistical cut-offs for each study. We use the final set of DMRs identified in the original study, regardless of the p-value used to determine statistical significance.
Results
The genome-wide CpG density distribution was investigated in the human, rat, fish (zebrafish and steelhead trout), and bird (chicken) genomes. The reference genome sequences were generally obtained from NCBI or Ensembl as described in the Methods, Supplemental Table S1. The initial analysis determined the genome-wide CpG density across the genome using 1000 bp windows, Figure 1. The genomes are largely comprised of low CpG density regions with <3 CpG per 100 bp. A smaller fraction of the genomic sites have higher CpG densities. Similar observations were observed for all the different species genomes. All the different genomes had predominantly <3 CpG/100 bp corresponding to 97% of the human, 98% in the rat, 88% in the zebrafish, 93% in the steelhead, and 94% in the chicken, Figure 1. Few 1 kb regions in the genomes have >20 CpG/100 bp (1 human, 8 chicken, 0 others). Some regions of higher density >10 CpG/100 bp (i.e., CpG islands) exist (~1% genome), but the vast majority of the densities are <5 CpG/100 bp. In the rat genome, 48% of 100 bp genomic windows have no CpG, but this drops to 5% when a 1 kb window is used, Supplemental Figure S1. Observations demonstrate the genomes are predominantly low CpG density, and this needs to be taken into consideration in the methods used to investigate genome-wide DNA methylation.
Figure 1.
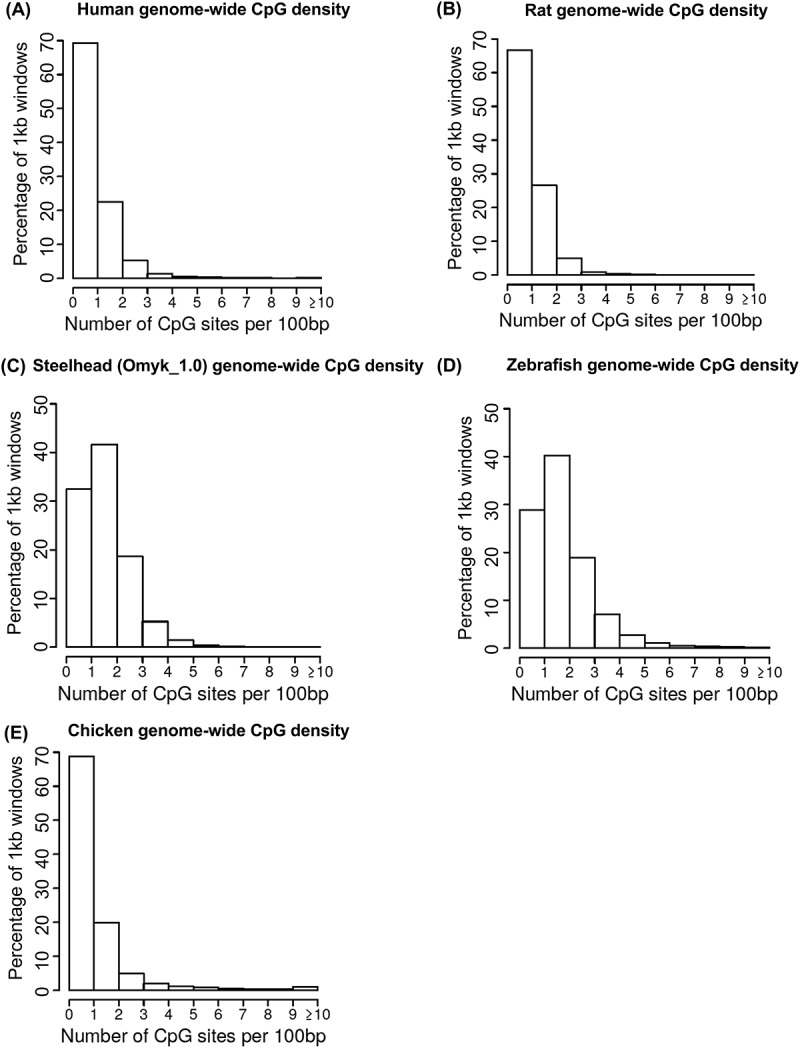
Genome-wide CpG density. The number of total genome-wide 1 kb regions corresponding to CpG/100 bp. (a) human, (b) rat, (c) steelhead, (d) zebrafish, and (e) chicken.
The initial DNA methylation method investigated was methylated DNA immunoprecipitation (MeDIP) followed by next-generation sequencing for MeDIP-Seq [8]. Previously, the MeDIP analysis has been shown to be biased to lower density CpG regions of the genome [9,24]. The objective was to obtain MeDIP-Seq data sets previously published for each of the species genomes available on NCBI GEO to determine the CpG density distribution of the data obtained, Supplemental Table S1. Representative examples of MeDIP-Seq data are presented for each species in Figure 2. The data analysis focuses on the comparison of two different sample groups to identify a differential DNA methylated region (DMR) for data analysis. The DMR CpG density for the data sets are presented, and demonstrate most DMRs have a 0–3 CpG/100 bp CpG density. The predominant density is 1 CpG/100 bp, which correlates with the predominant densities in the representative genomes, Figure 1. There is some variability observed between the different organisms. Zebrafish DMR in particular show a shift to slightly higher 1–4 CpG/100 bp density, but this appears to be in part due to this being two different cell types of sperm and red blood cells. Observations demonstrate the MeDIP-Seq data correlations with the genome CpG distribution effectively allow the predominant low (<3 CpG/100 bp) density to be assessed, Figure 2, which accounts for approximately >90% of the genome for the different species, Figure 1.
Figure 2.
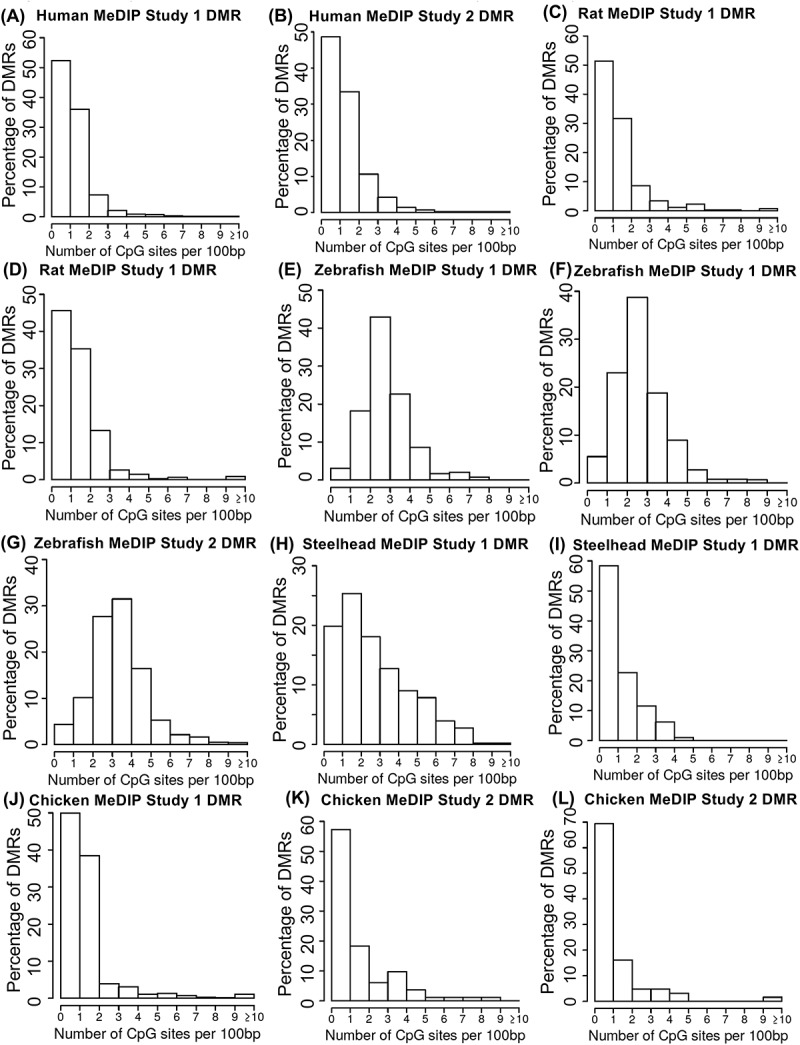
Methylated DNA immunoprecipitation sequencing (MeDIP-Seq). The percentage of differential DNA methylation regions (DMRs) corresponded to number of CpG sites per 100 bp. (a) Human MeDIP study 1 DMR, (b) human MeDIP study 2 DMR, (c) rat MeDIP study 1 DMR, (d) rat MeDIP study 1 DMR, (e) zebrafish MeDIP study 1 DMR, (f) zebrafish MeDIP study 1 DMR, (g) zebrafish MeDIP study 2 DMR, (h) steelhead MeDIP study 1 DMR, (i) steelhead MeDIP study 1 DMR, (j) chicken MeDIP study 1 DMR, (k) chicken MeDIP study 2 DMR, and (l) chicken MeDIP study 2 DMR.
The reduced representation bisulphite (RRBS) method for DNA methylation analysis was examined in several different species. The CpG/100 bp density was determined for each data set and presented for each species in Figure 3. The data sets observed show an interesting split in the typical DMR CpG density distribution. Several datasets show a shift towards higher CpG densities in RRBS DMRs greater than 10 CpG/100 bp, while others show a shift towards intermediate CpG densities. This CpG density >10 CpG/100 bp in Figures 2(a–c) and 3(c) are predominantly 10–12 CpG/100 bp, but if this is increased to 1 kb, approximately two-thirds of the >10 CpG are below 10 CpG/1 kb. Negligible detection of 1 or 2 CpG/100 bp densities were observed, except for fish. Observations demonstrate the RRBS data is biased to higher density CpG regions (e.g., ≥3 CpG/100 bp) in contrast to that observed for MeDIP analysis. Interestingly, the data set from the steelhead trout fish used both MeDIP-Seq and RRBS on the same samples by two different laboratories, Figures 2 and 3. Therefore, the different analysis on the same samples further demonstrates the bias of the MeDIP to lower density and RRBS bias to higher density CpG [25,26].
Figure 3.

Reduced representation bisulphite (RRBS). The percentage of differential DNA methylation regions (DMRs) corresponded to number of CpG sites per 100 bp. (a) Human RRBS study 1 DMR, (b) human RRBS study 1 DMR, (c) rat RRBS study 1 DMR, (d) rat RRBS study 1 DMR, (e) zebrafish RRBS study 1 DMR, (f) zebrafish RRBS study 1 DMR, (g) zebrafish RRBS study 2 DMR, (h) zebrafish RRBS study 2 DMR, (i) steelhead RRBS study 1 DMR, and (j) steelhead RRBS study 1 DMR.
The whole-genome bisulphite (WGBS) analysis for DNA methylation was examined in several species. The DMR CpG/100 bp density was determined for each analysis and presented for each species in Figure 4. The CpG density for the data sets observed provide a similar range of CpG density as the RRBS datasets. There is again a split between analyses finding a small shift towards higher CpG density (2–5 CpG/100 bp) and analyses finding a much more dramatic shift with CpG densities greater than >10 CpG/100 bp. There was minimal detection of 1 CpG/100 bp DMR except for chicken. Observations indicate the WGBS data is biased to higher density CpG regions than observed for the MeDIP analysis, Figure 4. Possible reasons for this bias and potential optimization procedures are discussed in the Discussion section.
Figure 4.

Whole genome bisulphite (WGBS). The percentage of differential DNA methylation regions (DMRs) corresponded to number of CpG sites per 100 bp. (a) Human WGBS study 1 DMR, (b) rat WGBS study 1 DMR, (c) rat WGBS study 2 DMR, (d) zebrafish WGBS study 1 DMR, (e) zebrafish WGBS study 2 DMR, and (f) chicken WGBS study 1 DMR.
Combined analysis of the different DNA methylation analysis procedures in the context of CpG density and percentage of the genome is assessed and presented in Figure 5 and Table 1. The mean of all species procedures is presented in Figure 5(a) and individual species for the procedures in Figure 5(b). The CpG density bias for bisulphite procedures for higher density CpG density reduces the percentage of the genome examined. The MeDIP-seq analysis identifies DMRs in the <5 CpG/100bp range efficiently. As can be seen in Figure 5(a), this corresponds to approximately 98% of the genome among the different species mean. Similarly, WGBS appears to identify DMRs in the greater than or equal to ≥2 CpG/100bp range. This corresponds to approximately 50% of the genome among the different species mean, Figure 1. Finally, RRBS tends to identify DMRs in the greater than or equal to ≥3 CpG/100bp range. These sites represent approximately 20% of the genome among the different species mean, Figure 1. As a comparison, the methylation arrays contain only a few percent of the high-density CpG sites in the genome [16,27]. The open bars in Figure 5(a) represent the different sequence alignment limitation between the procedures with MeDIP-Seq having approximately a 95% alignment [8], and the WGBS and RRBS having approximately a 75% alignment or less [22], Table 1. Therefore, none of the procedures examine the genome-wide distribution of all DNA methylation sites. The human, rat and chicken were consistent, but the fish had a shift to higher CpG density, Figures 1 and 5(b). The limitations to the procedures and optimization approaches are presented in the Discussion section.
Figure 5.

Genome percentage for different DNA methylation analysis. (a) Percent of the genome (percent of 1 kb genomic windows) versus mean of all species for each method. The total bar indicates the total percent of the genome for MeDIP 0–5 CpG/100 bp, WGBS ≥2 CpG/100 bp, RRBS ≥3 CpG/100 bp, and known CpG island tiling arrays. The open box represents the percent of read alignment limitations for each protocol. (b) The percent of the genome for different species (inset legend) for each method with MeDIP 0–5 CpG/100 bp, WGBS ≥2 CpG/100 bp and RRBS ≥3 CpG/100 bp.
Discussion
The CpG density of the different species demonstrated a predominantly low CpG density of <3 CpG/100 bp, Figure 1. There was some species level variability in genome-wide CpG density with steelhead and zebrafish, showing a shift towards higher (1–5 CpG/100 bp) densities. Therefore, the genomes predominantly have low CpG density with most sites having <3 CpG/100 bp, termed CpG deserts [28]. Higher CpG density sites were restricted to 2–6% of the genome in the mammals and birds investigated, and 7–12% in the fish. In contrast to the early focus on CpG islands [29], where the percentage of gene promoters with CpG islands is approximately 50% of the genes [30], the vast majority of the genome is low density of <3% CpG/100 bp. Since distal epigenetic regulation of gene expression and genome activity can occur with DNA methylation, ncRNA, and chromatin structure, the focus on gene promoters and high CpG density has led to the misleading concept that the low-density regions are not functional or biologically important [28]. This demonstrates that the majority of the genome is low-density CpG and not only associated with genes. Observations suggest a re-evaluation of CpG density is needed and that the whole genome needs to be considered for the regulation of genome activity. Since the various DNA methylation analysis protocols have distinct limitations, Table 1, a comparison of these procedures in the context of CpG density was investigated in the current study.
The MeDIP analysis is biased to lower CpG density of <5 CpG/100 bp, which accounts for the vast majority of the genome. The anti-5 methylcytosine antibody has a higher affinity for low-density CpG regions, compared to higher density >10 CpG/100 bp [9]. Therefore, MeDIP analysis is not useful to assess CpG islands, but does investigate the rest of the genome. Although the MeDIP procedure can identify the majority (>95%) of the genome, Figure 5, the protocol involves a single stranded DNA immunoprecipitation which is difficult to adapt to high throughput procedures. The bioinformatics has been developed with no issues with sequence alignment or assessment of differential DNA methylation [8]. When a high-quality reference genome is used, a 95% sequence alignment is often obtained with MeDIP-Seq analysis. Therefore, MeDIP-Seq efficiently uses sequenced reads and provides information on a major portion of the genome. Considering this alignment and the percentage of genome assessed with the MeDIP protocol, approximately 95% of the genome is assessed, Figure 5(a). The MeDIP protocol cannot determine individual CpG level changes in DNA methylation, but the regional (e.g., 100 bp) changes [8]. Additionally, there may be batch effects related to variable antibody performance. Therefore, the advantages of the MeDIP are the assessment of the majority of the genome DNA methylation and established informatics, while the limitations are the lack of high throughput capacity, bias for the low-density CpG regions, and inability to identify individual CpG level changes in DNA methylation, Table 1.
The RRBS protocol identified DMRs with a higher CpG density than MeDIP-seq, possibly due to the post restriction enzyme size selection step. A limitation for RRBS is the reduced representation of a smaller component of the genome is examined, but this allows a higher read depth that facilitates the informatics and reduces the sequencing expense [14]. A limitation with bisulphite analysis involves alignment issues with specific regions of the genome such that a percentage of the genome sites cannot be accurately assessed without higher read depth and repetitive analysis. As shown in the current study, a bias for higher density CpG analysis appears to exist, Figure 3. In contrast to MeDIP, RRBS is useful to assess CpG islands, but not efficient for the majority of the rest of the genome with lower density CpG density. The advantages of RRBS is that it can accommodate higher throughput, can identify single CpG DNA methylation alterations, and requires less sequencing depth. The limitations are that a reduced percentage of the genome (e.g., 15%) is assessed and a percentage of the data obtained with alignment issues is dropped from the analysis [31]. Therefore, RRBS is a useful procedure to monitor DNA methylation alterations, but may miss critical low CpG density genome regions, Table 1.
The whole-genome bisulphite (WGBS) protocols generally identify DMRs with higher CpG density that accounts for ≥2 CpG/100 bp of the genome. The limits are similar for other bisulphite protocols (RRBS) in that there is reduced read depth due to alignment issues for some genomic regions. The informatics also often utilized a higher CpG density cut-off to reduce noise and increase the statistical power of the analysis [14,32]. Due to the bias to higher density CpG, the percent of the genome (e.g., 40%) analysed is less than the MeDIP protocol, that is also reduced due to alignment issues [33], Figure 5(a) and Table 1. The WGBS can detect CpG islands efficiently and detect a wider variety of genomic characteristics in comparison to RRBS and MeDIP.
Although the whole-genome bisulphite sequencing protocols theoretically examine the entire genome, analysis methods may introduce non-obvious limitations. Similar to RRBS, alignment issues arise from reads with increased divergence (i.e., C to T conversion) from the reference with lower overall complexity. The alignment issues result in a large portion of the reads not mapping unambiguously to the reference and being removed from the analysis. This may bias the analysis in unknown ways. The mapping difficulty, combined with a lack of focus on methylated CpGs leads to high sequencing levels required for each sample. This adds considerable expense to WGBS analyses. Additionally, analysis methods often only call DMRs when multiple adjacent CpG sites show differential methylation. This technique decreases noise and reduces the required read depth, but it also discards low CpG density sites. For example, Volkov et al. [34], required three adjacent CpG sites, each of which was required to be within 300 bp of its neighbour. The methods used in this study are typical of this kind of study and are similar to ones used by the authors of the BSmooth analysis tool [35]. This may be one reason for the higher CpG density of DMR detected. Advantages to WGBS include higher throughput pre-sequencing sample preparation and individual CpG residue analysis. The limitations include the expensive sequencing levels required and difficult alignment of reads during analysis Table 1.
The majority of DNA methylation alterations are not a plus or minus methylation, but changes in the level of DNA methylation (e.g., 20% to 50% or 70% to 40%). Therefore, the accuracy of the assessment of DNA methylation levels is important and small changes (e.g., 50% to 55%) are more difficult to statistically detect. All the procedures discussed can effectively measure alterations in DNA methylation and map genome characteristics, but need to consider the limitations in the protocols, Table 1. Another issue is the inclusion of the types of DNA methylation like 5-hydroxymethylcytosine (5hmc) versus 5-methylcytosine (5mc). The 5hmc is an intermediate in the DNA methylation erasure through the TET enzymes [36] and modified procedures are available for 5hmc detection [37]. However, the standard bisulphite procedures RRBS and WGBS cannot distinguish 5mc and 5hmc in the analysis, so are both combined. In contrast, the MeDIP procedure does not detect the 5hmc due to the 5mc antibody specificity. This needs to be considered in the DNA methylation analysis. A misconception with 5hmc is that it is common in cell types,; however,it is primarily present in appreciable levels in stem cells such as the early embryo or primordial germ cells where DNA methylation erasure is predominant, and certain post mitotic differentiated neurons [38]. The vast majority of cell types do not have an appreciable content of 5hmc. This also needs to be considered in DNA methylation analysis.
Observations demonstrate none of the DNA methylation analysis methods examines the whole genome equally, even genome-wide bisulphite sequencing. Each has different limitations and advantages. Although MeDIP assesses the majority of the genome, individual CpG level methylation and higher density CpG densities can not be identified. The bisulphite procedures have bias to higher density CpG either due to molecular or computation analysis procedures, but can be higher throughput. The CpG density distribution of the genomes demonstrates lower density is predominant, and this needs to be taken into consideration when assessing the utility of the current DNA methylation methods. Future studies will ideally need to avoid the issues of the current methods, Table 1. The recent development of the Tet oxidation protocols involving Tet-assisted pyridine borane sequencing (TAPS) may address some of these limitations [39,40].
Supplementary Material
Acknowledgments
We acknowledge Drs. Eric Nilsson, and Jennifer L.M. Thorson critically reviewing the manuscript. We acknowledge Ms. Amanda Quilty for editing and Ms. Heather Johnson for assistance in preparation of the manuscript. This study was supported by John Templeton Foundation (50183 and 61174) (https://templeton.org/) grants to MKS and NIH (ES012974) (https://www.nih.gov/) grant to MKS. The funders had no role in study design, data collection and analysis, decision to publish, or preparation of the manuscript.
Funding Statement
This study was supported by John Templeton Foundation [50183 and 61174] (https://templeton.org/) grants to MKS and NIH [ES012974] (https://www.nih.gov/) grant to MKS. The funders had no role in study design, data collection and analysis, decision to publish, or preparation of the manuscript.
Author contributions
DB Bioinformatic analysis, data analysis, wrote and edited manuscript.
MBM Molecular analysis, data analysis, edited manuscript.
MKS Conceived, oversight, obtained funding, data analysis, wrote and edited manuscript.
Availability of data and materials
All molecular data has been previously deposited into the public database at NCBI (GEO # GSE99129, GSE121585, GSE89144, GSE71567, GSE145887, GSE157417, GSE85790, GSE134362, GSE105766, GSE104221, SRP076725, GSE99272, GSE98064, GSE100470, SRS1788540, SRS1793712), and R code computational tools are available at GitHub (https://github.com/skinnerlab/MeDIP-seq) and https://skinner.wsu.edu/genomic-data-and-r-code-files/.
Disclosure of potential conflicts of interest
The authors report no conflict of interest.
Supplementary material
Supplemental data for this article can be accessed here.
References
- [1].Skinner MK, Manikkam M, Guerrero-Bosagna C.. Epigenetic transgenerational actions of environmental factors in disease etiology. Trends Endocrinol Metab. 2010;21(4):214–222. [DOI] [PMC free article] [PubMed] [Google Scholar]
- [2].Nilsson E, Sadler-Riggleman I, Skinner MK.. Environmentally induced epigenetic transgenerational inheritance of disease. Environ Epigenet. 2018;4(2):1–13, dvy016. [DOI] [PMC free article] [PubMed] [Google Scholar]
- [3].Holliday R, Pugh JE. DNA modification mechanisms and gene activity during development. Science. 1975;187(4173):226–232. [PubMed] [Google Scholar]
- [4].Riggs AD. X inactivation, differentiation, and DNA methylation. Cytogenet Cell Genet. 1975;14(1):9–25. [DOI] [PubMed] [Google Scholar]
- [5].Leti F, Llaci L, Malenica I, et al. Methods for CpG methylation array profiling via bisulfite conversion. Methods Mol Biol. 2018;1706:233–254. [DOI] [PMC free article] [PubMed] [Google Scholar]
- [6].Taiwo O, Wilson GA, Morris T, et al. Methylome analysis using MeDIP-seq with low DNA concentrations. Nat Protoc. 2012;7(4):617–636. [DOI] [PubMed] [Google Scholar]
- [7].Skvortsova K, Zotenko E, Luu PL, et al. Comprehensive evaluation of genome-wide 5-hydroxymethylcytosine profiling approaches in human DNA. Epigenetics Chromatin. 2017;10:16. [DOI] [PMC free article] [PubMed] [Google Scholar]
- [8].Ben Maamar M, Sadler-Riggleman I, Beck D, et al. Genome-wide mapping of DNA methylation 5mC by methylated DNA immunoprecipitation (MeDIP) –sequencing. DNA Mod. Methods Mol Biol. 2021;2198(23):301–310. [DOI] [PMC free article] [PubMed] [Google Scholar]
- [9].Nair SS, Coolen MW, Stirzaker C, et al. Comparison of methyl-DNA immunoprecipitation (MeDIP) and methyl-CpG binding domain (MBD) protein capture for genome-wide DNA methylation analysis reveal CpG sequence coverage bias. Epigenetics. 2011;6(1):34–44. [DOI] [PubMed] [Google Scholar]
- [10].Krueger F, Kreck B, Franke A, et al. DNA methylome analysis using short bisulfite sequencing data. Nat Methods. 2012;9(2):145–151. [DOI] [PubMed] [Google Scholar]
- [11].Olova N, Krueger F, Andrews S, et al. Comparison of whole-genome bisulfite sequencing library preparation strategies identifies sources of biases affecting DNA methylation data. Genome Biol. 2018;19(1):33. [DOI] [PMC free article] [PubMed] [Google Scholar]
- [12].Smallwood SA, Lee HJ, Angermueller C, et al. Single-cell genome-wide bisulfite sequencing for assessing epigenetic heterogeneity. Nat Methods. 2014;11(8):817–820. [DOI] [PMC free article] [PubMed] [Google Scholar]
- [13].Paun O, Verhoeven KJF, Richards CL. Opportunities and limitations of reduced representation bisulfite sequencing in plant ecological epigenomics. New Phytol. 2019;221(2):738–742. [DOI] [PMC free article] [PubMed] [Google Scholar]
- [14].Chatterjee A, Rodger EJ, Morison IM, et al. Tools and strategies for analysis of genome-wide and gene-specific DNA methylation patterns. Methods Mol Biol. 2017;1537:249–277. [DOI] [PubMed] [Google Scholar]
- [15].Allum F, Shao X, Guenard F, et al. Characterization of functional methylomes by next-generation capture sequencing identifies novel disease-associated variants. Nat Commun. 2015;6:7211. [DOI] [PMC free article] [PubMed] [Google Scholar]
- [16].Bock C, Tomazou EM, Brinkman AB, et al. Quantitative comparison of genome-wide DNA methylation mapping technologies. Nat Biotechnol. 2010;28(10):1106–1114. [DOI] [PMC free article] [PubMed] [Google Scholar]
- [17].Gu H, Smith ZD, Bock C, et al. Preparation of reduced representation bisulfite sequencing libraries for genome-scale DNA methylation profiling. Nat Protoc. 2011;6(4):468–481. [DOI] [PubMed] [Google Scholar]
- [18].Tang J, Fang F, Miller DF, et al. Global DNA methylation profiling technologies and the ovarian cancer methylome. Methods Mol Biol. 2015;1238:653–675. [DOI] [PubMed] [Google Scholar]
- [19].Langmead B, Trapnell C, Pop M, et al. Ultrafast and memory-efficient alignment of short DNA sequences to the human genome. Genome Biol. 2009;10(3):R25. [DOI] [PMC free article] [PubMed] [Google Scholar]
- [20].Li H, Durbin R. Fast and accurate short read alignment with Burrows-Wheeler transform. Bioinformatics. 2009;25(14):1754–1760. [DOI] [PMC free article] [PubMed] [Google Scholar]
- [21].Krueger F, Andrews SR. Bismark: a flexible aligner and methylation caller for Bisulfite-Seq applications. Bioinformatics. 2011;27(11):1571–1572. [DOI] [PMC free article] [PubMed] [Google Scholar]
- [22].Guo W, Fiziev P, Yan W, et al. BS-Seeker2: a versatile aligning pipeline for bisulfite sequencing data. BMC Genomics. 2013;14:774. [DOI] [PMC free article] [PubMed] [Google Scholar]
- [23].Berthelot C, Brunet F, Chalopin D, et al. The rainbow trout genome provides novel insights into evolution after whole-genome duplication in vertebrates. Nat Commun. 2014;5:3657. [DOI] [PMC free article] [PubMed] [Google Scholar]
- [24].Ben Maamar M, Sadler-Riggleman I, Beck D, et al. Epigenetic transgenerational inheritance of altered sperm histone retention sites. Sci Rep. 2018;8:5308, 1–10. [DOI] [PMC free article] [PubMed] [Google Scholar]
- [25].Gavery MR, Nichols KM, Goetz GW, et al. Characterization of genetic and epigenetic variation in sperm and red blood cells from adult hatchery and natural-origin steelhead, oncorhynchus mykiss. G3 (Bethesda). 2018;8(11):3723–3736. [DOI] [PMC free article] [PubMed] [Google Scholar]
- [26].Nilsson E, Sadler-Riggleman I, Beck D, et al. Differential DNA methylation in somatic and sperm cells of hatchery versus wild (natural-origin) steelhead trout populations pending. 2020. [DOI] [PMC free article] [PubMed]
- [27].Lin N, Liu J, Castle J, et al. Genome-wide DNA methylation profiling in human breast tissue by illumina TruSeq methyl capture EPIC sequencing and infinium methylationEPIC beadchip microarray. Epigenetics. 2020;1–16. DOI: 10.1080/15592294.2020.1827703 [DOI] [PMC free article] [PubMed] [Google Scholar]
- [28].Skinner MK, Guerrero-Bosagna C. Role of CpG deserts in the epigenetic transgenerational inheritance of differential DNA methylation regions. BMC Genomics. 2014;15(1):692. [DOI] [PMC free article] [PubMed] [Google Scholar]
- [29].Antequera F, Bird A. CpG islands: a historical perspective. Methods Mol Biol. 2018;1766:3–13. [DOI] [PubMed] [Google Scholar]
- [30].Deaton AM, Bird A. CpG islands and the regulation of transcription. Genes Dev. 2011;25(10):1010–1022. [DOI] [PMC free article] [PubMed] [Google Scholar]
- [31].Bonora G, Rubbi L, Morselli M, et al. DNA methylation estimation using methylation-sensitive restriction enzyme bisulfite sequencing (MREBS). PLoS One. 2019;14(4):e0214368. [DOI] [PMC free article] [PubMed] [Google Scholar]
- [32].Yong WS, Hsu FM, Chen PY. Profiling genome-wide DNA methylation. Epigenetics Chromatin. 2016;9:26. [DOI] [PMC free article] [PubMed] [Google Scholar]
- [33].Ziller MJ, Hansen KD, Meer A, et al. Coverage recommendations for methylation analysis by whole-genome bisulfite sequencing. Nat Methods. 2015;12(3):230–232. [DOI] [PMC free article] [PubMed] [Google Scholar]
- [34].Volkov P, Bacos K, Ofori JK, et al. Whole-genome bisulfite sequencing of human pancreatic islets reveals novel differentially methylated regions in type 2 diabetes pathogenesis. Diabetes. 2017;66(4):1074–1085. [DOI] [PubMed] [Google Scholar]
- [35].Hansen KD, Langmead B, Irizarry RA. BSmooth: from whole genome bisulfite sequencing reads to differentially methylated regions. Genome Biol. 2012;13(10):R83. [DOI] [PMC free article] [PubMed] [Google Scholar]
- [36].Hackett JA, Zylicz JJ, Surani MA. Parallel mechanisms of epigenetic reprogramming in the germline. Trends Genet. 2012;28(4):164–174. [DOI] [PubMed] [Google Scholar]
- [37].Beaujean N, Salvaing J, Hadi NAA, et al. Antibody-based detection of global nuclear DNA methylation in cells, tissue sections, and mammalian embryos. Methods Mol Biol. 2018;1708:59–80. [DOI] [PubMed] [Google Scholar]
- [38].Kriaucionis S, Heintz N. The nuclear DNA base 5-hydroxymethylcytosine is present in Purkinje neurons and the brain. Science. 2009;324(5929):929–930. [DOI] [PMC free article] [PubMed] [Google Scholar]
- [39].Liu Y, Siejka-Zielinska P, Velikova G, et al. Bisulfite-free direct detection of 5-methylcytosine and 5-hydroxymethylcytosine at base resolution. Nat Biotechnol. 2019;37(4):424–429. [DOI] [PubMed] [Google Scholar]
- [40].Liu Y, Cheng J, Siejka-Zielinska P, et al. Accurate targeted long-read DNA methylation and hydroxymethylation sequencing with TAPS. Genome Biol. 2020;21(1):54. [DOI] [PMC free article] [PubMed] [Google Scholar]
Associated Data
This section collects any data citations, data availability statements, or supplementary materials included in this article.
Supplementary Materials
Data Availability Statement
All molecular data has been previously deposited into the public database at NCBI (GEO # GSE99129, GSE121585, GSE89144, GSE71567, GSE145887, GSE157417, GSE85790, GSE134362, GSE105766, GSE104221, SRP076725, GSE99272, GSE98064, GSE100470, SRS1788540, SRS1793712), and R code computational tools are available at GitHub (https://github.com/skinnerlab/MeDIP-seq) and https://skinner.wsu.edu/genomic-data-and-r-code-files/.