

Highlights
-
•
This study was the first to investigate whether activity intensities (sedentary behavior, light-, moderate-, and vigorous-intensity physical activity) in Australian children 7‒13 years old were accumulated in longer or shorter bouts within a 24-h composition and whether these were associated with health risk indicators.
-
•
Greater time in longer bouts of light-intensity physical activity, relative to shorter bouts, was significantly associated with greater zBMI and waist circumference.
-
•
Accumulating physical activity, particularly light-intensity physical activity, in frequent short bursts may be more beneficial for limiting adiposity in children compared to accumulating the same amount of physical activity at these intensities in longer bouts.
Keywords: Accumulation patterns, Cardiometabolic health, Children, Compositional data analysis, Time-use
Abstract
Purpose
The study aimed to describe youth time-use compositions, focusing on time spent in shorter and longer bouts of sedentary behavior and physical activity (PA), and to examine associations of these time-use compositions with cardiometabolic biomarkers.
Methods
Accelerometer and cardiometabolic biomarker data from 2 Australian studies involving youths 7–13 years old were pooled (complete cases with accelerometry and adiposity marker data, n = 782). A 9-component time-use composition was formed using compositional data analysis: time in shorter and longer bouts of sedentary behavior; time in shorter and longer bouts of light-, moderate-, or vigorous-intensity PA; and “other time” (i.e., non-wear/sleep). Shorter and longer bouts of sedentary time were defined as <5 min and ≥5 min, respectively. Shorter bouts of light-, moderate-, and vigorous-intensity PA were defined as <1 min; longer bouts were defined as ≥1 min. Regression models examined associations between overall time-use composition and cardiometabolic biomarkers. Then, associations were derived between ratios of longer activity patterns relative to shorter activity patterns, and of each intensity level relative to the other intensity levels and “other time”, and cardiometabolic biomarkers.
Results
Confounder-adjusted models showed that the overall time-use composition was associated with adiposity, blood pressure, lipids, and the summary score. Specifically, more time in longer bouts of light-intensity PA relative to shorter bouts of light-intensity PA was significantly associated with greater body mass index z-score (zBMI) (β = 1.79; SE = 0.68) and waist circumference (β = 18.35, SE = 4.78). When each activity intensity was considered relative to all higher intensities and “other time”, more time in light- and vigorous-intensity PA, and less time in sedentary behavior and moderate-intensity PA, were associated with lower waist circumference.
Conclusion
Accumulating PA, particularly light-intensity PA, in frequent short bursts may be more beneficial for limiting adiposity compared to accumulating the same amount of PA at these intensities in longer bouts.
Graphical abstract
1. Introduction
An emerging body of work links both physical activity (PA) and sedentary behavior (SED) to health across the lifespan,1, 2, 3 with evidence from studies on adults suggesting that both patterns of accumulation and total volume performed are important.4, 5, 6 Evidence concerning when these movement behaviors should start in youth is important for developing recommendations over the life course. Consequently, there is increasing interest in understanding the way in which daily activity is accumulated, including the timing, duration, and frequency of bouts7 of PA and SED, and how such patterns may be associated with cardiometabolic health in youth.8 There is a need to establish at an early age how activity patterns may be associated with cardiometabolic biomarkers, such as obesity and blood lipids, given that they can track into later life.9
Evidence from large cohort studies and a meta-analysis suggest that, for adults, high-intensity PA in bouts lasting ≥10 min is associated with a lower mortality risk.4 Both total SED and longer average SED bout durations are associated with higher mortality risk,5 but breaking up SED with light-intensity PA (LPA) helps improve adiposity and postprandial glycaemia.6 Whilst evidence in adults suggests that different PA and SED accumulation patterns play an important role in cardiometabolic health, a systematic review of studies in youth yielded findings that were inconsistent and mostly limited to measures of adiposity.8 Much remains unknown about whether there may be consequences for cardiometabolic risk, especially in younger populations, depending on whether SED and PA are accumulated sporadically (in shorter bouts) or whether they are accumulated in a more sustained pattern (in longer bouts). Such information is key for the development of targeted interventions that will benefit health outcomes and that will inform the evolution of 24-h movement guidelines.
From a 24-h behavior perspective, sleep and waking movement behaviors occur on an activity continuum that ranges from low- (e.g., sleep, sitting) to high-intensity (e.g., jumping, skipping) activity. A change in time spent in 1 activity intensity (e.g., moderate-to-vigorous-intensity PA (MVPA)) will consequently result in a change in at least one other intensity (e.g., LPA; sleep) in the 24-h period.10,11 Thus, considering overall daily time-use composition of total time spent in various activity intensities (i.e., volumes) can yield a different perspective than considering each intensity in isolation.10 This same principle can be applied to patterns of accumulation, such as time spent in bouts of varying duration for each intensity.
Using compositional data analysis, the relative distribution of time-use between different activities can be examined, classifying activities by their total volume of intensity (e.g., total SED), activity accumulation patterns (e.g., time in longer vs. shorter bouts), other attributes (e.g., behavioral context), or multiple attributes simultaneously.10,11 These respective elements of time-use can then be modelled simultaneously and tested for their combined associations with biomarkers of cardiometabolic health.10, 11, 12 This compositional data analysis approach is more advanced than other types of analyses in that it allows for the simultaneous consideration of components that sum to a whole, without statistical problems such as collinearity, which is often encountered in some traditional approaches.10,11 To date, the application of compositional data analysis to the study of time-use and health has mostly been applied to adults10,12 rather than to youth.13 Furthermore, to the best of our knowledge, there have been no studies, in either adults or youth, that have simultaneously considered activity intensity and bout duration components across the activity spectrum. Although 1 previous study14 has investigated bout duration alongside total volume using a compositional approach and found that engaging in shorter vs. longer SED bouts yielded some benefits in limiting adiposity, it did not investigate other intensity patterns and health outcomes beyond adiposity. Consequently, our study aimed to (1) describe daily time-use composition of youth 7‒13 years old, including time spent in longer and shorter SED and PA bouts, and (2) examine associations between time-use compositions and cardiometabolic risk biomarkers.
2. Materials and methods
2.1. Participant information
Data from 2 cluster-randomized, school-based trials—Transform-Us!15 (Australian clinical trials registration number12609000715279 (19/08/2009), ISRCTN83725066 (30/06/2010)) and LOOK16 (ACTRN12615000066583 (23/01/2015))—were pooled for the purpose of this study. Baseline data from 2010 from Transform-Us! and data from 2009 (time-point 5, i.e., 4 years post-randomization) from LOOK were used.17,18 Ethical approval was provided by the Deakin University Human Research Ethics Committee (Transform-Us!: EC 2009-141) and by the Australian Capital Territory Health Human Research Ethics Committee (LOOK: ETH.9/05.687). Parents provided written informed consent for their children to participate in each assessment (e.g., accelerometry, anthropometry, lipids). Data were obtained from 1219 participants, but the initial analytic sample included only those participants who had valid accelerometry data (n = 843; 69% of the original sample). Details of each study15,16 and comparisons between studies17,18 are reported elsewhere.
2.2. Data collection and measures
2.2.1. Cardiometabolic biomarkers
Seven cardiometabolic measures and related blood biomarkers were collected. Height (cm), weight (kg), and waist circumference (WC; cm) were collected using standardized procedures.19 Body mass index (BMI; kg/m2) was calculated and converted to z-value, standardized for age and sex, using the World Health Organization Child Growth Standards (zBMI).20 Systolic blood pressure (SBP) and diastolic blood pressure measurements were taken while participants were in a rested, seated, or supine position. Overnight fasted blood samples were collected for the assessment of high-density lipoprotein cholesterol (HDL-C), low-density lipoprotein cholesterol (LDL-C), and triglycerides (lipids).15,16 A continuous combined cardiometabolic risk score (CMR score) was derived using the z-value = (value − mean)/SD for WC, SBP, diastolic blood pressure, LDL-C, HDL-C, and triglycerides,21 as previously described.17,18 Since the spread of observed values and prevalence of deviating values for individual risk factors in a sample of reasonably healthy children are likely to be low compared to adults, the use of this CMR score is appropriate.22 The calculation of the CMR score is in line with previous calculations used in research on this age group.9,23
2.2.2. Accelerometry
Participants wore an ActiGraph (ActiGraph, Pensacola, FL, USA) accelerometer on the right hip during waking hours for 8 consecutive days. The output of the different ActiGraph models (GT1M in LOOK16 and GT3X in Transform-Us!15) have been shown to be comparable and can be pooled.24 ActiGraph data collected in 5-s (LOOK) and 15-s (Transform-Us!) epochs were downloaded and (if applicable) converted to 15-s epochs using ActiLife software (ActiGraph). These were then processed using a customized Excel (Microsoft, Redmond, WA, USA) macro. Sustained periods of ≥20 min of consecutive zeros were used to define non-wear time.25,26 Using validated, age-specific cut-points,25,27 total time was subdivided into SED, LPA, moderate-intensity PA (MPA), vigorous-intensity PA (VPA), and “other time” (i.e., non-wear/sleep). These cut-points were developed in a laboratory study that showed that they could be used to distinguish differing levels of PA intensity as well as sedentary time in children.28 An overview of the age-specific, 15-s epoch cut-points used is provided in Supplementary Table 1. The “other time” category could not be separated out into sleep and non-wear time because sleep data were not collected in either study. Total volumes of SED, LPA, MPA, and VPA were separated into duration of longer and shorter bouts. The thresholds for defining longer and shorter bouts were based on previous literature8 and preliminary exploration of accumulation patterns in this sample.17,18 For SED, longer bouts were defined as ≥5 min and shorter bouts as <5 min. For LPA, MPA, and VPA, longer bouts were defined as ≥1 min and shorter bouts as <1 min. Data related to accelerometer wear time were totaled per day and then averaged across all valid days (i.e., weekdays with ≥8 h and weekend days with ≥7 h of accelerometer wear time).25 Only participants with ≥4 valid days of accelerometer wear time were included in analyses, with no weekend-day requirement.26
2.2.3. Covariates
Participant age was included as a continuous variable, and sex was included as a binary variable. Socioeconomic status (SES) of school location was transformed into deciles based on the national Index of Relative Socio-Economic Disadvantage of the Socio-Economic Indexes for Areas29 and was categorized as low (1–2), mid (3–8), or high (9 –10) SES.15 The data source (LOOK or Transform-Us!) was coded as a categorical covariate. We did not adjust the models for the LOOK intervention arm because no differences were observed between arms.
2.3. Statistical analyses
Analyses were performed in STATA Version 15.0 (StataCorp, College Station, TX, USA) and RStudio Version 1.4.453 (R Version 3.6.3; The R Foundation for Statistical Computing, Vienna, Austria), using the “compositions” (“acomp” framework), zCompositions (“MultLN”) and “stats (“lm” function) packages.30, 31, 32 For the purpose of our analysis, the proportion of the 24-h day spent in different intensities was normalized for each participant so that their sum equaled 1. A time-use composition of 9 distinct components (time in longer and shorter bouts of SED, LPA, MPA, and VPA, and “other time”) was formed using compositional data analysis. Most activities were ubiquitous, except for the VPA longer bouts component, which was monitored as 0 for 10 participants (1%). A limitation of compositional data analysis is that 0 values cannot be included in log ratios because dividing by 0 or taking the logarithm of 0 are undefined mathematical operations.11 Accordingly, these 0 were treated as VPA that occurs at a level less than the detection limit (1 epoch over the monitoring period) and thus were replaced using the multiplicative lognormal univariate replacement method of the zCompositions package (detection limit set at the lowest observed value in the sample (0. 143)).32
The proportion of time spent in different bouts (longer vs. shorter) of SED, LPA, MPA, VPA, and “other time” were reported using standard descriptive statistics (i.e., median, interquartile range, range) as well as the compositional mean. The compositional mean, or center, is the vector of geometric means of its parts, rescaled to sum up to 24 h, and is coherent with the inter-dependent nature of compositional data.10,11,33
Linear regression models were used to test associations between the time-use composition and the cardiometabolic health biomarkers. All models used robust standard errors to account for clustering by school. Adjusted models controlled for age, sex, SES, and data source (i.e., LOOK or Transform-Us!). The nine-part time-use composition was modelled as a set of 8 isometric log-ratio (ilr) coordinates.34, 35, 36 Values estimated by such models are invariant with regards to the orthonormal basis selected.37 Accordingly, a basis (i.e., sequential binary partition) consisting of 8 ilr coordinates reflecting comparisons of time spent in longer vs. shorter bouts (ilr coordinates 2 (SED), 4 (LPA), 6 (MPA), and 8 (VPA)), as well as comparisons of volumes of each intensity (SED, LPA, MPA, and VPA) vs. more intense activities and/or “other time” (ilr coordinates 1, 3, 5, and 7), was created.38 A detailed overview of this basis is displayed in the sequential binary partition and sign matrix in Supplementary Table 2.
The 8 ilr coordinates were modelled simultaneously. Thus, estimates of effects of each bout duration are controlled for other bout durations, the relative volumes of each intensity, and “other time”. Vice versa, effects of relative volumes of each intensity were controlled for “other time”, the other activity intensities, and their accumulation pattern in longer vs. shorter bouts. This sequential binary partition was chosen to allow direct comparisons between time in longer and shorter bouts within each intensity. This is novel within the PA field, where typically ratios between one-versus-remaining behaviors are investigated when using compositional data analysis (e.g.,10,12).
Global F tests of these 8 ilr coordinates, which reflect the overall effect of the time-use composition, were reported. In addition, individual regression coefficients for each of the 8 ilr coordinates were reported. Because the change in outcome depends on which other compositional parts change to compensate,34 plots with estimated outcomes were created. These provide a more interpretable indication of relationships between activity accumulation pattern (more time in longer vs. shorter bouts) and cardiometabolic biomarkers compared with the estimated regression parameters for individual ilr coordinates. These plots included the estimated mean cardiometabolic health biomarker, with 95% confidence intervals (95%CIs). In these estimations, the overall time within the intensity of interest was kept constant, while the ratio between longer and shorter behaviors was alternated. Times in all other components were set at the mean observed values. Means were estimated for girls and boys separately, keeping age (mean = 10.5 years), SES (mid) and data source (LOOK) constant (Table 1). Estimations were only conducted for the range of activity levels occurring in the observed data, rounded to the nearest 5 min for plotting purposes. That is, data were not extrapolated beyond the observed range for the exposure variables (Table 2).
Table 1.
Participant characteristics (subset adiposity, n = 782; mean ± SD or %).
| Demographic characteristics | Whole sample | Girl (n = 431) | Boy (n = 351) |
|---|---|---|---|
| Age (year) | 10.5 ± 1.7 | 10.3 ± 1.7 | 10.6 ± 1.7 |
| Gender (% female) | 55 | 100 | 0 |
| SES (%)a | |||
| High | 3 | 3 | 3 |
| Mid | 36 | 36 | 35 |
| Low | 61 | 61 | 62 |
| Data source (% in LOOK) | 53 | 50 | 56 |
| Cardiometabolic biomarkers | |||
| zBMI | 0.5 ± 1.1 | 0.5 ± 1.1 | 0.6 ± 1.2 |
| WC (cm) | 64.1 ± 9.0 | 63.3 ± 9.0 | 65.1 ± 8.9 |
| Systolic blood pressure (mm Hg)b | 106.5 ± 10.3 | 105.6 ± 10.4 | 107.5 ± 10.0 |
| Diastolic blood pressure (mm Hg)b | 61.0 ± 7.5 | 61.0 ± 7.4 | 61.0 ± 7.6 |
| HDL-C (mmol/L)c | 1.5 ± 0.3 | 1.4 ± 0.3 | 1.5± 0.3 |
| LDL-C (mmol/L)c | 2.5 ± 0.7 | 2.6 ± 0.7 | 2.5 ± 0.7 |
| Triglycerides (mmol/L)d | 0.8 ± 0.4 | 0.9 ± 0.4 | 0.8 ± 0.4 |
| CMR scored | 0.0 ± 3.4 | 0.2 ± 3.2 | -0.1 ± 3.7 |
Abbreviations: CMR score = cardiometabolic risk score; HDL-C = high-density lipoprotein cholesterol; LDL-C = low-density lipoprotein cholesterol; SES = socioeconomic status; WC = waist circumference; zBMI = body mass index converted to the World Health Organization Child Growth Standards age and sex standardized z-values.
SES of school location was transformed into deciles based on the Index of Relative Socio-Economic Disadvantage of the national Socio-Economic Indexes for Areas and was categorized as low (1–2), mid (3–8), or high (9–10) SES.
n = 637 (55% girls).
n = 525 (55% girls).
n = 404 (54% girls).
Table 2.
Standard and compositional descriptive statistics of the proportion of time spent in longer and shorter bouts of SED, LPA, MPA, VPA, and “other time” (subset adiposity, n = 782).
| Standard descriptive statistics (min/day) |
Compositional descriptive statistics |
|||||
|---|---|---|---|---|---|---|
| Q1 | Median | Q3 | Range | Mean (%) | Mean (min/24h) | |
| SED | ||||||
| Longer bouts | 122.8 | 160.2 | 208.1 | 28.0–512.2 | 12 | 169.6 |
| Shorter bouts | 243.6 | 265.2 | 293.1 | 162.7–465.7 | 19 | 268.0 |
| LPA | ||||||
| Longer bouts | 87.9 | 101.4 | 119.3 | 44.0–197.3 | 7 | 103.9 |
| Shorter bouts | 114.8 | 126.4 | 136.9 | 79.6–189.7 | 9 | 126.0 |
| MPA | ||||||
| Longer bouts | 5.5 | 7.7 | 10.6 | 1.0–40.2 | <1 | 8.6 |
| Shorter bouts | 27.2 | 36.5 | 47.1 | 6.4–82.5 | 3 | 37.4 |
| VPA | ||||||
| Longer bouts | 1.9 | 4.1 | 7.5 | 0.1–49.1 | <1 | 5.8 |
| Shorter bouts | 8.5 | 13.5 | 19.6 | 1.5–43.6 | 1 | 14.9 |
| “Other time” | 614.1 | 668.2 | 718.9 | 301.8–889.2 | 46 | 664.3 |
Notes: Longer bouts of SED were defined as ≥5-min bouts. Shorter SED was defined as bouts of <5 min. Similarly, longer PA bouts (i.e., LPA, MPA, and VPA) were defined as ≥1-min bouts and shorter PA bouts as the time accumulated in <1-min bouts. “Other time” consisted of non-wear/sleep.
Abbreviations: LPA = light-intensity physical activity; MPA = moderate-intensity physical activity; Q1 = the first interquartile; Q3 = the third interquartile; SED = sedentary behavior; VPA = vigorous-intensity physical activity.
3. Results
3.1. Participant characteristics
Of the 843 participants with valid accelerometry data, 61 (7%) had missing data for BMI, WC, and/or covariates, and were therefore excluded from data analysis. A total of 782 participants were included in the analysis (subset adiposity). Next, subsets with complete data were created for blood pressure (n = 637 (76% of the sample with valid accelerometry)), lipids (n = 525 (62%)), and CMR score analysis (n = 404 (48%)). These smaller analytic samples were attributable to fewer children participating in blood pressure and blood assessments. The included sample for each subset was compared with the excluded participants, and no major differences were observed (comparisons were previously published18). Demographic characteristics and cardiometabolic biomarker values for girls vs. boys were comparable, and thus the data were pooled for analysis (Table 1).
Participants were on average 10 years old (55% girls), and most (61%) attended schools located in low SES areas relative to the Australian average (Table 1). Standard and compositional descriptive statistics of the proportion of time spent in longer and shorter bouts of SED, LPA, MPA, and VPA are presented in Table 2. Approximately 12% and 19% of the total time per 24-h day was spent in longer and shorter SED bouts, respectively. The proportions of time spent in longer and shorter bouts of LPA, MPA, and VPA ranged from <1% to 9%.
3.2. Associations between time-use composition and cardiometabolic biomarkers
Results from the linear regression analysis modelling the relationship between the time-use compositions, including the 8 ilr coordinates, and cardiometabolic biomarkers are provided in Table 3 and Supplementary Table 3. Table 3 presents the global F test and the parameters corresponding to time in longer vs. shorter SED, LPA, MPA, and VPA (ilr coordinates 2, 4, 6, and 8). Supplementary Table 3 presents the parameters corresponding to relative volumes of SED, LPA, MPA, and VPA (ilr coordinates 1, 3, 5, and 7). These were obtained within the same time-use composition models as the parameters presented in Table 3. While all results are presented in Table 3 and Supplementary Table 3, the following text only focuses on the overall time-use composition models and the individual ilr regression coefficients within the confounder-adjusted models, which showed evidence of an association between the time-use composition and the cardiometabolic biomarkers (global F test p < 0.05; specific values reported in Table 3).
Table 3.
Associations of the ratio of time in longer vs. shorter bouts, controlled for all other intensities, with cardiometabolic biomarkers in children aged 7–13 years.
| SED (ilr 2) |
LPA (ilr 4) |
MPA (ilr 6) |
VPA (ilr 8) |
Overall |
||||||||
|---|---|---|---|---|---|---|---|---|---|---|---|---|
| Outcome | Model | β (SE) | p | β (SE) | p | β (SE) | p | β (SE) | p | F(df) | p | Adj. R2 |
| zBMI | Unadj. | –0.28 (0.48) | 0.558 | 1.43 (0.65) | 0.027 | –0.53 (0.27) | 0.050 | 0.23 (0.16) | 0.146 | 6.74(8,773) | <0.001 | 0.06 |
| (n = 782) | Adj. | –0.33 (0.48) | 0.489 | 1.79 (0.68) | 0.009 | –0.01 (0.30) | 0.983 | 0.14 (0.16) | 0.395 | 5.78(13,768) | <0.001 | 0.07 |
| WC (cm) | Unadj. | –8.83 (3.40) | 0.010 | 27.26 (4.62) | <0.001 | 1.36 (1.94) | 0.481 | 0.70 (1.12) | 0.530 | 30.41(8,773) | <0.001 | 0.23 |
| (n = 782) | Adj. | –5.99 (3.37) | 0.076 | 18.35 (4.78) | <0.001 | –2.61 (2.12) | 0.220 | 1.91 (1.12) | 0.087 | 22.61(13,768) | <0.001 | 0.26 |
| SBP (mm Hg) | Unadj. | –4.04 (4.28) | 0.347 | 18.91 (5.84) | 0.001 | 12.26 (2.54) | <0.001 | –3.75 (1.52) | 0.014 | 22.28(8,628) | <0.001 | 0.21 |
| (n = 637) | Adj. | –1.40 (4.19) | 0.738 | 8.61 (5.88) | 0.144 | 4.42 (2.76) | 0.110 | –1.52 (1.50) | 0.313 | 18.93(13,623) | <0.001 | 0.27 |
| DBP (mm Hg) | Unadj. | 0.16 (3.52) | 0.964 | –1.08 (4.81) | 0.823 | 1.20 (2.09) | 0.566 | 0.59 (1.25) | 0.635 | 0.92(8,628) | 0.497 | 0.00 |
| (n = 637) | Adj. | 0.14 (3.58) | 0.969 | –0.71 (5.03) | 0.888 | 1.61 (2.36) | 0.495 | 0.77 (1.28) | 0.549 | 0.90(13,623) | 0.550 | 0.00 |
| HDL-C (mmol/L) | Unadj. | –0.07 (0.16) | 0.661 | –0.30 (0.21) | 0.151 | –0.28 (0.09) | 0.001 | 0.00 (0.05) | 0.999 | 14.17(8,516) | <0.001 | 0.17 |
| (n = 525) | Adj. | –0.08 (0.16) | 0.593 | –0.14 (0.22) | 0.535 | –0.09 (0.09) | 0.349 | –0.04 (0.05) | 0.470 | 10.70(13,511) | <0.001 | 0.19 |
| LDL-C (mmol/L) | Unadj. | –0.03 (0.35) | 0.948 | 0.27 (0.48) | 0.576 | –0.52 (0.20) | 0.008 | 0.21 (0.11) | 0.063 | 2.08(8,516) | 0.036 | 0.02 |
| (n = 525) | Adj. | –0.08 (0.36) | 0.820 | 0.40 (0.52) | 0.437 | –0.51 (0.22) | 0.021 | 0.21 (0.12) | 0.074 | 1.42(13,511) | 0.146 | 0.01 |
| Triglycerides (mmol/L) | Unadj. | 0.26 (0.19) | 0.180 | 0.07 (0.26) | 0.791 | 0.18 (0.11) | 0.093 | 0.09 (0.06) | 0.155 | 8.13(8,516) | <0.001 | 0.10 |
| (n = 525) | Adj. | 0.17 (0.20) | 0.379 | 0.16 (0.28) | 0.564 | 0.08 (0.12) | 0.481 | 0.08 (0.06) | 0.203 | 6.80(13,511) | <0.001 | 0.13 |
| CMR | Unadj. | –0.51 (1.76) | 0.770 | 5.67 (2.40) | 0.018 | 1.82 (1.02) | 0.075 | 0.64 (0.63) | 0.313 | 18.70(8,395) | <0.001 | 0.26 |
| (n = 404) | Adj. | 0.16 (1.77) | 0.704 | 2.78 (2.53) | 0.272 | –0.33 (1.12) | 0.766 | 1.19 (0.64) | 0.062 | 13.70(13,390) | <0.001 | 0.29 |
Notes: Bold values denote statistical significance at the p < 0.05 level. Unadjusted and adjusted models accounted for school clustering using robust standard error and included effects of the time-use composition tested as a series of ilr coordinates. Adjusted models additionally adjusted for data source (LOOK or Transform-Us!), age, sex and SES. All coordinates represent ilr of simplex coefficients of time in longer vs. shorter bouts of 1 intensity, keeping the total time within that intensity constant. The β-estimates evaluate associations between an outcome and an increase in time accumulated in longer vs. shorter bouts. Longer bouts of SED were defined as bouts ≥5 min. Shorter SED was defined as bouts of <5 min. Similarly, longer PA bouts (i.e., LPA, MPA, and VPA) were defined as bouts ≥1 min, and shorter PA bouts were defined as the time accumulated in bouts of <1 min. “Other time” consisted of non-wear/sleep.
Abbreviations: Adj. = adjusted; CMR score = cardiometabolic risk score; DBP = diastolic blood pressure; df = degree of freedom; HDL-C = high-density lipoprotein cholesterol; ilr = isometric log ratio; LDL-C = low-density lipoprotein cholesterol; LPA = light-intensity physical activity; MPA = moderate-intensity physical activity; SBP = systolic blood pressure; SED = sedentary behavior; Unadj. = Unadjusted; VPA = vigorous-intensity physical activity; WC = waist circumference; zBMI = body mass index converted to the World Health Organization Child Growth Standards age and sex standardized z-values.20
The unadjusted and adjusted models showed evidence of an association of the overall time-use composition with 6 of 8 cardiometabolic health biomarkers: zBMI, WC, SBP, HDL-C, triglycerides, and CMR score (global F test p < 0.05; specific values reported in Table 3). A significant association of the time-use composition with LDL-C was seen in the unadjusted model (global F test p = 0.036), but was attenuated with adjustment for confounders (global F-test p = 0.146). Closer inspection of the individual ilr coordinates when the test of the full composition was significant (zBMI, WC, SBP, HDL-C, triglycerides, and CMR score) (Table 3) showed that a higher ratio of time in longer relative to shorter bouts of LPA (Long LPA: Short LPA) was associated with higher zBMI (β = 1.79; SE = 0.68; p = 0.009) and WC (β = 18.35; SE = 4.78; p < 0.001). Thus, higher levels of continuous LPA relative to sporadic LPA was associated with higher estimated zBMI and WC. The associations for other individual ilr coordinates, across the other significant, adjusted time-use models (global F test p < 0.05), were smaller and not statistically significant (all p ≥ 0.05; specific values reported in Table 3). The unadjusted models revealed some further associations that were attenuated in size and no longer statistically significant after adjustment for confounders.
More time in LPA relative to MPA, VPA, and “other time” was associated with lower WC (β = ‒9.10; SE = 3.75; p = 0.016). More time in VPA relative to “other time” was also associated with lower WC (β = ‒2.87; SE = 1.16; p = 0.014). In addition, more time in SED vs. all other behaviors, and more time in MPA relative to VPA and “other time”, was associated with higher WC (β = 7.60; SE = 3.34; p = 0.023 and β = 4.08; SE = 1.84; p = 0.027; respectively). After accounting for confounders, no evidence of an association between any of the other individual ilr coordinates with zBMI, WC, SBP, HDL-C, triglycerides, or CMR score, was observed (Supplementary Table 3).
3.3. Estimated cardiometabolic biomarkers based on different ratios of time spent in longer vs. shorter bouts
Estimated mean zBMI and WC for different ratios of longer and shorter LPA are visually presented in Fig. 1. Only these individual ilr coordinates indicated significance (p < 0.05) within the adjusted models, with an observed overall significance between the time-use composition and a cardiometabolic health marker (global F test p < 0.05). All other estimations are visualized in the Supplementary Figs. 1‒8.
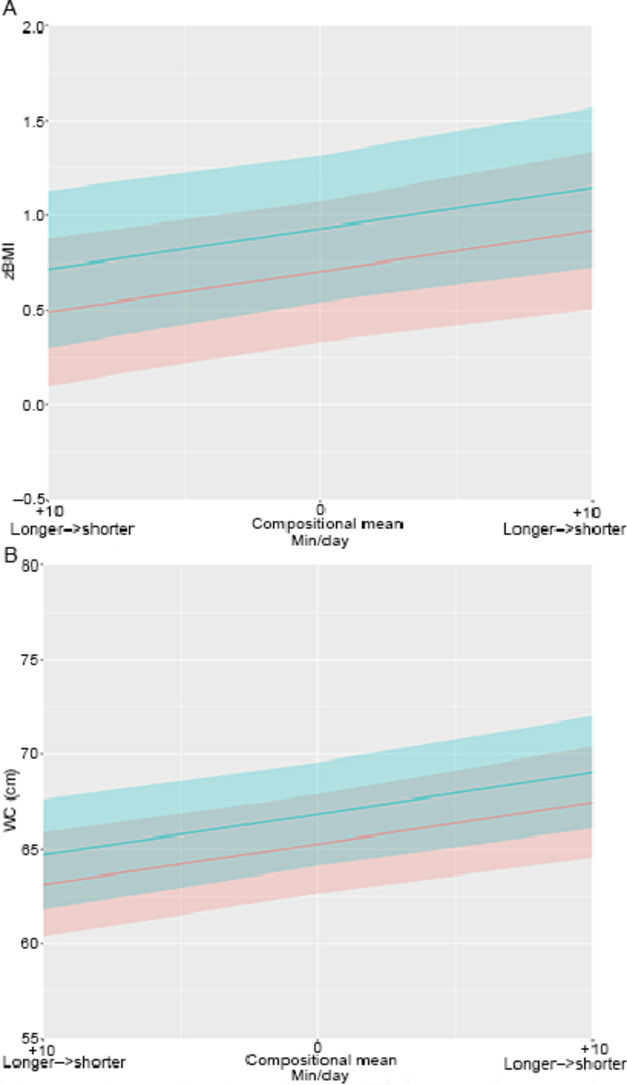
Fig. 1.

(A) Estimated zBMI and (B) WC for different ratios of longer and shorter LPA bouts. Estimated adiposity markers for different ratios of longer and shorter LPA bouts. Plots include estimated mean zBMI and WC with 95% confidence intervals. The overall time within the intensity of interest was kept constant, while the ratio between longer and shorter behaviors was alternated. Times in all other components were set at the mean observed values. Blue stands for boys, red stands for girls, and grey stands for overlapping 95% confidence intervals. LPA = light-intensity physical activity; WC = waist circumference; zBMI = body mass index converted to the World Health Organization Child Growth Standards age and sex standardized z-values.
Fig. 1A, 1B shows that, relative to the existing compositional mean, performing an additional 10 min of LPA in 1 or more continuous longer bouts rather than in shorter bouts was consistent with approximately 0.2 higher mean zBMI (0.7 vs. 0.9, respectively) and 2.2 cm higher mean WC (65.3 cm vs. 67.5 cm, respectively) in girls. Similar estimations were predicted for boys (Fig. 1).
4. Discussion
This study examined daily time-use compositions of youth 7–13 years old and their associations with cardiometabolic biomarkers. The study is novel in that it not only factored in activity intensity (SED, LPA, MPA, and VPA) but also determined whether these activity intensities were accumulated in longer bouts (≥5-min SED and ≥1-min PA) or shorter bouts (<5-min SED and <1-min PA) within a 24-h composition. In particular, the novel sequential binary partition chosen was advantageous for the comparison of relative time spent in longer vs. shorter bouts. Although this provided a slightly complicated view of the relative volume of time spent in each activity intensity versus others, it makes the current research an original contribution to activity pattern research in youth.
4.1. Associations between time-use composition and cardiometabolic biomarkers
The results demonstrated that the overall time-use composition was associated with most cardiometabolic biomarkers, with one of the important components of the composition being LPA bout duration, particularly in relation to adiposity. Results indicated that the same amount of LPA accumulated with a more continuous accumulation pattern (i.e., more time in longer rather than shorter bouts) was linked with poorer WC and zBMI. While the cross-sectional design limits causal inference, it is possible that performing a specific amount of LPA frequently in shorter bursts rather than in longer bouts at one time may be beneficial for limiting adiposity.
The results also suggested that different relative time-use of total volumes (i.e., long and short bouts combined) of SED, LPA, MPA, and VPA were important components of the time-use composition. Specifically, more SED (less PA and “other time”) and more MPA (less VPA and “other time”) were associated with higher average WC, and more VPA (less “other time”) and, somewhat unexpectedly, more LPA (less MPA, VPA, and “other time”) were associated with lower WC. Effect sizes were in a similar direction for other health markers, but were not statistically significant. Taken collectively, the findings across the different ilr parameters suggest that the most favorable cardiometabolic biomarker levels were observed with higher high-intensity PA (VPA) and lower sedentary time. These findings are consistent with previous research using similar methods (e.g., 15-s epoch accelerometer data39 and compositional data analysis40,41) and confirm that participating in high-intensity PA, including MPA and VPA, may be important for youth health.
4.2. Comparisons to previous literature
To the best of our knowledge, no research has used compositional data analysis to examine bout durations across the activity spectrum, including SED and PA bouts, to assess associations with a range of cardiometabolic outcomes. One study by Gába and colleagues14 used a similar approach, except they only investigated SED bout durations alongside total volumes of other intensities and their associations with adiposity. Their results suggested that adiposity could be improved by replacing middle-length SED bouts (defined as 10–29 min) with shorter SED bouts (1–9 min), yet they found no associations for replacements with long SED bouts (≥30 min duration).14 This contrasts with our study, which did not find significant associations for a particular (shorter or longer) type of SED bouts. These contrasting results may be explained by methodological differences, such as the sequential binary partition chosen and the different thresholds for longer vs. shorter bouts. Because we identified no other studies that have used compositional analysis to assess bout durations in youth, it is difficult to further compare our findings, or the findings of Gába and colleagues,14 with additional research.
Nevertheless, a few studies have investigated youth activity patterns and associations with cardiometabolic biomarkers42,43 using different analytical methods. For example, Holman and colleagues42 used logistic regression models to evaluate all MVPA (i.e., total volume), and MVPA accumulated in short bouts (i.e., <5 min, <10 min) or long bouts (i.e., ≥5 min, ≥10 min) among participants who were 6‒19 years old and did not observe differences in high cardiometabolic risk vs. normal cardiometabolic risk. Despite some methodological differences (e.g., 60-s epoch vs. 15-s epoch; different thresholds for bout durations), their finding are in line with the findings in our study, which also failed to detect evidence to suggest that certain MPA and/or VPA bouts are more strongly associated with health than others.
Our findings are also partially in line with a study by Aadland et al.,43 who compared shorter and longer bouts of PA in youth using a multivariate pattern analysis approach. Whereas our study only found significant effects of bout length for LPA, the Aadland et al.43 study found that short intermittent bursts of PA of all intensities—including MPA and VPA—were favorable for youth cardiometabolic health.43 Aadland et al.43 explained their findings through the existence of an interrelation between LPA and VPA, with short bouts of LPA being positively related to VPA and vice versa. Whilst this finding was not specifically observed in our sample, the similar LPA observations across these 2 studies suggest that the accumulation of LPA may be relevant for youth health and therefore warrants further investigation.
4.3. Practical and public health implications
Our findings suggest that activity patterns may play a role in children's cardiometabolic health—and particularly adiposity—beyond total volumes of PA and SED. Our results were more supportive of encouraging children to accumulate PA through facilitating their natural sporadic accumulation patterns44,45 rather than by trying to alter these patterns by accruing PA in longer bouts. One important caveat in the practical application of this type of evidence is that statistical models of effects of patterns at a fixed volume are hypothetical scenarios of what might be expected. In practical, real-life terms, changes in volume may well occur alongside any intervention that targets accumulation patterns because these 2 characteristics of PA are intrinsically linked. Although the main focus of our study was on PA and SED bouts, and not necessarily on total volumes, the results do suggest that it is not just bouts that are important for health. Specifically, more relative time in total VPA (less “other time”) and LPA (less MPA, VPA, and “other time”) was associated with lower WC, and more relative time in SED (less PA and “other time”) and MPA (less VPA and “other time”) was associated with higher WC. While further evidence is required to determine the impact of longer activity bouts on children's health, the present findings support the recent removal of a minimum threshold of 10 min sustained MVPA in the US guidelines;46 instead, the focus should be on total volume of MVPA.
4.4. Strengths and limitations
The main strengths of our study are the large sample size and the objective measurement of activity patterns and cardiometabolic biomarkers. The main limitations in most previous PA and SED accelerometer and health studies are the combined assessment of intensities, adjustment for other intensities and the consequent potential collinearity issues arising from these factors (particularly when investigating SED with the inclusion of PA adjustments). This issue was overcome in our study through the use of compositional data analysis, which allows for handling of multiple PA and SED patterns within a joint statistical model.
Our study also had some limitations. First, cross-sectional data were pooled. Thus, the estimated differences in cardiometabolic biomarkers cannot be directly interpreted as an effect of time reallocation from one component to another. Second, our study was not designed to explain the possible mechanisms by which significant effects of bout duration were seen for adiposity but not for blood biomarkers (e.g., lipids, CMR score). However, we might speculate that the participants’ age range and their limited cumulative exposure to unhealthy lifestyle behaviors, such as extensive sitting, may have been contributing factors. In addition, there was a higher power for detection of potential associations with adiposity vs. other cardiometabolic biomarkers, which was due to the adiposity subset being a larger subset compared to those who consented to blood collection. Longitudinal studies with larger samples with data on risk factors other than adiposity are needed in order to investigate the long-term health effects of continuous and sporadic activity patterns. Third, the measurement protocol used in our study assumes that habitual patterns were captured, yet it only truly reflects the capture of patterns for the past 4–7 days. Fourth, as in much of the current literature, the data used in our study came from behaviors classified by waist-worn accelerometers processed by applying thresholds to epoch data rather than being measured by posture-based devices. This measurement approach has acceptable validity for capturing total volume of PA but has limited validity for measuring accumulation patterns such as SED bout durations.47 The accelerometer data used in our study was not examined as raw data, was not collected 24 h/day and did not include heart rate data. Consequently, this may have failed to capture some aspects of these youths’ highly intermittent accumulation patterns, their physiological responses related to certain accumulation patterns and potentially important differences between sleep and non-wear time. Because physiology and sleep are important factors in youth health,48,49 future studies should consider using continuous observations with 24-h wear protocols. Further improvements could come from using posture-based devices (such as activPAL, http://www.palt.com/) to measure SED; ideally, heart rate could also be monitored, thus capturing physiological responses. Fifth, although models were adjusted for age, it was not possible to adjust for puberty because this was not assessed in the Transform-Us! study. It should be noted that the Transform-Us! participants were younger than the LOOK participants. Biological differences in maturity may have influenced results, but chronological age is not a strong indicator for maturity stage. In addition, no data on ethnicity and/or race were collected in our study. Future studies could incorporate these characteristics. Finally, because our study was exploratory and a large number of tests were performed without significance adjustment, there is an increased likelihood of false discovery due to multiple testing. Nevertheless, because behavioral research in youth is an understudied area, a deliberate decision was made not to adjust for multiple comparisons.50,51 Although the results presented here focus on statistically significant findings (using p values, which can be problematic),52 the full results, including effect sizes, standard errors, and plots, are available in the tables included in the Supplementary Appendix, which allows for interpretation with and without p values.
5. Conclusion
In summary, this study was the first, to our knowledge, to investigate associations between patterns of PA and SED and a range of cardiometabolic health markers using compositional data analysis in youth. The main findings were that the time-use composition, which specifically included time in longer and shorter bouts of SED and PA, was significantly associated with most cardiometabolic biomarkers. Specifically, the accumulation of the same amount of LPA in a more sporadic rather than sustained manner (i.e., shorter vs. longer bouts) was associated with lower zBMI and WC. While the findings are only cross-sectional, they suggest that accumulating LPA frequently in short bursts may result in less adiposity than engaging in the same amount of LPA in longer bouts less regularly. However, the preliminary findings of this study and the extant literature should be corroborated (or refuted) with evidence from other samples, collected using alternative device-based measurements (especially those having high validity for accumulation patterns and assessment of SED), and that have measurements of sleep and longitudinal designs. Additional research is warranted in order to develop targeted interventions that benefit health outcomes and to establish whether existing movement guidelines should be refined to include recommendations relating to specific activity patterns and intensities.
Acknowledgments
Acknowledgments
The authors acknowledge the assistance of Eoin O'Connell, who developed the customized Excel macro used in this study. We would also like to thank the staff and participants in the LOOK and Transform-Us! projects and the participants’ parents and schools for their participation in this research. In particular, we would like to thank the chief investigators in the original Transform-Us! and LOOK trials. Finally, we would like to thank Dr Lauren Arundell.
Authors’ contributions
SJJMV led the project, including running the statistical analyses and drafting the manuscript, this included critically revising it for important intellectual content, based on co-author feedback; JS contributed in designing the study and writing the manuscript and was involved in the original study design of the LOOK and Transform-US! trials; KEL, JAMF, EW, RML, AT, and NDR contributed equally in designing the study and writing the manuscript; RMD, EC, DWD, RMT, RDT, and LSO were involved in the original study design of the LOOK and Transform-Us! trials. All authors helped draft the manuscript. All authors have read and approved the final version of the manuscript, and agree with the order of presentation of the authors.
Competing interests
This research involves secondary data analysis. The LOOK study received funding from the Commonwealth Education Trust and the Canberra Hospital Clinical Trials Unit. Transform-Us! was supported by a National Health and Medical Research Council (NHMRC) Project Grant (ID: 533815) and a Diabetes Australia Research Trust grant. This research was also supported by the NHMRC Centre of Research Excellence (APP1057608). SJJMV holds a Deakin University PhD Scholarship. NDR is supported by a Future Leader Fellowship from the National Heart Foundation (NHF) of Australia (101895). JAMF is supported by the Spanish Ministry of Science, Innovation and Universities under the project CODAMET (RTI2018-095518-B-C21, 2019‒2021). JS is supported by an NHMRC Leadership Level 2 Fellowship (APP1176885). DWD is supported by an NHMRC Senior Research Fellowship (APP1078360) and the Victorian Government's Operational Infrastructure Support Program. RML is supported by an NHF of Australia Postdoctoral Research Fellowship (102109) and an NHMRC Emerging Leadership Fellowship (APP1175250). LSO is supported by an NHMRC/NHF Postgraduate Fellowship (APP1056551) and an NHMRC Early Career Fellowship (APP1158487). All the support had no involvement in the study design and writing of the manuscript or the decision to submit it for publication. The authors declare that they have no other competing interests.
Footnotes
Peer review under responsibility of Shanghai University of Sport.
Supplementary material associated with this article can be found in the online version at doi:10.1016/j.jshs.2021.03.004.
Supplementary materials
References
- 1.Carson V, Hunter S, Kuzik N, et al. Systematic review of sedentary behavior and health indicators in school-aged children and youth: An update. Appl Physiol Nutr Metab. 2016;41(Suppl. 3):S240–S265. doi: 10.1139/apnm-2015-0630. [DOI] [PubMed] [Google Scholar]
- 2.Poitras VJ, Gray CE, Borghese MM, et al. Systematic review of the relationships between objectively measured physical activity and health indicators in school-aged children and youth. Appl Physiol Nutr Metab. 2016;41(Suppl. 3):S197–S239. doi: 10.1139/apnm-2015-0663. [DOI] [PubMed] [Google Scholar]
- 3.Chaput JP, Willumsen J, Bull F, et al. 2020 WHO guidelines on physical activity and sedentary behavior for children and adolescents aged 5–17 years: Summary of the evidence. Int J Behav Nutr Phys Act. 2020;17:141. doi: 10.1186/s12966-020-01037-z. [DOI] [PMC free article] [PubMed] [Google Scholar]
- 4.Evenson KR, Wen F, Herring AH. Associations of accelerometry-assessed and self-reported physical activity and sedentary behavior with all-cause and cardiovascular mortality among US adults. Am J Epidemiol. 2016;184:621–632. doi: 10.1093/aje/kww070. [DOI] [PMC free article] [PubMed] [Google Scholar]
- 5.Diaz KM, Howard VJ, Hutto B, et al. Patterns of sedentary behavior and mortality in U.S. middle-aged and older adults: A national cohort study. Ann Intern Med. 2017;167:465–475. doi: 10.7326/M17-0212. [DOI] [PMC free article] [PubMed] [Google Scholar]
- 6.Chastin SF, Egerton T, Leask C, Stamatakis E. Meta-analysis of the relationship between breaks in sedentary behavior and cardiometabolic health. Obesity (Silver Spring) 2015;23:1800–1810. doi: 10.1002/oby.21180. [DOI] [PubMed] [Google Scholar]
- 7.Tremblay MS, Aubert S, Barnes JD, et al. Sedentary Behavior Research Network (SBRN)—Terminology consensus project process and outcome. Int J Behav Nutr Phys Act. 2017;14:75. doi: 10.1186/s12966-017-0525-8. [DOI] [PMC free article] [PubMed] [Google Scholar]
- 8.Verswijveren SJJM, Lamb KE, Bell LA, Timperio A, Salmon J, Ridgers ND. Associations between activity patterns and cardio-metabolic risk factors in children and adolescents: A systematic review. PLoS One. 2018;13 doi: 10.1371/journal.pone.0201947. [DOI] [PMC free article] [PubMed] [Google Scholar]
- 9.Andersen LB, Harro M, Sardinha LB, et al. Physical activity and clustered cardiovascular risk in children: A cross-sectional study (The European Youth Heart Study) The Lancet. 2006;368:299–304. doi: 10.1016/S0140-6736(06)69075-2. [DOI] [PubMed] [Google Scholar]
- 10.Chastin SF, Palarea-Albaladejo J, Dontje ML, Skelton DA. Combined effects of time spent in physical activity, sedentary behaviors and sleep on obesity and cardio-metabolic health markers: A novel compositional data analysis approach. PLoS One. 2015;10:e0139984. doi: 10.1371/journal.pone.0139984. [DOI] [PMC free article] [PubMed] [Google Scholar]
- 11.Dumuid D, Pedišić Ž, Palarea-Albaladejo J, Martín-Fernández JA, Hron K, Olds T. Compositional data analysis in time-use epidemiology: What, why, how. Int J Environ Res Public Health. 2020;17:2220. doi: 10.3390/ijerph17072220. [DOI] [PMC free article] [PubMed] [Google Scholar]
- 12.Winkler EAH, Chastin S, Eakin EG, et al. Cardiometabolic impact of changing sitting, standing, and stepping in the workplace. Med Sci Sports Exerc. 2018;50:516–524. doi: 10.1249/MSS.0000000000001453. [DOI] [PubMed] [Google Scholar]
- 13.Fairclough SJ, Dumuid D, Mackintosh KA, et al. Adiposity, fitness, health-related quality of life and the reallocation of time between children's school day activity behaviors: A compositional data analysis. Prev Med Rep. 2018;11:254–261. doi: 10.1016/j.pmedr.2018.07.011. [DOI] [PMC free article] [PubMed] [Google Scholar]
- 14.Gába A, Pedišić Ž, Štefelová N, et al. Sedentary behavior patterns and adiposity in children: A study based on compositional data analysis. BMC Pediatr. 2020;20:147. doi: 10.1186/s12887-020-02036-6. [DOI] [PMC free article] [PubMed] [Google Scholar]
- 15.Salmon J, Arundell L, Hume C, et al. A cluster-randomized controlled trial to reduce sedentary behavior and promote physical activity and health of 8-9 year olds: The Transform-Us! study. BMC Public Health. 2011;11:759. doi: 10.1186/1471-2458-11-759. [DOI] [PMC free article] [PubMed] [Google Scholar]
- 16.Telford RM, Telford RD, Cunningham RB, Cochrane T, Davey R, Waddington G. Longitudinal patterns of physical activity in children aged 8 to 12 years: The LOOK study. Int J Behav Nutr Phys Act. 2013;10:81. doi: 10.1186/1479-5868-10-81. [DOI] [PMC free article] [PubMed] [Google Scholar]
- 17.Verswijveren SJJM, Lamb KE, Leech RM, et al. Activity accumulation and cardiometabolic risk in youth: A latent profile approach. Med Sci Sports Exerc. 2020;52:1502–1510. doi: 10.1249/MSS.0000000000002275. [DOI] [PubMed] [Google Scholar]
- 18.Verswijveren SJJM, Lamb KE, Timperio A, et al. Cross-sectional associations of total daily volume and activity patterns across the activity spectrum with cardiometabolic risk factors in children and adolescents. Int J Environ Res Public Health. 2020;17:4286. doi: 10.3390/ijerph17124286. [DOI] [PMC free article] [PubMed] [Google Scholar]
- 19.Garnett SP, Baur LA, Cowell CT. Waist-to-height ratio: A simple option for determining excess central adiposity in young people. Int J Obes (Lond) 2008;32:1028–1030. doi: 10.1038/ijo.2008.51. [DOI] [PubMed] [Google Scholar]
- 20.WHO Multicentre Growth Reference Study Group. WHO child growth standards: Length/height-for-age, weight-for-age, weight-for-length, weight-for-height and body mass index-for-age: Methods and development. Geneva: WHO Press; 2006.
- 21.Anthamatten P, Brink L, Lampe S, Greenwood E, Kingston B, Nigg C. An assessment of schoolyard renovation strategies to encourage children's physical activity. Int J Behav Nutr Phys Act. 2011;8:27. doi: 10.1186/1479-5868-8-27. [DOI] [PMC free article] [PubMed] [Google Scholar]
- 22.Chinapaw MJ, Altenburg TM, van Eijsden M, Gemke RJ, Vrijkotte TG. Screen time and cardiometabolic function in Dutch 5–6 year olds: Cross-sectional analysis of the ABCD-study. BMC Public Health. 2014;14:933. doi: 10.1186/1471-2458-14-933. [DOI] [PMC free article] [PubMed] [Google Scholar]
- 23.Altenburg TM, de Niet M, Verloigne M, et al. Occurrence and duration of various operational definitions of sedentary bouts and cross-sectional associations with cardiometabolic health indicators: The ENERGY-project. Prev Med. 2015;71:101–106. doi: 10.1016/j.ypmed.2014.12.015. [DOI] [PubMed] [Google Scholar]
- 24.Robusto KM, Trost SG. Comparison of three generations of ActiGraph™ activity monitors in children and adolescents. J Sports Sci. 2012;30:1429–1435. doi: 10.1080/02640414.2012.710761. [DOI] [PMC free article] [PubMed] [Google Scholar]
- 25.Cain KL, Sallis JF, Conway TL, Van Dyck D, Calhoon L. Using accelerometers in youth physical activity studies: A review of methods. J Phys Act Health. 2013;10:437–450. doi: 10.1123/jpah.10.3.437. [DOI] [PMC free article] [PubMed] [Google Scholar]
- 26.Gabel L, Ridgers ND, Della Gatta PA, et al. Associations of sedentary time patterns and TV viewing time with inflammatory and endothelial function biomarkers in children. Pediatr Obes. 2016;11:194–201. doi: 10.1111/ijpo.12045. [DOI] [PMC free article] [PubMed] [Google Scholar]
- 27.Freedson P, Pober D, Janz KF. Calibration of accelerometer output for children. Med Sci Sports Exerc. 2005;37(Suppl. 11):S523–S530. doi: 10.1249/01.mss.0000185658.28284.ba. [DOI] [PubMed] [Google Scholar]
- 28.Evenson KR, Catellier DJ, Gill K, Ondrak KS, McMurray RG. Calibration of two objective measures of physical activity for children. J Sports Sci. 2008;26:1557–1565. doi: 10.1080/02640410802334196. [DOI] [PubMed] [Google Scholar]
- 29.Australian Bureau of Statistics . Census of population and housing: Socio-Economic Indexes for Areas (SEIFA), Australia - Data only. 2006. http://www.abs.gov.au/ausstats/abs@.nsf/Lookup/4364.0.55 Cat: 2033.0.55.001. Available at: 003Chapter12011-2012. [accessed 20.12.2017] [Google Scholar]
- 30.Zeileis A, Hothorn T. Diagnostic checking in regression relationships. R News. 2002;2:7–10. [Google Scholar]
- 31.van den Boogaart KG, Tolosana-Delgado R, Bren M. Compositions: Compositional data analysis. R package version 1; Vienna; The R Foundation; 2018. pp. 40–42. [Google Scholar]
- 32.Palarea-Albaladejo J, Martín-Fernández JA. zCompositions - R package for multivariate imputation of nondetects and zeros in compositional data sets. Chemometrics Intellig Lab Syst. 2015;143:85–96. [Google Scholar]
- 33.Aitchison J. The statistical analysis of compositional data. J R Stat Soc. 1982;44:139–160. [Google Scholar]
- 34.Dumuid D, Pedišić Ž, Stanford TE, et al. The compositional isotemporal substitution model: A method for estimating changes in a health outcome for reallocation of time between sleep, physical activity and sedentary behavior. Stat Methods Med Res. 2019;28:846–857. doi: 10.1177/0962280217737805. [DOI] [PubMed] [Google Scholar]
- 35.Hron K, Filzmoser P, Thompson K. Linear regression with compositional explanatory variables. J Appl Stat. 2012;39:1115–1128. [Google Scholar]
- 36.Martín-Fernández JA. Comments on: Compositional data: The sample space and its structure. TEST. 2019;28:653–657. [Google Scholar]
- 37.Egozcue JJ, Pawlowsky-Glahn V, Mateu-Figueras G, Barcelo-Vidal C. Isometric logratio transformations for compositional data analysis. Math Geol. 2003;35:279–300. [Google Scholar]
- 38.Egozcue JJ, Pawlowsky-Glahn V. Groups of parts and their balances in compositional data analysis. Math Geol. 2005;37:795–828. [Google Scholar]
- 39.Kracht CL, Champagne CM, Hsia DS, et al. Association between meeting physical activity, sleep, and dietary guidelines and cardiometabolic risk factors and adiposity in adolescents. J Adolesc Health. 2020;66:733–739. doi: 10.1016/j.jadohealth.2019.12.011. [DOI] [PMC free article] [PubMed] [Google Scholar]
- 40.Grgic J, Dumuid D, Bengoechea EG, et al. Health outcomes associated with reallocations of time between sleep, sedentary behavior, and physical activity: A systematic scoping review of isotemporal substitution studies. Int J Behav Nutr Phys Act. 2018;15:69. doi: 10.1186/s12966-018-0691-3. [DOI] [PMC free article] [PubMed] [Google Scholar]
- 41.Carson V, Tremblay MS, Chaput JP, McGregor D, Chastin S. Compositional analyses of the associations between sedentary time, different intensities of physical activity, and cardiometabolic biomarkers among children and youth from the United States. PLoS One. 2019;14 doi: 10.1371/journal.pone.0220009. [DOI] [PMC free article] [PubMed] [Google Scholar]
- 42.Holman RM, Carson V, Janssen I. Does the fractionalization of daily physical activity (sporadic vs. bouts) impact cardiometabolic risk factors in children and youth? PLoS One. 2011;6:e25733. doi: 10.1371/journal.pone.0025733. [DOI] [PMC free article] [PubMed] [Google Scholar]
- 43.Aadland E, Andersen LB, Anderssen SA, Resaland GK, Kvalheim OM. Associations of volumes and patterns of physical activity with metabolic health in children: A multivariate pattern analysis approach. Prev Med. 2018;115:12–18. doi: 10.1016/j.ypmed.2018.08.001. [DOI] [PubMed] [Google Scholar]
- 44.Bailey RC, Olson J, Pepper SL, Porszasz J, Barstow TJ, Cooper DM. The level and tempo of children's physical activities: An observational study. Med Sci Sports Exerc. 1995;27:1033–1041. doi: 10.1249/00005768-199507000-00012. [DOI] [PubMed] [Google Scholar]
- 45.Rowlands AV, Eston RG. The measurement and interpretation of children's physical activity. J Sports Sci Med. 2007;6:270–276. [PMC free article] [PubMed] [Google Scholar]
- 46.Piercy KL, Troiano RP, Ballard RM, et al. The physical activity guidelines for Americans. JAMA. 2018;320:2020–2028. doi: 10.1001/jama.2018.14854. [DOI] [PMC free article] [PubMed] [Google Scholar]
- 47.Carlson JA, Bellettiere J, Kerr J, et al. Day-level sedentary pattern estimates derived from hip-worn accelerometer cut-points in 8–12-year-olds: Do they reflect postural transitions? J Sports Sci. 2019;37:1899–1909. doi: 10.1080/02640414.2019.1605646. [DOI] [PMC free article] [PubMed] [Google Scholar]
- 48.Canadian Society for Exercise Physiology. Canadian 24-hour movement guidelines for children and youth: An integration of physical activity, sedentary behavior, and sleep. Ottawa: CSEP; 2016. [DOI] [PubMed]
- 49.Department of Health . AGPS; Canberra: 2019. Australian 24-hour movement guidelines for children and young people (5 to 17 years): An integration of physical activity, sedentary behavior, and sleep. [Google Scholar]
- 50.Perneger TV. What's wrong with Bonferroni adjustments. BMJ. 1998;316:1236–1238. doi: 10.1136/bmj.316.7139.1236. [DOI] [PMC free article] [PubMed] [Google Scholar]
- 51.Errisuriz VL, Golaszewski NM, Born K, Bartholomew JB. Systematic review of physical education-based physical activity interventions among elementary school children. J Prim Prev. 2018;39:303–327. doi: 10.1007/s10935-018-0507-x. [DOI] [PubMed] [Google Scholar]
- 52.Wasserstein RL, Lazar NA. The ASA statement on p-values: Context, process, and purpose. Am Stat. 2016;70:129–133. [Google Scholar]
Associated Data
This section collects any data citations, data availability statements, or supplementary materials included in this article.