

Abstract
Piperaquine (PQ) is an antimalarial drug that is highly protein-bound. Variation in plasma protein contents may affect the pharmacokinetic (PK) exposure of unbound drug, leading to alteration of clinical outcomes. All published methods for determination of PQ in human plasma measure the total PQ including both bound and unbound PQ to plasma proteins. There is no published method for unbound PQ determination. Here we report an ultra-high performance liquid chromatography tandem mass spectrometry (UHPLC-MS/MS) method for determination of PQ in human plasma filtrate prepared by filtering human plasma through Millipore Microcon® centrifugal filters (10k NMWL). The filter cup had to be treated with 5% benzalkonium chloride to reduce non-specific binding to the filter devices before filtration of plasma samples. Multiple reactions monitoring (MRM) of the ion pairs m/z 535/288 for PQ and m/z 541/294 for the internal standard (IS) was selected for quantification. When electrospray ionization (ESI+) was used, paradoxical matrix effect was observed despite the structure similarity of the deuterated IS: Ion suppression for PQ versus ion enhancement for the PQ-d6, even though they were closely eluted: 0.62 min versus 0.61 min. Separation was achieved on Evo C18 column (50 × 2.1 mm, 1.7 μm, Phenomenex Inc.) eluted with 10 mM NH4OH and MeCN. When atmospheric pressure chemical ionization in positive mode (APCI+) was used for ion source, matrix effect diminished. Separation was achieved on a PFP column (30 × 2.1 mm, 1.7 μm, Waters, Corp.) eluted with aqueous 20 mM ammonium formate 0.14% trifluoroacetic acid (A) and methanol-acetonitrile (4:1, v/v) containing 0.1% trifluoroacetic acid (B) at 0.8 mL/min flow rate in a gradient mode: 30–30–80–80–30–30%B (0–0.1–1.0–1.40–1.41–1.50 min). The retention time was 0.67 min for both PQ and the IS. The method was validated with a linear calibration range from 20 to 5,000 pg/mL and applied to clinical samples.
Keywords: Piperaquine, UHPLC-MS/MS, Plasma filtrate, Plasma, Unbound, free
1. Introduction
Piperaquine (PQ) is an antimalarial drug discovered over 50 years ago [1]. It is a highly (> 99%) protein bound in plasma [2,3]. However, only the unbound fraction is free to traverse biological membranes to exert its pharmacological effects. Variation in plasma protein content may affect the pharmacokinetic (PK) exposure of unbound drug, leading to alterations in clinical outcomes. Previously, we reported that total PQ exposure was 40% lower in pregnant women and children compared to that in non-pregnant adults [4,5], but the unbound PQ exposure in different populations remains unclear. To support the PK study of unbound PQ, a highly sensitive method for unbound PQ quantitation is needed.
Methods for free drug separation include equilibrium dialysis, ultrafiltration, microdialysis, and chromatographic techniques. Equilibrium dialysis is the most widely used method, but it is time-consuming (> 10 h) and may be problematic for poorly water-soluble compounds such as PQ [6]. Ultrafiltration is a fast alternative method, and it allows sample volume to be reduced [7]. Therefore, ultrafiltration was used in our study.
Methods for determination of total (including protein-bound and – unbound) PQ in human plasma have been well-documented [8–13]. The lower limit of quantitation (LLOQ) are ≥ 0.5 ng/mL in these methods. Methods for quantitation of purely unbound PQ in human plasma have not, to our knowledge, been reported. Here we reported an ultra-high performance liquid chromatography tandem mass spectrometry (UHPLC-MS/MS) method for protein-unbound PQ determination in human plasma at a calibration range of 20–5000 pg/mL.
2. Experimental
2.1. Chemicals and reagents
Piperaquine tetraphosphate tetrahydrate (MW 999.55, purity 99%) was purchased from A.K.Scientific Inc. (Union City, CA, USA). The internal standard (IS) piperaquine-d6 (PQ-d6 , MW 541.55, isotopic purity ≥ 99%) was purchased from AlSAchim, SAS (IllKirch, France). Benzalkonium chloride (BAK) was obtained from Alfa Aesar Co. Trifluoroacetic acid (TFA) and formic acid (FA) (Optima™ LC/MS grade), acetonitrile (MeCN), methanol (MeOH), and other common solvents (HPLC grade) were purchased from Fisher Scientific Co. (Fair Lawn, NJ, USA). Blank human plasma (K2EDTA added as anticoagulant) was obtained from Biological Specialty Co (Colmar, PA, USA); 10% MeCN 0.5% FA solution was prepared by adding 5 mL MeCN and 250 μL FA to 45 mL water (HPLC grade). Mobile phase A (20 mM NH4FA, 0.14%TFA) was prepared by adding 1.262 g NH4 FA and 1.4 mL TFA in 1 L water. Mobile phase B (0.1%TFA) was prepared by mixing 200 mL MeCN, 800 mL methanol and 1 mL TFA in 1 L glass bottle.
2.2. UHPLC-MS/MS conditions
The Sciex TripleQuad 6500+ tandem mass spectrometer was coupled with a Waters Acquity UPLC (I class) system (binary pumps, FL autosampler, column heater) managed with Analyst® 1.6.3 software. The gases for the MS system were supplied by a Genius 1024 gas generator (Peak Sci., Billerica, MA, USA). The MS conditions for PQ and the IS were optimized by constant infusion of 200 ng/mL PQ or IS into the MS at a flow rate of 10 μL/min while adjusting MS parameters to achieve maximal signal with both electrospray ionization (ESI+) and atmospheric pressure chemical ionization (APCI+) in positive mode. Data were processed with Analyst 1.6.3 (Sciex Inc, Redwood City, CA, USA). For the ESI+ method, LC separation was achieved on an Evo C18 column (50 × 2.1 mm, 1.7 μm, Phenomenex Inc., Torrance, CA, USA) eluted with 10 mM NH4OH (A) and MeCN (B) at 0.8 mL/min flow rate in a gradient mode: 50% B(0–0.1 min), 50–100%B (0.1–1.0 min), 100%B (1.0–1.2 min), and 50% B (1.21–1.25 min plus injection delay of ~0.5 min). The retention time was 0.62 min for PQ and 0.61 min for PQ-d6. For the APCI+ method, LC separation was achieved on a PFP column (30 × 2.1 mm, 1.7 μm, Waters Corp. Milford, MA, USA). Solvent A was 20 mM NH4 FA 0.14% TFA; solvent B was MeOH-MeCN (4:1, v/v) containing 0.1%TFA. The gradient elution program consisted of 30% solvent B (0 −0.1 min), from 30 to 80% B (0.1–1 min), 80% B (1.0–1.4 min), 80%–30% B (1.40–1.41 min), and 30% (1.41–1.50 min, plus injection delay of ~0.5 min). Retention times for PQ and the IS were both 0.67 min. The diverter valve was set to direct LC eluent to the MS source at 0.3 min and to waste line at 1.4 min.
2.3. Preparation of protein-free plasma filtrate
An Amicon® Ultracel® Centrifugal filter device (15 mL, NMWL 10k) was rinsed with 400 μL 5%BAK, centrifuged at 4000 rpm for 5 min and washed with 1 mL water twice. Human K2EDTA plasma (15 mL) was then loaded into the BAK-pretreated filter device and centrifuged at 4000 rpm (~2700 g) for 60 min to yield ~5 mL protein-free plasma filtrate, which was used for the preparation of calibrators and validation quality control (VQC) samples.
2.4. Preparation of PQ standards, quality controls, and internal standards
Two sets of PQ solutions at 1 mg/mL (free base) were prepared in MeCN-water (1:9, v/v) containing 0.5% FA with separately weighed PQ (tetraphosphate tetrahydrate salt, conversion factor, 0.5304). One solution was diluted in MeCN-water (1:9, v/v) containing 0.5% FA to prepare calibration standard working solutions consisting of 0.2, 0.5, 1, 2, 5, 10, 20, 50 ng/mL PQ. The other stock solution was diluted to prepare for the VQC working solutions (0.6, 15, 40 ng/mL). The working solutions were then diluted 10-fold in blank plasma filtrate to prepare for calibration standard samples at 20, 50, 100, 200, 500, 1000, 2000, and 5000 pg/mL PQ, and VQC samples at 60, 1500, and 4000 pg/mL PQ. The IS solution was prepared by dissolving PQ-d6 in MeCN-water (1:9, v/v) containing 0.5% FA to produce a final concentration of 500 pg/mL. The stock and working solutions were aliquoted and stored at −70 °C between uses.
2.5. Sample preparation
On the day of analysis, the working solutions were thawed to room temperature and vortexed. Calibrator and VQC working solutions were spiked into protein free plasma filtrate: 4 μL aliquots of each calibration standard working solution (0.2, 0.5, 1, 2, 5, 10, 20, and 50 ng/mL PQ) and VQC working solution (0.6, 15, 40 ng/mL PQ) were added into a 96-well plate containing 20 μL 0.5 ng/mL IS, followed by adding 36 μL protein free plasma filtrate and pipette-mixing 3 times. Aliquots (10 μL) of the mixed solution were injected onto the UHPLC-MS/MS system. For samples undergoing ultrafiltration, the Microcon® centrifugal filter devices (NMWL 10k) were treated with 5% BAK before use: To the filter cups was added 40 μL 5%BAK, vortexed briefly and centrifuged at 13,400 rcf for 3 min. Reversed the cups and centrifuged at 2000 rcf for 30 s to remove residual liquid in the cups. The BAK-treated cups were then placed on new tubes. Aliquots of 100 μL plasma samples were transferred into the BAK-treated filter devices, centrifuged at 13,400 g for 10 min, transferred 40 μL filtrate into a 96-well plate with 20 μL 0.5 ng/mL IS pre-added in the wells followed by pipette-mixing 3 times (Supplemental Figure S1). If insufficient filtrate in the tubes, then centrifuge additional 1–2 min to ensure 40 μL filtrate can be aliquoted.
2.6. Method validation
The assay was validated in terms of precision, accuracy, and recovery. The method was considered acceptable if precision, expressed as relative standard deviation (RSD), was less than 15% for intra and inter-day variation and RSD for the lower limit of quantitation (LLOQ) was < 20%. RSD was calculated as follows: 100 × SD/mean. The accuracy compared to the nominal value (% deviation) was required to be within 15% for intra- and inter-day comparison (deviation % for LLOQ < 20%). The LLOQ was determined with a signal intensity ≥ 5-fold blank response or an RSD < 20% if there was no blank signal. The back-calculated values for standards were required to be within 15% deviation of the target levels, with the exception of the LLOQ, for which 20% deviation was permitted.
Calibration curves were obtained by linear regression of the peak area ratio of PQ to the IS (Y-axis) versus the nominal PQ concentration (X-axis), with a weighting factor of 1/x. Intra-day precision and accuracy were determined by analysis of at least 5 replicates of each VQC sample at low (60 pg/mL), medium (1500 pg/mL), and high (4000 pg/mL) concentrations, along with a set of standards in one batch. The same procedure was repeated on 2 different days with different samples to determine inter-day precision and accuracy (n = 18 per concentration level). Precision was reported as RSD and accuracy as percent deviation from the nominal concentration (deviation %). Ultrafiltration recovery was evaluated by comparing the peak areas of PQ in MeCN-water (1:9, v/v) with 0.5% FA after ultrafiltration against those of the same samples directly injected into the UHPLC-MS/MS system.
3. Results
3.1. Method development
The method was designed for quantitation of unbound PQ in plasma samples collected for intensive PK studies between December 2014 and May 2017 in Tororo, Uganda; total PQ exposures were published previously[4, 5]. The trial was registered at ClinicalTrials.gov (NCT02163447). Procedures were approved by the Uganda National Council of Science and Technology and institutional review boards of Makerere University and the University of California, San Francisco. Written informed consent was obtained from study participants. Although the clinical samples were collected from 0–456 h post last dose, only samples from 0–24 h post last dose had sufficient volumes (> 100 μL) for additional study; PQ concentrations in these samples ranged from 9.67 to 1469 ng/mL. Previous studies reported > 99% PQ bound to plasma proteins [2], and our preliminary data suggested ~0.3% free PQ in plasma (unpublished data). Therefore, we sought to develop a method with a calibration range of 20–5000 pg/mL.
Our previous methods for total PQ determination in plasma were based on HPLC-MS/MS systems [9,13]. To gain more sensitivity, a UHPLC-MS/MS system, consisting of a Waters Acquity UPLC (I Class) and a Sciex TripleQuad 6500+ tandem mass spectrometer was used in this method. Furthermore, sensitivity could be enhanced with ammonium hydroxide in mobile phase solvent [14] and ESI+ as the ion source [15]. The ion pairs m/z 535/288 for PQ and m/z 541/294 for PQ-d6 were selected for MRM quantitation of PQ and m/z 535/260 was selected for confirmation. Representative mass spectra for product ions of PQ and PQ-d6 are shown in Fig. 1. Based on our previous method [13], an Evo C18 (50 × 2.1 mm, 1.7 μm, Phenomenex Inc., Torrance, CA, USA) was used for better stability in the basic mobile phase. Under the optimized conditions, the LLOQ reached 10 pg/mL, and linearity was found from 10–5000 pg/mL when clean PQ standard solutions in MeCN-water (1:9, v/v) with 0.5% FA were analyzed. However, matrix effects were observed when the method was applied to plasma filtrate samples. Paradoxically, ion suppression was observed for PQ, but ion enhancement was found for the deuterated IS PQ-d6 (Fig. 2): the PQ signal from a plasma filtrate sample with 600 pg/mL PQ was decreased by 49% (peak area 1.33 × 10⁵ versus 2.63 × 10⁵), while the IS signal increased by 219% (peak area 4.31 × 10⁵ versus 1.35 × 10⁵) when compared to those from clean solution. Therefore, we switched to an APCI+ ion source, which is less susceptible to matrix effect. LC conditions were tested with UPLC BEH C18 (2.1 × 50 mm, 1.7 μm, Waters Corp., Milford, MA, USA) and PFP columns (50 × 2.0 mm, 3 μm; 50 × 2.1 mm, 1.9 μm, Agilent Tech. Inc., Santa Clara, CA, USA). We selected a PFP column (30 × 2.1 mm, 1.7 μm, Waters Corp. Milford, MA, USA) for a lower LC system pressure but better retention of PQ. Initially, the same mobile phase solvents as in the previous total PQ method were used [9]. After we observed interfering peaks in select clinical samples, the mobile phase solvent B (0.1% TFA in MeCN) was modified to MeOH-MeCN (4:1, v/v) containing 0.1%TFA, and the flow rate was reduced from 1.2 mL/min to 0.8 mL/min. The retention time of PQ was also changed to 0.67 min (Fig. 3). The final optimized UHPLC-MS/MS parameters are shown in Table 1.
Fig. 1.
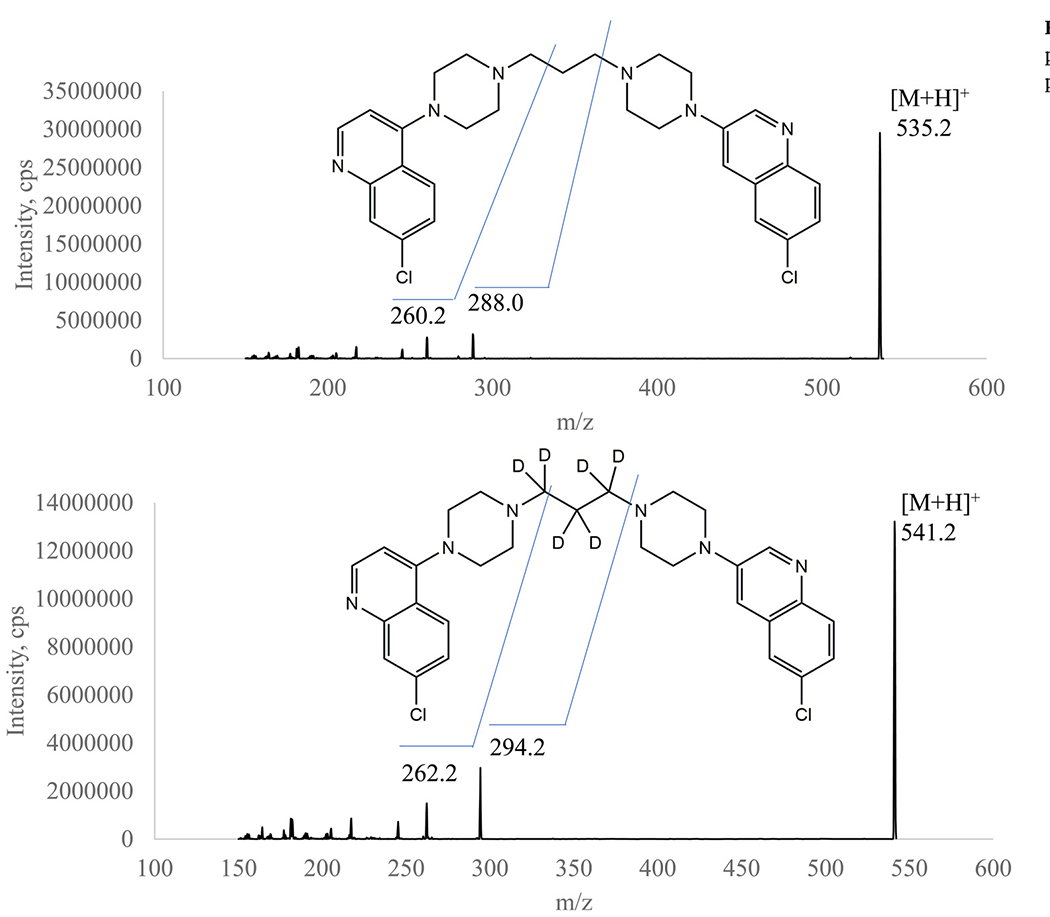
Representative product ion spectra of piperaquine (upper panel) and the IS (lower panel).
Fig. 2.
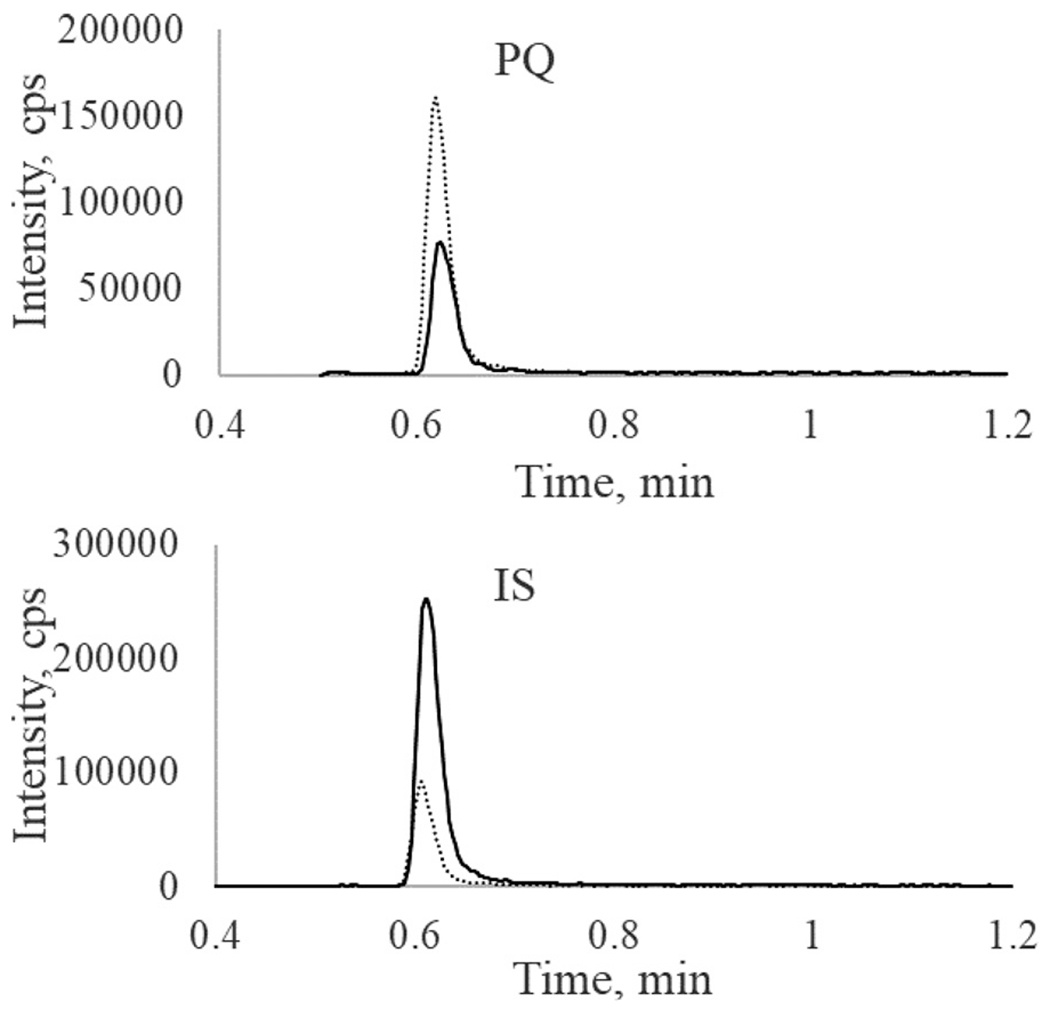
Paradoxical matrix effects for PQ and the IS (PQ-d6) in plasma filtrate. A sample with 600 pg/mL PQ in 10%MeCN 0.5%FA solution (dash line) and plasma filtrate (solid line) was analyzed with ESI+ as the ion source.
Fig. 3.
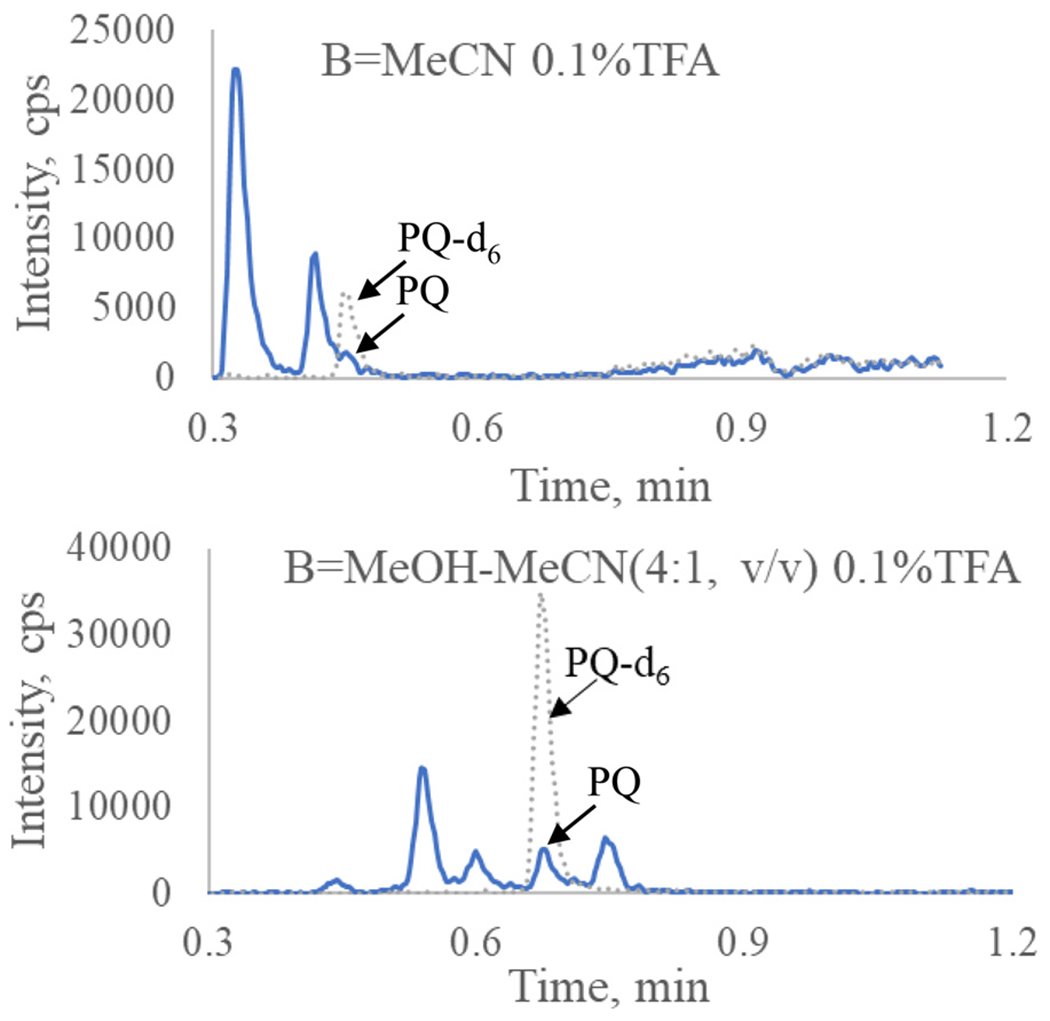
Chromatograms of PQ (solid line) and IS (dash line) from a clinical sample collected at 2 h post last dose. The PQ was separated from the interfering peak after mobile phase B switched to MeOH-MeCN (4:1, v/v) 0.1%TFA (lower panel). Flow rate was 1.2 mL/min (upper panel) or 0.8 mL/min (lower panel).
Table 1.
Optimized UHPLC-MS/MS parameters.
| MS parameters | ESI+ |
APCI+ |
||||||||||
|---|---|---|---|---|---|---|---|---|---|---|---|---|
| Source parameters | TEM | IS | CUR | Gas1 | Gas2 | CAD | TEM | NC | CUR | Gas1 | CAD | |
| °C | v | psi | psi | psi | psi | °C | v | psi | psi | psi | ||
| 500 | 2500 | 30 | 30 | 70 | 9 | 400 | 4 | 30 | 55 | 9 | ||
|
|
|
|||||||||||
| Compound parameters | DP, v | EP, v | CE, v | CXP, v | Dwell time, ms | DP, v | EP, v | CE, v | CXP, v | Dwell time, ms | ||
| 535/288 (PQ, quantitation) | 86 | 10 | 46 | 16 | 50 | 86 | 10 | 45 | 9 | 50 | ||
| 535/260 (PQ, confirmation) | 86 | 10 | 52 | 14 | 50 | 86 | 10 | 51 | 8 | 50 | ||
| 541/294 (PQ-d6, I.S.) | 86 | 10 | 46 | 16 | 50 | 86 | 10 | 45 | 9 | 50 | ||
| LC setting | ||||||||||||
| Column | Evo C18 (50 x 2.1mm, 1.7 um) | PFP (30 x 2.1mm, 1.7 um) | ||||||||||
| Mobile phase | A = 10 mM NH4OH | A = 20 mM NH4FA 0.14% TFA | ||||||||||
| B = MeCN | B = MeOH-MeCN (4:1, v/v) 0.1% TFA | |||||||||||
| Gradient Time, min | 0 | 0.1 | 1 | 1.2 | 1.21 | 1.25 | 0 | 0.1 | 1 | 1.4 | 1.41 | 1.5 |
| B,% | 50 | 50 | 100 | 100 | 50 | 50 | 30 | 30 | 80 | 80 | 30 | 30 |
| LLOQ signal/noise | S/N = 16 | S/N = 10 | ||||||||||
TEM, source temperature; NC, nebulizer current; CUR, curtain gas, Gas1, nebulizer gas; CAD, collision-activated dissociation; DP, declustering potential; EP, entrance potential; CE, collision energy; CXP, collision cell exit potential.
Drug binding proteins in plasma are mainly albumin (66 kDa) and alpha-acid glycoprotein (38–48 kDa) [16]. To avoid potential leakage of small proteins [17], filter devices with 10k NMWL were used in this method. To test for non-specific adsorption on the ultrafiltration devices, PQ solution was passed through the Microcon® filter devices (10k NMWL) at 13,400 g for 10 min. Significant loss of PQ was observed (Table 2). Since PQ is a weak base, we used BAK to pre-treat the filter cups [16]. After pre-treating the filter cups with 5% BAK, the recovery of PQ was significantly increased (> 80% with BAK treatment versus < 50% without BAK treatment), suggesting that non-specific binding of PQ was diminished (Table 2).
Table 2.
Ultrafiltration recovery, data represent mean peak area (× 103, n = 3).
| Untreated filter cups |
BAK-treated filter cups |
|||||||
|---|---|---|---|---|---|---|---|---|
| 10 ng/mL PQ* | 0.06 ng/mL PQ | 0.6 ng/mL PQ | 4 ng/mL PQ | |||||
| Direct injection | Filtrate | Direct injection | Filtrate | Direct injection | Filtrate | Direct injection | Filtrate | |
| Peak area (±SD) | 295±6 | 147±2 | 10.0±0.1 | 8.46±0.99 | 93.5±2.0 | 87.4±0.8 | 655±7 | 580±13 |
| Recovery, % | 50% | 84.3% | 93.4% | 88.5% | ||||
analyzed with API5000 system.
3.2. Method validation
The calibration curve was linear over the concentration range of 20 – 5000 pg/mL with a mean coefficient of determination (r2) of 0.9996 ± 0.0002. The signal-to-noise ratio at the LLOQ level (20 ng/mL PQ) was 10. Representative chromatograms of PQ and the IS from blank plasma filtrate and plasma filtrate spiked with IS and PQ at the LLOQ concentration are shown in Fig. 4.
Fig. 4.
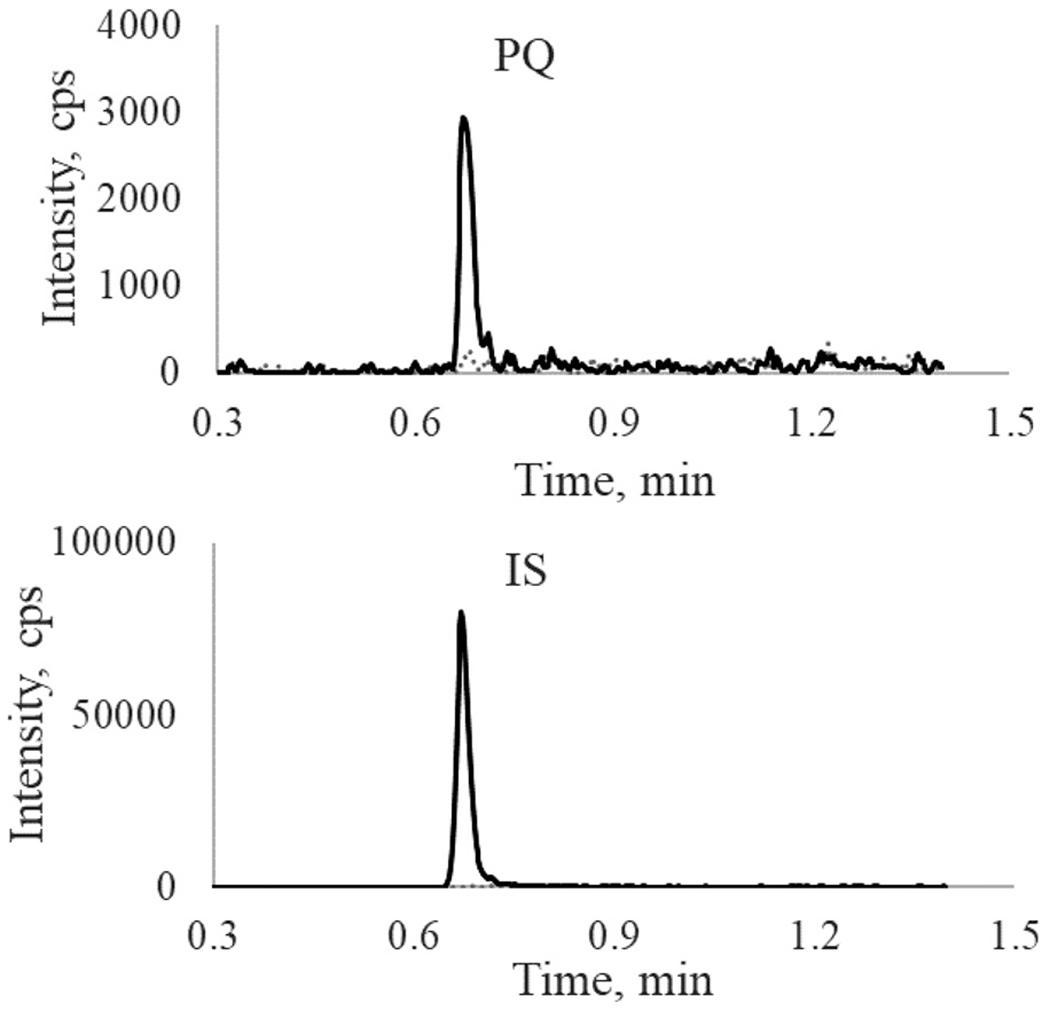
Representative chromatograms of PQ (upper panel) and PQ-d6 (IS) (lower panel) from blank and LLOQ samples: gray dash line, blank plasma filtrate; black solid line, PQ at LLOQ (20 pg/mL) level.
Since no plasma sample with a known unbound PQ concentration was available for method validation, the precision and accuracy reported here are from validation samples with PQ spiked into plasma filtrate. Intra-day precision (n = 6) over 3 days ranged from 2.5% to 11% at the three concentrations (60, 1500, and 4000 pg/mL), and inter-day precision ranged from 7.0% to 9.7%. The intra- and inter-day accuracy ranged from −8.9% to 9.8% and −4.9% to 4.2%, respectively. (Table 3).
Table 3.
Intra- and inter-day precision and accuracy.
| Intra-day | Inter-day | |||||||
|---|---|---|---|---|---|---|---|---|
| Nominal * | 0.02 | 0.06 | 1.5 | 4 | 0.02 | 0.06 | 1.5 | 4 |
| CV% | 6.2-15 | 4.4-11 | 4.7-11 | 2.5-8.6 | 12 | 9.7 | 8.5 | 7.0 |
| Dev% | 3.8-15 | (−8.9)-1.6 | (−7.3)-3.2 | (−0.67)-9.8 | 9.9 | −4.9 | −2.9 | 4.2 |
| n | 6 | 6 | 6 | 6 | 18 | 18 | 18 | 18 |
Nominal concentration unit is ng/mL
Matrix effect was determined by comparing the peak area of PQ in protein free plasma filtrate against the peak area of PQ in 10% MeCN 0.5% FA (Table 4). PQ and IS were spiked into a blank plasma filtrate in triplicate. The peak areas of PQ from plasma filtrate were slightly higher than those in clean solvents, suggesting an ion enhancement matrix effect. However, the IS normalized matrix effects (the peak area ratios) were all within 100 ± 5%. Therefore, the matrix effects did not impact quantitation of unbound PQ in plasma with this method when APCI+ was used as the ion source.
Table 4.
Matrix effect in plasma filtrate (n = 3).
| Conc (pg/mL) | Solvent (control) (mean±SD) | Plasma filtrate (mean±SD) | ME,% | |
|---|---|---|---|---|
| 60 | Peak area | 6.36±0.21 | 6.97±0.62 | 110 |
| Ratio | 0.349±0.015 | 0.338±0.026 | 96.8 | |
| 600 | Peak area | 57.8±4.8 | 65.3±4.6 | 113 |
| ratio | 3.29±0.19 | 3.29±0.48 | 100 | |
| 4000 | peak area | 389±14 | 462±3 | 119 |
| ratio | 23.3±0.5 | 23.6±0.6 | 101 |
Note: peak area is expressed as ×103 cps. Ratio is calculated with peak area of drug devided by peak area of IS.
Selectivity was evaluated by injecting 6 lots of blank plasma filtrate along with LLOQ samples. There were no interfering peaks observed at the retention time of PQ and the IS, suggesting that the method is highly selective (Supplemental Fig. S2).
To evaluate ultrafiltration reproducibility, we spiked PQ into blank plasma samples at 8, 80, and 800 ng/mL and tested in two separate days. Most of samples (11 out of 15) are within 20% difference from the mean values, but large difference (> 50%) was observed in two samples (Table 5).
Table 5.
Spiked plasma samples reanalysis
| initial analysis | re-analysis | |||
|---|---|---|---|---|
| conc., pg/mL | Fu, % | conc., pg/mL | Fu, % | % diff |
| 65.2 | 0.82 | 68.0 | 0.85 | 4.2 |
| 64.5 | 0.81 | 54.9 | 0.69 | −16.1 |
| 61.9 | 0.77 | 56.2 | 0.70 | −9.7 |
| 46.7 | 0.58 | 46.1 | 0.58 | −1.3 |
| 50.6 | 0.63 | 43.8 | 0.55 | −14.4 |
| 400 | 0.50 | 264 | 0.33 | −41.0 |
| 360 | 0.45 | 406 | 0.51 | 12.0 |
| 409 | 0.51 | 325 | 0.41 | −22.9 |
| 344 | 0.43 | 310 | 0.39 | −10.4 |
| 364 | 0.46 | 352 | 0.44 | −3.4 |
| 3910 | 0.49 | 3770 | 0.47 | −3.6 |
| 3900 | 0.49 | 3340 | 0.42 | −15.5 |
| 3790 | 0.47 | 3440 | 0.43 | −9.7 |
| 1360 | 0.17 | 3080 | 0.39 | 77.5 |
| 1040 | 0.13 | 3190 | 0.40 | 102 |
Application of the method to clinical sample analysis is ongoing, and the data will be reported elsewhere. As an example, the concentration-time profile of unbound and total PQ from a pregnant woman is shown in Fig. 5. The unbound PQ ranged from 0.38 −0.51% of the total PQ concentration.
Fig. 5.
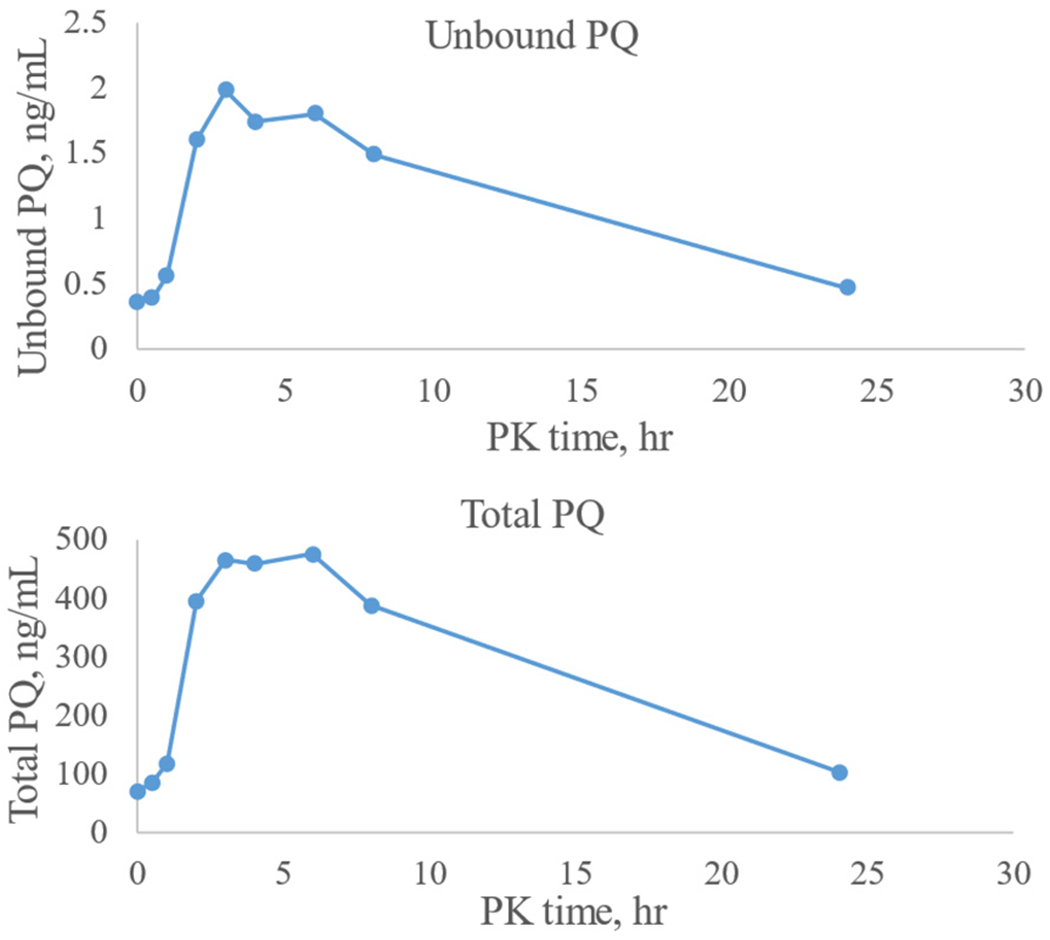
Concentration-time profile of PQ from a pregnant women under dihydroartemisinin-PQ chemoprevention therapy.
4. Discussion and conclusion
One daunting challenge for this method is matrix effect. Since PQ is >99% bound to plasma proteins, the unbound PQ concentrations in a majority of plasma samples are expected to be < 1 ng/mL. To be able to determine the low level of free PQ, we used a highly sensitive UHPLC-MS/MS system and ESI+ as the ion source, which is more sensitive in general, but also encounters more matrix effect than APCI+ [15]. Although deuterated internal standard (PQ-d6) was used in this study, we observed paradoxical matrix effects for PQ and the IS, causing the ESI+ method to fail. Previously, a group in Thailand also reported severe matrix effect for PQ with a LC-MS/MS method using the same deuterated IS and ESI+ as the ion source [18]. The authors attributed the cause to triethylamine used for solid-phase extraction. Ion suppression was observed for both PQ and the IS PQ-d6, with more impact on PQ in that case. In our case, we also found ion suppression for PQ (~50%), but ion enhancement (over 2-fold) was observed for the IS PQ-d6. Attempts to clean up samples with an HLB micro-elution solid-phase extraction plate did not improve the method. When a Prime HLB plate was used for extraction, interfering peaks were observed if samples were eluted with MeCN-water (1:1, v/v) containing 0.5% FA, whereas the recovery was low if they were eluted with MeCN-water (1:9, v/v) containing 0.5% FA. Unlike ESI, in which ionization occurs at the liquid phase, ionization in APCI mode occurs at the gas phase, which leads to less matrix effect. Therefore, we switched to APCI+ as the ion source, used the same LC conditions as those used in the total PQ method[9], but changed to a UPLC column. Interestingly, a shorter PFP column (30 × 2.1 mm, 1.7 μm; Waters Corp.) gave a longer retention time for PQ, with less back pressure than that with a Poroshell PFP column (50 × 2.1 mm, 1.9 μm; Agilent Tech.); thus, the shorter PFP column was used in the method.
Data for clinical samples analysis is out of scope in this report and thus will be reported elsewhere. It is worth mentioning that the initial mobile phase solvent B was modified after observing interference peaks in some clinical samples, and the method was revalidated with the new mobile phase solvent. Efforts were also made to expand the calibration range to 10 −5000 pg/mL (Supplemental Tables S1–S2). At the new LLOQ of 10 pg/mL, the signal-to-noise ratio was ~ 6 (Supplemental Fig. S3), but it decreased when the column conditions were changed over time. To be conservative, the LLOQ was set at 20 pg/mL, but 10 pg/mL was included during sample analysis.
A limitation of current method is that large variation of unbound PQ in spiked plasma samples observed in some cases. Since there is no plasma sample with a known unbound PQ concentration available, there is no way to determine recovery of unbound PQ from plasma samples undergoing ultrafiltration. Incurred sample reanalysis is a way to evaluate the ultrafiltration reproducibility, but the clinical samples left over from our previous study were very limited, therefore we spiked PQ into blank plasma samples and tested in two separate days to evaluate the ultrafiltration reproducibility. Two of the 15 samples deviated from the initial analysis by over 50% (Table 5). The reason for this unusual performance is unknown, but we realize it is important to add plasma samples to the filter cups immediately after 5% BAK pre-treatment. In addition, variation of unbound drug levels could be from variation of temperature during ultrafiltration. A study on unbound vancomycin found significantly lower unbound drug fraction when ultrafiltration was performed at 4 °C compared to 37 °C (50.6% versus 73.7%) [19]. Thus it is important to standardize the ultrafiltration procedure in order to get reproducible results.
In summary, the application of UHPLC-MS/MS resulted in a fast and highly sensitive method for determination of PQ concentration in protein free human plasma filtrate to support PK study of unbound PQ in human plasma samples. This is the first method to measure unbound PQ and the most sensitive among all methods for PQ quantitation reported to date.
Supplementary Material
Acknowledgements
We thank Lisa Wong for administrative support, Emma Hughes for carrying out the initial unbound PQ experiment, Erika Wallender for co-ordinating sample analysis and meeting discussion, and Amelia Deitchman for constructive discussion on the work, and staff and patients in Uganda participating in the clinical studies.
Funding
This work was supported by the National Institutes of Health (NIH), grant numbers R01AI117001 (PR, FA) and R21AI153848 (LH). Its contents are solely the responsibility of the authors and do not necessarily represent the official views of the NIH.
Footnotes
Declaration of Competing Interest
The authors declare that they have no known competing financial interests or personal relationships that could have appeared to influence the work reported in this paper.
Supplementary materials
Supplementary material associated with this article can be found, in the online version, at doi:10.1016/j.jcoa.2022.100042.
References
- [1].Davis TM, Hung TY, Sim IK, Karunajeewa HA, Ilett KF, Piperaquine: a resurgent antimalarial drug, Drugs 65 (2005) 75–87. [DOI] [PubMed] [Google Scholar]
- [2].EMA, Eurartesim Assessment Report, 2011. https://www.ema.europa.eu/documents/assessment-report/eurartesim-epar-public-assessment-report_en.pdf.
- [3].Hung TY, Davis TM, Ilett KF, Measurement of piperaquine in plasma by liquid chromatography with ultraviolet absorbance detection, J Chromatogr B 791 (2003) 93–101. [DOI] [PubMed] [Google Scholar]
- [4].Kajubi R , Huang L, Jagannathan P, Chamankhah N, Were M, Ruel T, Koss CA, Kakuru A, Mwebaza N, Kamya M, Havlir D, Dorsey G, Rosenthal PJ, Aweeka FT, Antiretroviral therapy with Efavirenz accentuates pregnancy-associated reduction of Dihydroartemisinin-Piperaquine exposure during malaria chemoprevention, Clin Pharmacol Ther 102 (2017) 520–528. [DOI] [PMC free article] [PubMed] [Google Scholar]
- [5].Whalen ME, Kajubi R, Chamankhah N, Huang L, Orukan F, Wallender E, Kamya MR, Dorsey G, Jagannathan P, Rosenthal PJ, Mwebaza N, Aweeka FT, Reduced Exposure to Piperaquine, compared to adults, in young children receiving Dihydroartemisinin-Piperaquine as malaria chemoprevention, Clin Pharmacol Ther 106 (2019) 1310–1318. [DOI] [PMC free article] [PubMed] [Google Scholar]
- [6].Vuignier K, Schappler J, Veuthey JL, Carrupt PA, Martel S, Drug-protein binding: a critical review of analytical tools, Anal Bioanal Chem 398 (2010) 53–66. [DOI] [PubMed] [Google Scholar]
- [7].Xu SS, Chen YN, Zhao MM, Zhao LM, Development of a simple and rapid method to measure free fraction of valproic acid in plasma using ultrafiltration and ultra high performance liquid chromatography-mass spectroscopy: application to therapeutic drug monitoring, Ther Drug Monit 39 (2017) 575–579. [DOI] [PubMed] [Google Scholar]
- [8].Tarning J, Lindegardh N, Quantification of the antimalarial piperaquine in plasma, Trans R Soc Trop Med Hyg 102 (2008) 409–411. [DOI] [PubMed] [Google Scholar]
- [9].Kjellin LL, Dorsey G, Rosenthal PJ, Aweeka F, Huang L, Determination of the antimalarial drug piperaquine in small volume pediatric plasma samples by LC-MS/MS, Bioanalysis 6 (2014) 3081–3089. [DOI] [PMC free article] [PubMed] [Google Scholar]
- [10].Aziz MY, Hoffmann KJ, Ashton M, LC-MS/MS quantitation of antimalarial drug piperaquine and metabolites in human plasma, J Chromatogr B 1063 (2017) 253–258. [DOI] [PubMed] [Google Scholar]
- [11].Hodel EM, Zanolari B, Mercier T, Biollaz J, Keiser J, Olliaro P, Genton B, Decosterd LA, A single LC-tandem mass spectrometry method for the simultaneous determination of 14 antimalarial drugs and their metabolites in human plasma, J Chromatogr B 877 (2009) 867–886. [DOI] [PubMed] [Google Scholar]
- [12].Liu H, Zang M, Yang A, Ji J, Xing J, Simultaneous determination of piperaquine and its N-oxidated metabolite in rat plasma using LC-MS/MS, Biomed Chromatogr 31 (2017) e3974. [DOI] [PubMed] [Google Scholar]
- [13].Mwebaza N, Cheah V, Forsman C, Kajubi R, Marzan F, Wallender E, Dorsey G, Rosenthal PJ, Aweeka F, Huang L, Determination of piperaquine concentration in human plasma and the correlation of capillary versus venous plasma concentrations, PLoS One 15 (2020) e0233893. [DOI] [PMC free article] [PubMed] [Google Scholar]
- [14].Huang L, Lizak P, Dvorak CC, Aweeka F, Long-Boyle J, Simultaneous determination of fludarabine and clofarabine in human plasma by LC-MS/MS, J Chromatogr B 960 (2014) 194–199. [DOI] [PMC free article] [PubMed] [Google Scholar]
- [15].Liu HC, Lin DL, McCurdy HH, Matrix effects in the liquid chromatography-tandem mass spectrometry method of analysis, Forensic Sci Rev 25 (2013) 65–78. [PubMed] [Google Scholar]
- [16].Illamola SM, Hirt D, Treluyer JM, Urien S, Benaboud S, Challenges regarding analysis of unbound fraction of highly bound protein antiretroviral drugs in several biological matrices: lack of harmonisation and guidelines, Drug Discov Today 20 (2015) 466–474. [DOI] [PubMed] [Google Scholar]
- [17].Kratzer A, Liebchen U, Schleibinger M, Kees MG, Kees F, Determination of free vancomycin, ceftriaxone, cefazolin and ertapenem in plasma by ultrafiltration: impact of experimental conditions, J Chromatogr B 961 (2014) 97–102. [DOI] [PubMed] [Google Scholar]
- [18].Lindegardh N, Annerberg A , White NJ, Day NP, Development and validation of a liquid chromatographic-tandem mass spectrometric method for determination of piperaquine in plasma stable isotope labeled internal standard does not always compensate for matrix effects, J Chromatogr B 862 (2008) 227–236. [DOI] [PubMed] [Google Scholar]
- [19].Stove V, Coene L, Carlier M, De Waele JJ , Fiers T, Verstraete AG, Measuring unbound versus total vancomycin concentrations in serum and plasma: methodological issues and relevance, Ther Drug Monit 37 (2015) 180–187. [DOI] [PubMed] [Google Scholar]
Associated Data
This section collects any data citations, data availability statements, or supplementary materials included in this article.