

Abstract
Background/aims
To identify clinical characteristics and factors associated with microcystic macular edema (MME) in patients with primary open-angle glaucoma (POAG).
Methods
We included 315 POAG eyes between 2010 and 2019 with good-quality macular volume scans that had reliable visual fields (VF) available within 6 months in this observational retrospective cohort study. Eyes with retinal pathologies except for epiretinal membrane (ERM) were excluded. The inner nuclear layer was qualitatively assessed for the presence of MME. Global mean deviation (MD) and Visual Field Index (VFI) decay rates, superior and inferior MD rates and pointwise total deviation rates of change were estimated with linear regression. Logistic regression was performed to identify baseline factors associated with the presence of MME and to determine whether MME is associated with progressive VF loss.
Results
25 out of 315 eyes (7.9%) demonstrated MME. The average (±SD) age and MD in eyes with and without MME was 57.2 (±8.7) versus 62.0 (±9.9) years (p=0.02) and −9.8 (±5.7) versus −4.9 (±5.3) dB (p<0.001), respectively. Worse global MD at baseline (p=0.001) and younger age (p=0.02) were associated with presence of MME. ERM was not associated with the presence of MME (p=0.84) in this cohort. MME was not associated with MD and VFI decay rates (p>0.49).
Conclusions
More severe glaucoma and younger age were associated with MME. MME was not associated with faster global VF decay in this cohort. MME may confound monitoring of glaucoma with full macular thickness.
INTRODUCTION
Chronic glaucoma is characterised by slow progressive damage of retinal ganglion cell (RGC) axons at the level of the lamina cribrosa with subsequent loss of ganglion cells within the retina.1 2 Recent studies have shown that optic neuropathies with diverse causes can lead to development of microcystic macular edema (MME) in the inner nuclear layer (INL).3–5
Microcystic macular edema refers to thickening and development of cysts in the INL of the retina, most commonly in the parafoveal area.6 MME has been detected mostly in patients with open-angle glaucoma.7 8 It is also encountered in a variety of other optic nerve diseases including the optic neuritis associated with multiple sclerosis (MS), Leber’s hereditary optic neuropathy, and neuromyelitis optica.3 9 The pathophysiology of MME is not well understood; however, some proposed mechanisms include vitreous traction or a mechanical force from the internal limiting membrane (ILM) in the setting of inner retinal atrophy, trans-synaptic (retrograde) degeneration of bipolar cells secondary to RGC loss, and Müller cell dysfunction.3 10–13 Epiretinal membranes (ERM) have been previously proposed as a causative factor for MME.14
Given the scarce data reported on different aspects of MME,3–5 especially in a long follow-up, this study explores the risk factors and clinical significance of MME in a longitudinal retrospective cohort of POAG eyes and investigates the influence of ERM on the prevalence of MME in patients with POAG.
MATERIALS AND METHODS
A retrospective chart review was conducted of patients seen at the Glaucoma Division, Stein Eye Institute between January 2010 and January 2019.
Eligible patients with POAG were required to have open angles on gonioscopy, characteristic glaucomatous optic nerve damage (localised or diffuse neuroretinal rim thinning or retinal nerve fibre layer defects), and reproducible glaucomatous visual field (VF) defects which correlated with the structural abnormalities (see below).15 Eligible eyes were required to have macular Spectralis OCT (Optical Coherence Tomography; Heidelberg Engineering GmbH, Heidelberg, Germany) images and VFs within 6 months of each other.
The Posterior Pole Algorithm of the Spectralis OCT acquires 61 horizontal B-scans approximately 120 μm apart and spanning a 30°×25° wide area. Good-quality macular SD-OCT images were defined as those with a quality factor >15 and without major artefacts on all B-scans along with the absence of confounding macular pathology.16
MME was defined as the presence of multiple, small hyporeflective round to elliptical cystoid spaces, without cyst walls, located in the INL and not confluent with cystoid spaces in other retinal layers. Figure 1 shows three representative cases of MME.4 Macular OCT volume scans were screened for evidence of MME by two of the authors (GM and DS). Spectralis OCT full-thickness pseudo-colour maps were used to confirm the increased thickness of area determined as MME (figure 1). We considered microcystic alterations to be present in the INL if they were seen on at least two adjacent scans.17
Figure 1.
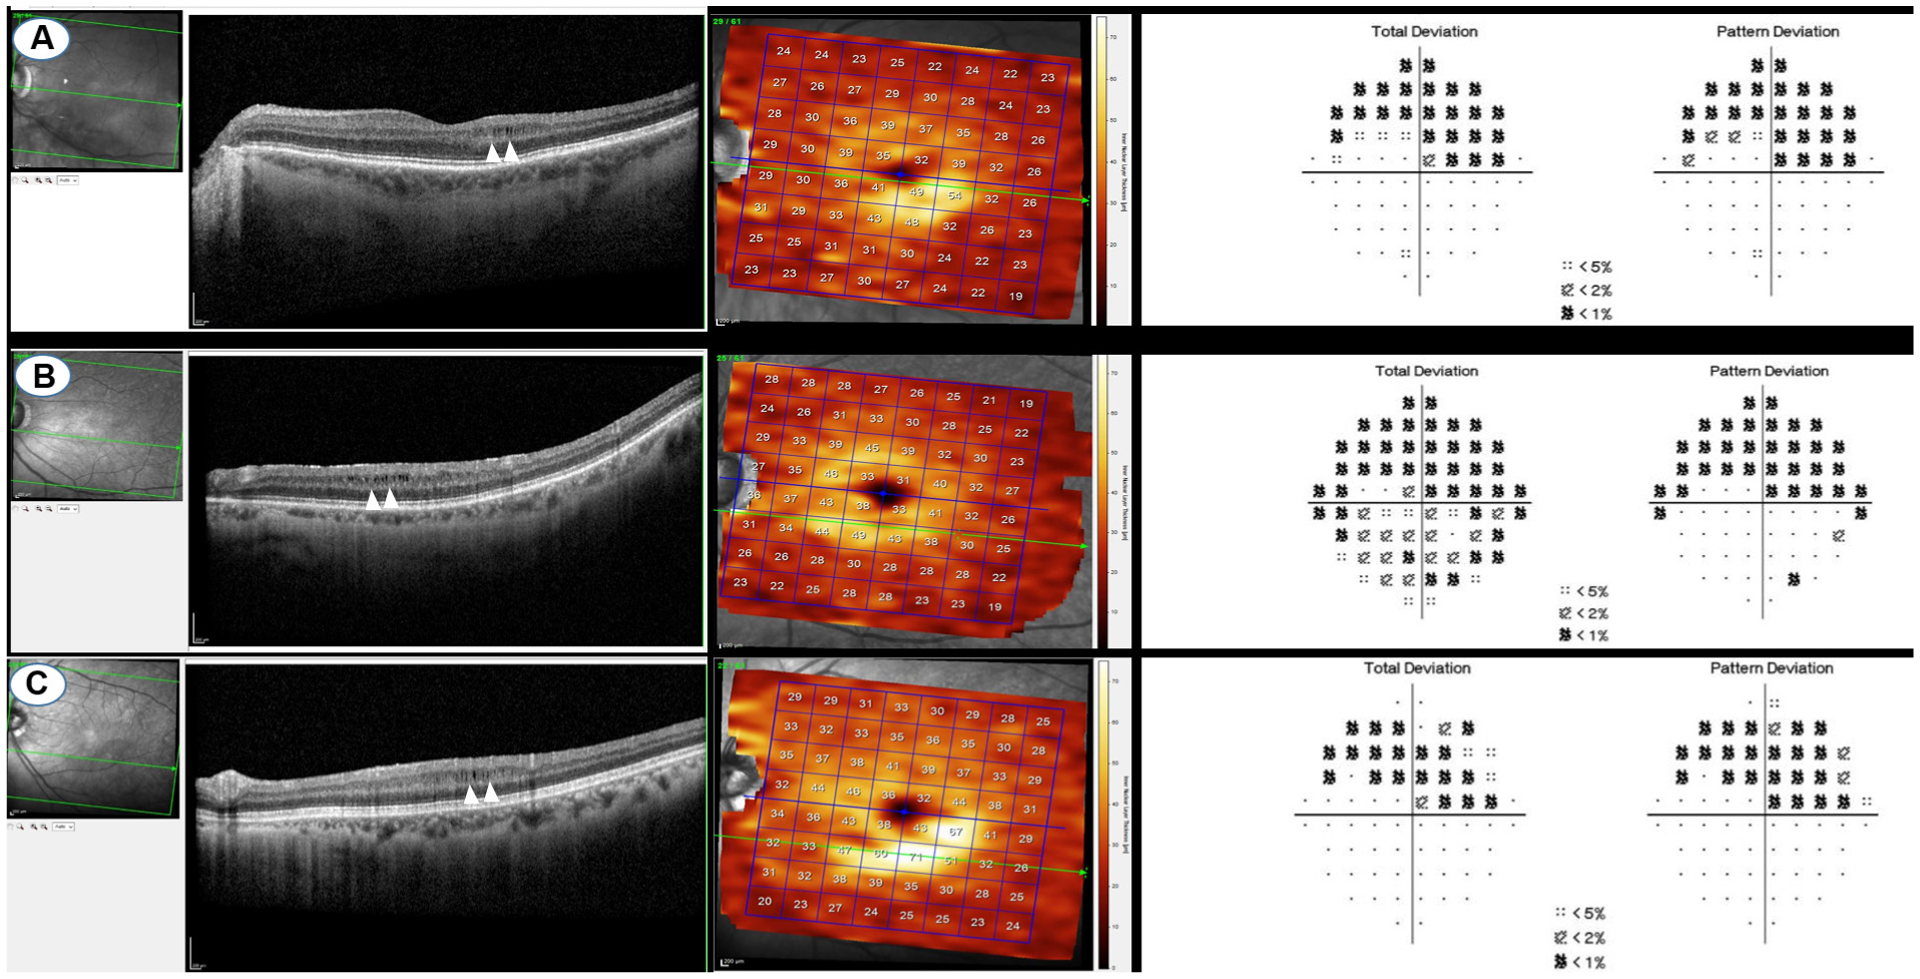
Three represented cases of microcystic macular edema and their corresponding visual fields and en face OCTs.
Any irregular and hyper-reflective lines above the ILM were defined as an ERM, which is often accompanied by wrinkling of the underlying retina with hyporeflective spaces between the ERM and the ILM.14 The OCT images were further reviewed by a retina specialist to confirm the true presence of cysts and ERM in suspicious scans (JPH). Only the macular area within the 6 mm circle of the EDTRS grid was used to define MME and ERM (figure 2).4
Figure 2.
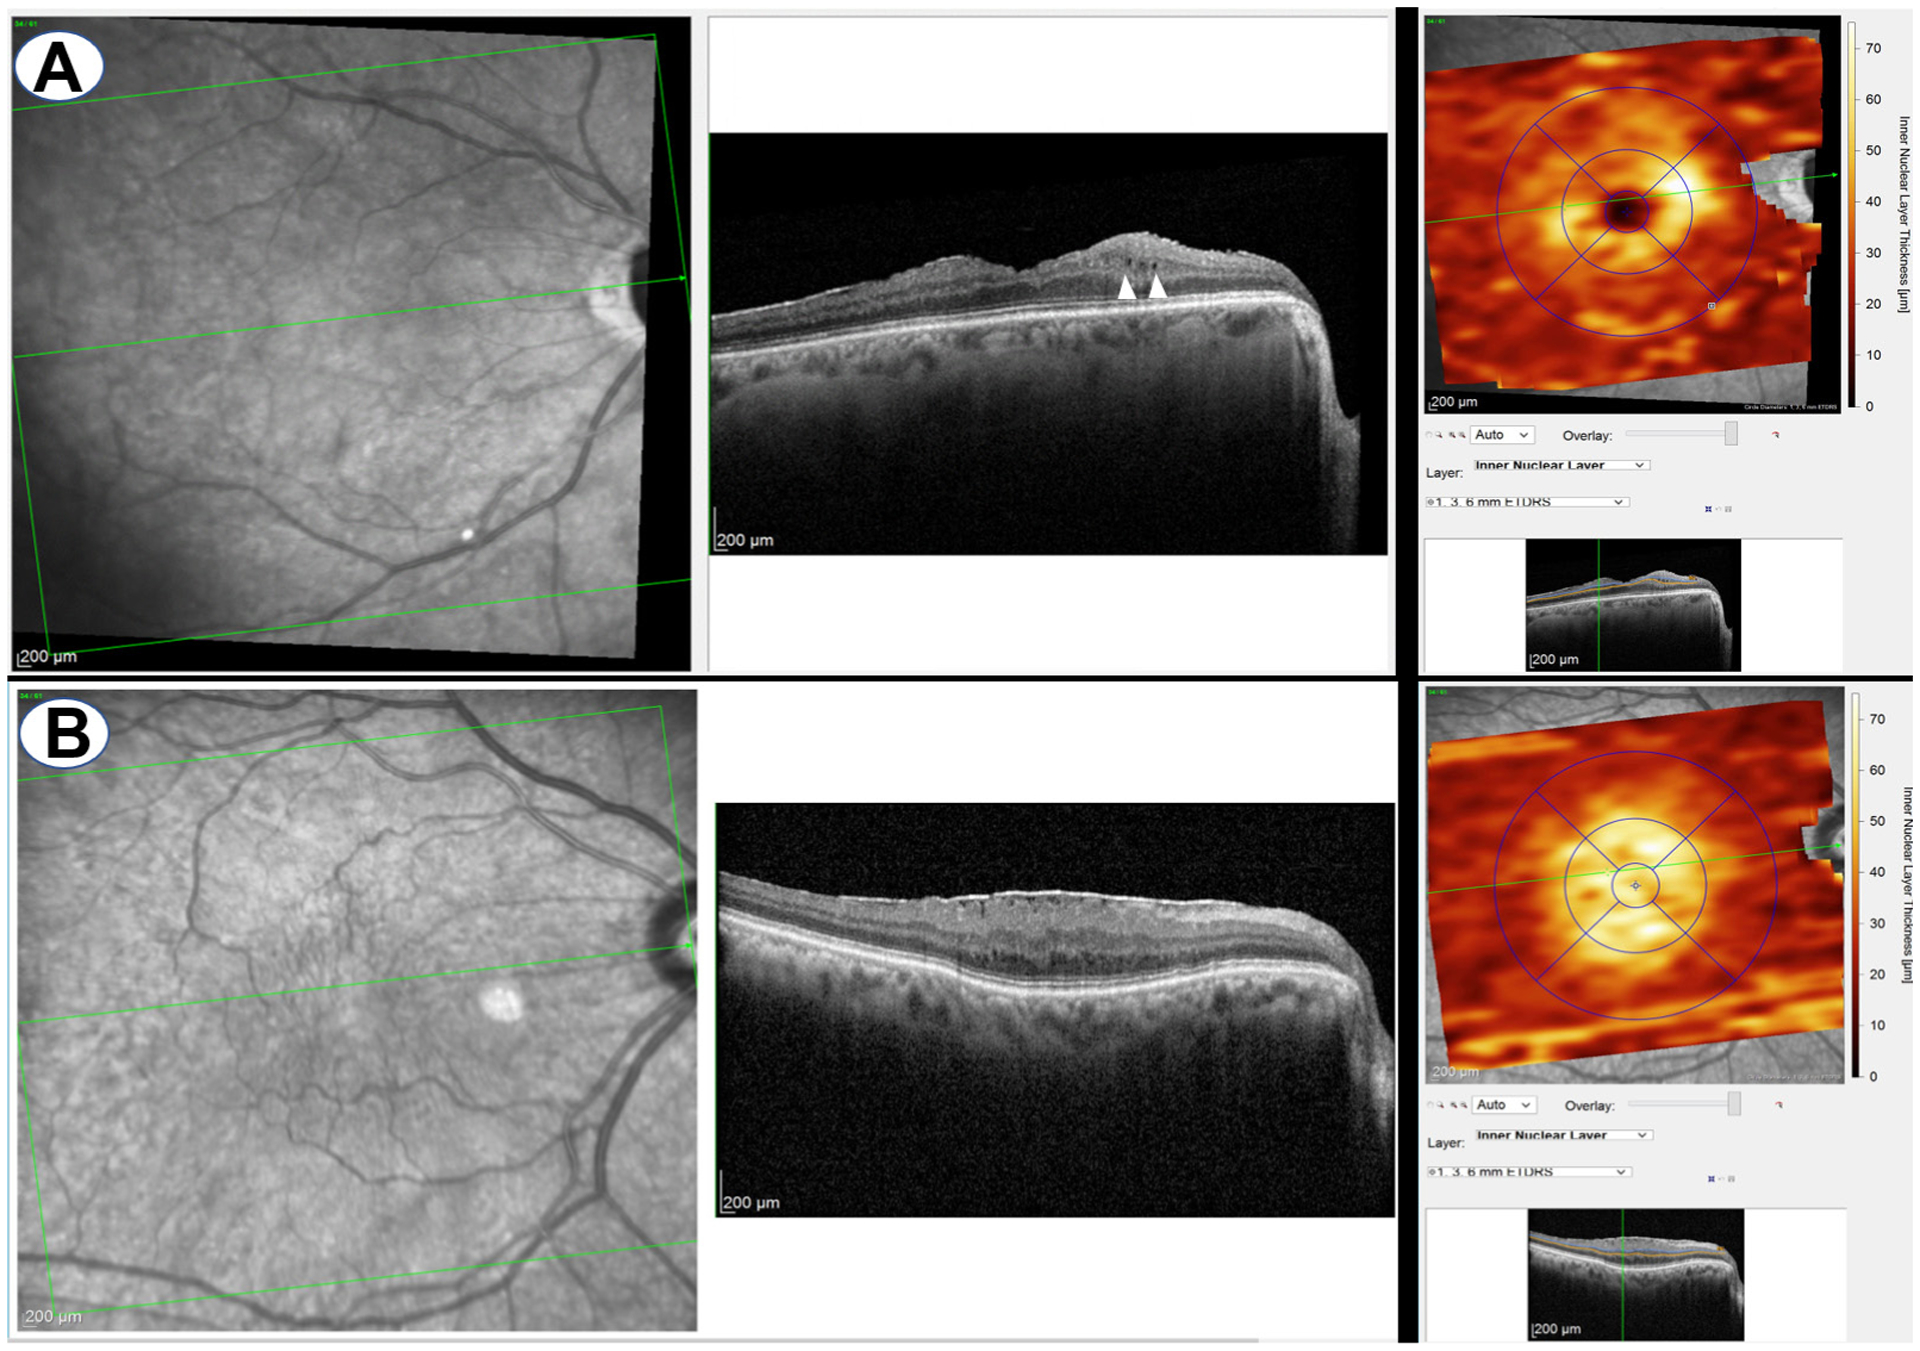
A representative case of epiretinal membrane (ERM) with microcystic macular edema (MME) (A) and without MME (B). On the right side, ERM was inside the corresponding EDTRS grid.
Standard achromatic perimetry was performed with the 24–2 Swedish Interactive Thresholding Algorithm Standard strategy (Humphrey Visual Field Analyzer; Carl Zeiss Meditec Including., Dublin, California, USA). An abnormal VF was defined as (1) pattern SD (PSD) with p<0.05, or (2) Glaucoma Hemifield Test result outside normal limits, or (3) three or more abnormal points with a probability of p<0.05, of which at least one point had p<0.01 in the pattern deviation map.18 VFs with a false-positive rates>15% were considered unreliable.19
Eyes with any evidence of vitreoretinal diseases such as diabetic retinopathy, age-related retinal macular degeneration, optic nerve abnormalities other than glaucoma or a history of posterior segment surgery were excluded. We did not exclude eyes with ERM. Eyes with cystoid macular edema after intraocular surgery were also excluded. Online supplemental figure 1 presents the flow chart showing included eyes according to the aforementioned eligible criteria.
Baseline demographic information, including race, age, sex, and so on, were collected and showed in table 1.
Table 1.
Demographic and clinical characteristics of the study sample
| Variables | MME | No MME |
|---|---|---|
| Eyes (n) | 25 (7.9%) | 290 (92.1%) |
| Male/female (n) | 7 (28%)/18 (72%) | 139 (48%)/151 (52%) |
| Mean age (±SD), years | 57.23±8.72 | 61.99±9.93 |
| Race | ||
| White | 8 (32%) | 142 (48.9%) |
| African American | 6 (24%) | 29 (10%) |
| Asian | 4 (16%) | 48 (18.5%) |
| Hispanic | 2 (8%) | 25 (8.6%) |
| Unknown | 5 (20%) | 46 (15.86%) |
| Axial Length, mm | 24.4±3.0 | 24.4±2 |
| CDVA, LogMAR | 0.08±0.1 | 0.1±0.2 |
| CCT, μm | 552±52.2 | 547±46 |
| Spherical equivalent, diopters | −2.1±3 | −2.1±2.8 |
| Visits (n), (IQR) | 13.4±6.2 (8,17) | 12.4±5.3 (9, 15.75) |
| IOP, mm Hg | 15.2±6 | 15.4±5.6 |
| Total laser (n) | 0.4±0.6 | 0.4±06 |
| Total trabeculectomy (n) | 0.8±0.9 | 0.5±0.7 |
| Baseline glaucoma medications(n) | 1.5±0.9 | 1.3±1 |
| Follow-up, years(IQL) | 11.1±4.9 (7.2,14.4) | 10.2±4.5 (6.4,13.8) |
| MD (global), dB | −9.8±5.7 | −4.9±5.3 |
| MD (superior hemifield), dB | −14.3±8.8 | −5.4±6.8 |
| MD (Inferior hemifield), dB | −5.9±6.1 | −4.3±5.7 |
| VFI, %/year | 73.6±16.2 | 88.2±14.7 |
| MD rate, dB/year | −0.2±0.4 | −0.3±0.6 |
| MD rate (suphemifield), dB/year | −0.3±. 0.5 | −0.3±0.8 |
| MD rate (inferior hemifield), dB/year | −0.1±0.6 | −0.3±0.7 |
| VFI rate, %/year | −1.±1.4 | −0.7±2 |
| Stage of glaucoma | 7 (28%) | 211 (10.55%) |
| Mild | 10 (40%) | 45 (15.51%) |
| Moderate advanced | 8 (32%) | 34 (11.72%) |
| ERM | 5 (20%) | 40 (13.79%) |
Continuous variables expressed as mean (SD), categorical variables expressed as frequency (%).
CCT, central corneal thickness; CDVA, corrected distance visual acuity; ERM, epiretinal membrane; IOP, intraocular pressure; LogMAR, Logarithm of the Minimal Angle of Resolution; MD, mean deviation; n, number; VFI, Visual Field Index.
The rates of change for mean deviation (MD) (dB/year) and VFI (%/year) was estimated through univariate regression of MD and VFI against time regardless of the number of visits and then for eyes with at least five visits.8 20 MDs for the superior and inferior hemifields were calculated based on weighted TDs as follows. MD is a weighted average of the pointwise deviations from the reference normative VF database. The weighting coefficient is based on the interpatient variance (IPV) in the normative database and creates ‘weighted’ deviations across the VF, which are then compared against a set of cut-off points to produce a probability (or significance) value.
n = number of test points (excluding blind spot and conditional points)
N = normal reference threshold at point i (age-corrected normal)
X = measured threshold at point
IPV = interpatient variance (IPV) in the normative database at point i
(NOTE: X–N = Total Deviation)
Rates were estimated for superior and inferior hemifield MDs (dB/year). Pointwise rates of change were estimated for 52 VF locations (excluding two blind spot test locations) once for all visits regardless of the number of visits and for second time for eyes with a minimum of five visits.1
Statistical analysis
All statistical analyses were performed with STATA software V.15.0 (StataCorp LLC). Mean and SD values were estimated for continuous variables, and frequency and percentage were calculated for categorical variables. We used univariate regression to evaluate the influence of different variables on the presence of MME such as age, gender, stage of glaucoma (mild stage: MD >−6 dB, moderate stage: MD between −6 and −12 dB, and severe stage: MD <−12 dB,21 etc). All variables are shown in table 2.
Table 2.
Results of multivariate and univariate logistic regression for presence of microcystic macular edema
| Univariate analysis | Multivariate analysis | |||
|---|---|---|---|---|
| Variable | Odds ratio (95% CI) | P value | OR | P value |
| Mean age (±SD), years | 0.95 (0.951 to 0.996) | 0.03 | 0.95 (0.902 to 0.992) | 0.02 |
| Gender (reference: male) | 2.41 (0.94 to 6.15) | 0.067 | ||
| Race | ||||
| White | Reference | Reference | ||
| African American | 3.8 (1.09 to 13.28) | 0.04 | 2.42 | 0.16 (0.7 to 8.3) |
| Hispanic | 1.44 (0.28 to 7.62) | 0.66 | 1.12 | 0.89 (0.21 to 0.59) |
| Asian | 1.49 (0.42 to 5.36) | 0.62 | 1.47 | 0.56 (0.4 to 5.4) |
| Unknown | 1.95 (0.58 to 6.55) | 0.27 | 1.59 | 0.47 (0.5 to 5.6) |
| CCT, μm | 1 (1 to 1.01) | 0.6 | ||
| Axial length, mm | 1 (1 to 0.1) | 0.97 | ||
| Visual acuity, LogMAR | 2.7 (0 .1 to 78.9) | 0.56 | ||
| Spherical equivalent, diopters | 1 (0.8 to 1.2) | 0.96 | ||
| IOP, mm Hg | 0.99 (0.9 to 1.07) | 0.82 | ||
| Total trabeculectomy (n) | 1.8 (1.03 to 3.04) | 0.04 | 1.5 (0.85 to 2.62) | 0.16 |
| Baseline glaucoma medications(n) | 1.2 (0.8 to 1.8) | 0.46 | ||
| Total laser (n) | 0.9 (0.4 to 1.8) | 0.71 | ||
| Visual field MD (global), dB | 0.87 (0.81 to 0.95) | 0.001 | 0 .89 (0.83 to 0.95) | 0.001 |
| Visual field MD (superior hemifield), dB | 0.9 (0.85 to 0.93) | 0.001 | ||
| Visual field MD (inferior hemifield), dB | 0.95 (0.9 to 1.02) | 0.19 | ||
| VFI (%) | 0.96 (0.93 to 0.98) | <0.001 | ||
| PSD | 1.25 (1.13 to 1.38) | <0.001 | ||
| Stage of glaucoma | Reference | |||
| Mild | 6.69 (2.42 to 18.54) | <0.001 | ||
| Moderate advanced | 7.09 (2.41 to 20.82) | <0.001 | ||
| MD rate, dB/year | 1.24 (0 .5 to 3.007) | 0.49 | ||
| MD rate (suphemifield), dB/year | 1.01 (0.59 to 1.77) | 0.06 | ||
| MD rate (inferior hemifield), dB/year | 1.42 (0.58 to 3.47) | 0.44 | ||
| VFI rate, %/year | 0.94 (0.77 to 1.13) | 0.53 | ||
| PSD rate | 0.87 (0.35 to 2.2) | 0.78 | ||
| ERM | 1.6 (0.53 to 4.8) | 0.84 | ||
Among factors associated with severity of visual field, we only put MD in multivariable analysis due to collinearity.
CCT, central corneal thickness; CDVA, corrected distance visual acuity; ERM, epiretinal membrane; IOP, intraocular pressure; LogMAR, Logarithm of the Minimal Angle of Resolution; MD, mean deviation; VFI, Visual Field Index.
Mixed multivariate logistic regression for variables with p value less than 0.2 was carried out to determine the most important predictors of presence of MME. Variables with significant collinearity were excluded. These variables were those parameters for which the variance inflation factor of the analysis of collinearity was higher than 4.22 Therefore, among factors associated with severity of VF (MD, PSD, VFI, etc), we only put MD in multivariable analysis due to collinearity. ORs are reported with 95% CIs. Statistical significance was defined as a p value <0.05.
RESULTS
A total of 315 eyes of 190 patients with glaucoma were included in the analyses. MME was identified in 25 eyes (8%) of 24 patients (12.6%). One patient had MME in both eyes. Two hundred eighteen, 55 and 42 eyes were categorised as having mild, moderate and severe stages of glaucoma, respectively. A comparison of clinical and demographic characteristics between patients with glaucoma with and without MME is shown in table 1. The mean (±SD) age of eyes with and without MME was 57.2 (±8.7) and 62.0 (±9.9) years (p=0.02), respectively. MME was found in the inferior hemiretina in 21 eyes (84%) and in the superior hemiretina in 4 eyes (16%). The average follow-up for eyes with and without MME was 11.1 (±4.9) and 10.2 (±4.5) years, p=0.38, respectively. The average baseline VF threshold sensitivities for eyes with and without MME are shown in online supplemental figure 2.
The following variables were significantly associated with presence of MME on mixed univariate logistic regression analysis: age (OR: 0.95, 95% CI 0.950 to 0.996, p=0.03), African American ethnicity (OR: 3.8, 95% CI 1.09 to 13.28, p=0.04), MD (OR: 0.87, 95% CI 0.81 to 0.95, p=0.001), PSD (OR: 1.25, 95% CI 1.13 to 1.38, p<0.001), superior hemifield MD (OR: 0.9, 95% CI 0.85 to 0.93, p<0.001), and VFI (OR: 0.96, 95% CI 0.93 to 0.98, p<0.001), total number of trabeculectomies (OR: 1.8, 95% CI 1.03 to 3.04, p=0.04), moderate stage of glaucoma (OR: 6.69 compared with mild stage, 95% CI 2.42 to 18.54, p<0.001), and severe stage of glaucoma (OR: 7.09 compared with mild stage, 95% CI 2.41 to 20.82, p<0.001). On mixed multivariate logistic regression, younger age (OR: 0.9, 95% CI 0.902 to 0.992, p=0.02) and worse baseline MD (OR: 0.89, 95% CI 0.83 to 0.95, p=0.01) were associated with presence of MME in glaucomatous eyes (table 2).
ERMs were found in 5 and 40 eyes with and without MME, respectively. We also assessed ERM as an independent factor for the presence of MME, which was not found to be significant (OR: 1.6, 95% CI 0.53 to 4.8, p=0.84).
MD rates of change (OR: 1.24, 95% CI 0.50 to 3.01, p=0.49), VFI rates of change (OR: 0.94, 95% CI 0.77 to 1.13, p=0.53), superior MD rates (OR: 1.01, 95% CI 0.59 to 1.77, p=0.06), inferior MD rates (OR: 1.42, 95% CI 0.58 to 3.47, p=0.44), or PSD rates (OR: 0.87, 95% CI 0.35 to 2.20, p=0.78) were not associated with the presence of MME. However, when pointwise rates of change were compared between eyes with and without MME, one location (figure 3) in the superior central zone demonstrated a significantly faster rate of progression (−0.75±1.63 dB/year) in eyes with MME compared with eyes without MME (−0.25±0.82 dB/year) (OR: 1.64, 95% CI 0.40 to 0.94, p=0.02).
Figure 3.
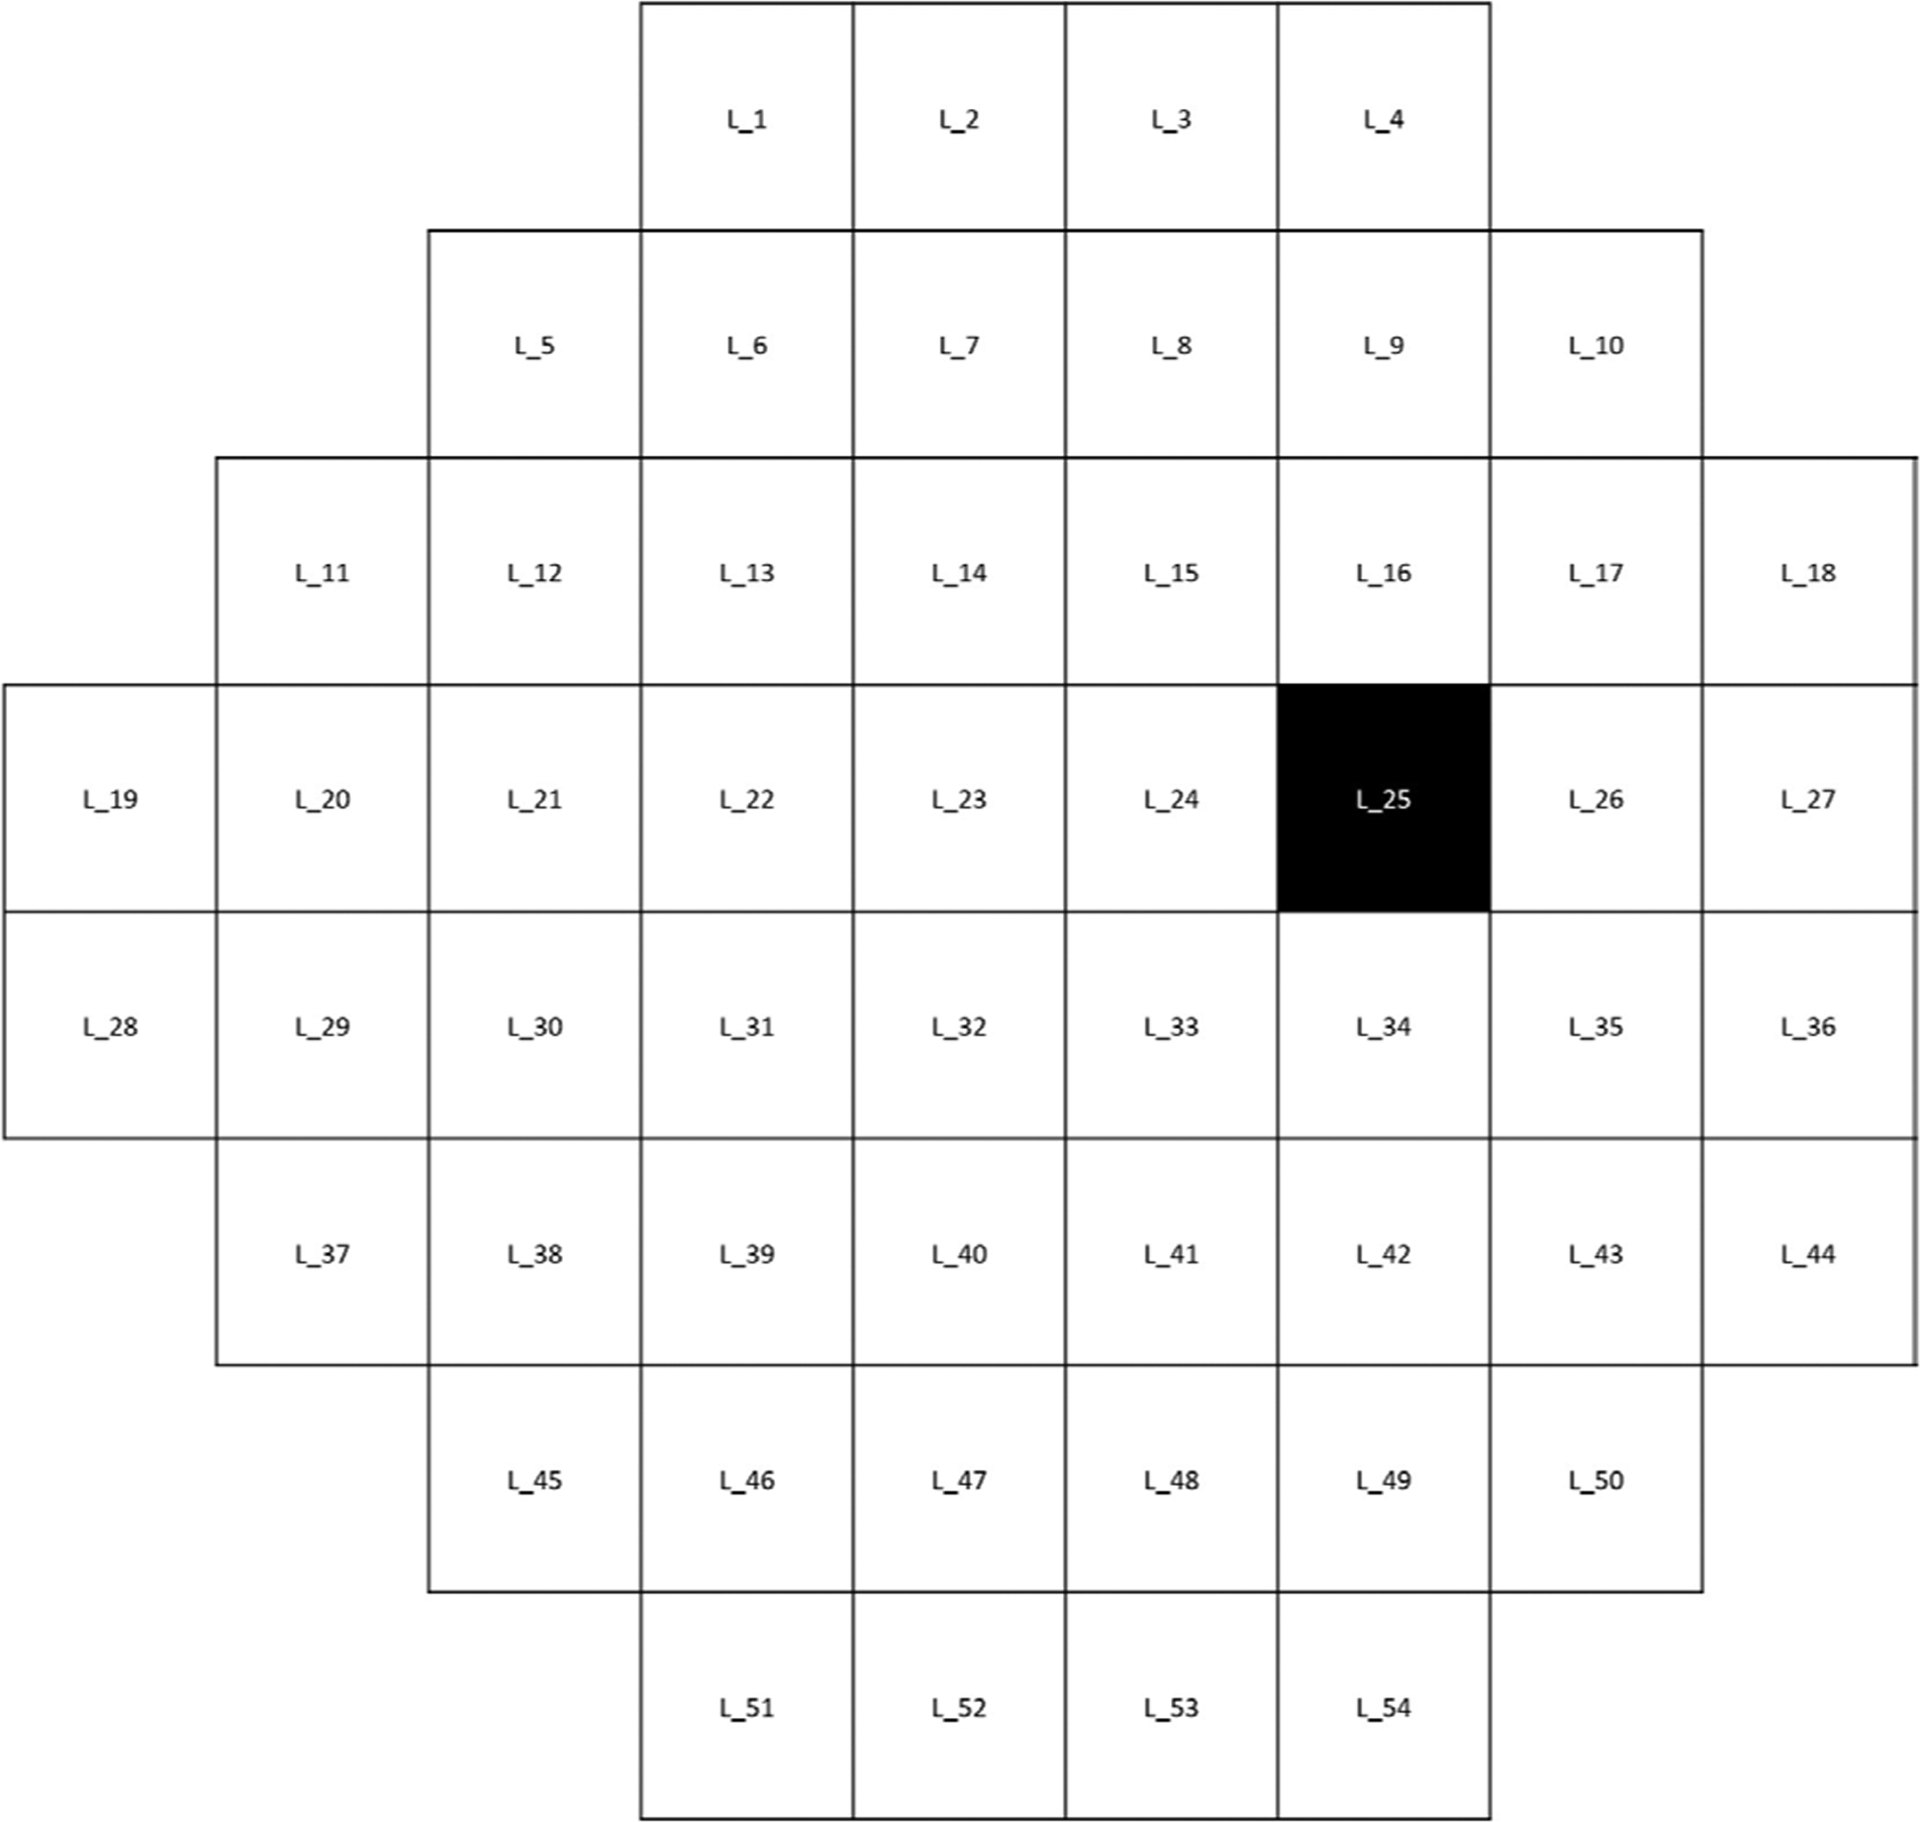
The black location shows a location in superior central zone which has a significantly faster rate of progression (−0.75±1.63 dB/year vs −0.25±0.82 dB/year) in eyes with microcystic macular edema compared with eyes without MME (OR:1.64, CI 0.40 to 0.94, p=0.02). L, Location.
In analysis of eyes with at least five VF examinations (included 24 eyes with MME and 272 eyes without MME), MD rates (OR: 1.16, 95% CI 0.41 to 3.33, p=0.78), VF rates (OR: 0.91, 95% CI 0.64 to 1.29, p=0.59), superior MD rates (OR: 1.21, 95% CI 0.52 to 2.84, p=0.66), inferior MD rates (OR: 1.07, 95% CI 0.38 to 3.01, p=0.89), and PSD rate for eyes (OR: 0.52, 95% CI 0.13 to 2.18, p=0.37) were not associated with presence of MME. Also, presence of MME was not associated with higher rates of change at any test location (p>0.08 for all).
DISCUSSION
This study explored the clinical significance and baseline risk factors of MME in patients with POAG and if the presence of MME is a risk factor for faster functional progression. Among these risk factors, worse baseline MD and younger age were the main risk factors for the presence of MME in POAG eyes. Rates of VF progression were not different between eyes with baseline MME and those without.
Previous studies reported the prevalence of MME to vary from 4.7% in patients with MS to 30% in severe optic neuropathies such as neuromyelitis optica.17 23 We found that about 8% of eyes with POAG had MME in overall follow-up. Line et al estimated the cumulative prevalence of MME to be around 3.6% in glaucoma eyes based on five previously published studies, which is lower than the prevalence of MME in our study.24 This may be explained by more patient with advanced disease in our study as compared with previous ones.7 25 Cysts can also be missed using OCTs with a lower number of B scans, resolution and different generation.8
In optic neuropathies other than glaucoma, a single quadrant most frequently (67.7%) demonstrated signs of MME. The nasal (48.1%) and temporal (49.6%) quadrants were more frequently involved compared with the superior (29.3%) and inferior (30.1%) quadrants.4 In contrast, we found MME mostly in the inferior hemiretina (84%). This is in contract with patients with MS who have MME in both hemiretinas,17 which can be due to different pathophysiology of these two diseases. Glaucomatous VF loss is more frequently observed in the superior hemifields in patients with POAG, which is in line with the location of MME in our study.26
A previous study reported an association between younger age and presence of microcystic changes in eyes with non-glaucomatous optic neuropathy,3 whereas another study found MME in older patients in eyes with optic neuropathy other than glaucoma.4 We found an association between younger age and presence of MME in patients with POAG (p=0.02). Hasegawa et al reported no association between age and MME in a Japanese patient population with POAG.8 Wen et al only described a case series of 11 POAG eyes with MME mostly in a younger age group (range: 33–51 years).5 Old age were previously explained as a risk factor for glaucoma.27 28 Association of young age with presence of MME might be explained by the thicker neural and glial tissues in younger patients which may make it easier to identify the cystic spaces.29 30
We found an association between African American ethnicity and the presence of MME in univariate analyses (p=0.04). The 11 cases of POAG eyes with MME described by Wen et al were all African American.5 This finding is consistent with the fact that severe glaucoma is more prevalent among African American patients31
Eyes with MME were associated with worse baseline superior MD (p=0.001), worse baseline MD (p=0.001), worse baseline VFI (p<0.001) and worse baseline PSD (p<0.001) on univariate analyses. An association was also seen between the presence of advanced stage (moderate and severe) glaucoma and MME (p<0.001) on univariate analyses. This is consistent with prior studies that reported a higher frequency of MME in advanced stages of glaucoma.8 14 25
In this study, we found no association with VF rate indices such as MD rate (p=0.49), superior hemifield MD rate (p=0.06),inferior hemifield MD rate (p=0.44), VFI rate (p=0.53), or PSD rate (p=0.78) with the presence of MME in patients with POAG. However, faster MD rate among eyes with MME was reported in a Japanese population.8 Hasegawa et al found higher MD rates in eyes with MME (−0.43±49) than without MME (−0.15±0.44, p=0.027).8 However, we found a location in the central zone with more negative TD rate (−0.75±1.63 vs −0.25±0.82) which was associated with presence of MME (OR: 1.64, p=0.02). The potential for a faster rate of central progression should be investigated in studies with greater sample size of MMEs. It is also possible that the rates in different VF locations were affected by the floor effect in our study because most of our eyes in MME group had moderate to advanced glaucoma. Therefore, for those with more negative TD values, a ‘floor effect’ may affect pointwise linear regression. When the VF threshold sensitivities reach very low values; the slopes tend to be flat even though progression may occur (online supplemental figure 2). The difference between the results of our study and the study by Hasegawa et al might be explained by exclusion of preperimetric glaucomatous eyes, a population of different ethnicity (Asian), and the use of a lower scan resolution.8
Previous studies showed decreased visual acuity in the presence of MME in patients with MS.17 Murata et al showed an association between BCVA and presence of MME (p=0.018).7 We did not find any association with visual acuity and the presence of MME in POAG eyes (p=0.56). Hasegawa et al reported a similar finding to our study.8 32 Murata et al found 80% (8 out of 10) and 20% (2 out of 10) of MMEs in advanced and moderate stages of glaucoma, respectively. In our study, we found 32%, 42% and 28% MMEs in advanced, moderate and mild stages of glaucoma. Therefore, finding MMEs mostly in advanced stages of glaucoma might lead to finding worse VA among eyes with MME in the study by Murata et al. On the other hand, it is possible that our small sample size of MMEs resulted in insignificant results for VA which should be addressed in the studies with larger sample size.
A prior study reported that microcystic macular changes were commonly found in patients with concomitant ERM and glaucomatous optic neuropathy.14 This study found an association between presence of microcystic changes and ERMs. They also found an individual association between glaucoma and presence of MME.14 However, they did not compare glaucoma eyes with and without MME to see if there is role for ERM. Our study did not support the notion of ERM-related traction causing MME in glaucomatous eyes, since we found no association between ERM and presence of MME (p=0.84). Although these insignificant results among ERMs between eyes with and without MMEs could be due to the small sample size of MMEs or ERMs, a study by Govetto et al supports our results.14 They showed that MME disappeared after surgery in patients with ERM.14 However, MME remained stable in patients with glaucoma after ERM surgery. Muriel et al indicated that peeling of ERM and ILMs is associated with atrophy of ganglion cells and thickening of the INL. They assumed that thickening of INL is associated with the presence of MME and surgical treatment of ERMs induces a variant of a retrograde maculopathy.33 Therefore, beside ERM as a reason for the presence of MME,14 other mechanisms probably are at play and cause MME in patients with glaucoma.14 Several mechanisms have been put forward to explain why microcystic changes occur in various types of optic neuropathy, including MS. These include Muller cell dysfunction,34 retrograde trans-synaptic degeneration,35 vitreous traction,10 and combination of trans-synaptic degeneration and vitreous traction. In this study, MME was mostly found in the inferior retina and does not support a causative role of the choroidal vasculature or choroidal watershed zones.4
This study has several limitations. First, despite the large number of patients included, a small number of glaucoma eyes with MME were identified as MME happens to be an infrequent finding in glaucoma. Therefore, we cannot ignore the possibility of falsely insignificant results in some comparisons such as visual acuity (type II error). This would have to be addressed in studies with a larger sample size. We used SD-OCT B-scan images to qualitatively detect presence of MME rather than an automated approach. Sometimes, the quality of OCT scans limited our ability to confirm the visibility of small cyst on earlier visits even with good signal strength!
In conclusion, the presence of MME is potentially associated with worse VF defects in the superior central area in patients with POAG. Younger age and worse MD at baseline are associated with the presence of MME in patients with POAG. Macular microcystic changes may serve as a marker of advanced optic atrophy and their presence implies worse visual function especially in the superior hemifield. The potentially confounding effect of MME in OCT interpretation should be taken into account and can be addressed more in future studies.
Supplementary Material
Funding
J-PH: Research to prevent Blindness (No grant #), Hess foundation (No grant #). KN-M: NIH R01 grant (EY027929), an unrestricted Departmental Grant from Research to Prevent Blindness (No grant #), and an unrestricted grant from Heidelberg Engineering (KNM, no grant #). JC: Research to Prevent Blindness, New York, NY (No grant #).
Footnotes
Competing interests None declared.
Ethics approval This study was approved by the Institutional Review Board at the University of California Los Angeles, adhered to the tenets outlined in the Declaration of Helsinki, and complied with Health Insurance Portability and Accountability Act regulations.
Supplemental material This content has been supplied by the author(s). It has not been vetted by BMJ Publishing Group Limited (BMJ) and may not have been peer-reviewed. Any opinions or recommendations discussed are solely those of the author(s) and are not endorsed by BMJ. BMJ disclaims all liability and responsibility arising from any reliance placed on the content. Where the content includes any translated material, BMJ does not warrant the accuracy and reliability of the translations (including but not limited to local regulations, clinical guidelines, terminology, drug names and drug dosages), and is not responsible for any error and/or omissions arising from translation and adaptation or otherwise.
Additional supplemental material is published online only. To view, please visit the journal online (http://dx.doi.org/10.1136/bjophthalmol-2021-320137).
This paper was presented as a poster at the Annual Meeting of the American Glaucoma Society; February 2020; Washington, D.C., Columbia, USA.
Data availability statement
Data are available upon reasonable request.
REFERENCES
- 1.Medeiros FA, Zangwill LM, Bowd C, et al. Evaluation of retinal nerve fiber layer, optic nerve head, and macular thickness measurements for glaucoma detection using optical coherence tomography. Am J Ophthalmol 2005;139:44–55. [DOI] [PubMed] [Google Scholar]
- 2.Morgan JE. Retina ganglion cell degeneration in glaucoma: an opportunity missed? A review. Clin Exp Ophthalmol 2012;40:364–8. [DOI] [PubMed] [Google Scholar]
- 3.Abegg M, Dysli M, Wolf S, et al. Microcystic macular edema: retrograde maculopathy caused by optic neuropathy. Ophthalmology 2014;121:142–9. [DOI] [PubMed] [Google Scholar]
- 4.Burggraaff MC, Trieu J, de Vries-Knoppert WAEJ, et al. The clinical spectrum of microcystic macular edema. Invest Ophthalmol Vis Sci 2014;55:952–61. [DOI] [PubMed] [Google Scholar]
- 5.Wen JC, Freedman SF, El-Dairi MA, et al. Microcystic macular changes in primary open-angle glaucoma. J Glaucoma 2016;25:258–62. [DOI] [PubMed] [Google Scholar]
- 6.Kisimbi J, Shalchi Z, Mahroo OA, et al. Macular spectral domain optical coherence tomography findings in Tanzanian endemic optic neuropathy. Brain 2013;136:3418–26. [DOI] [PubMed] [Google Scholar]
- 7.Murata N, Togano T, Miyamoto D, et al. Clinical evaluation of microcystic macular edema in patients with glaucoma. Eye 2016;30:1502–8. [DOI] [PMC free article] [PubMed] [Google Scholar]
- 8.Hasegawa T, Akagi T, Yoshikawa M, et al. Microcystic inner nuclear layer changes and retinal nerve fiber layer defects in eyes with glaucoma. PLoS One 2015;10:e0130175. [DOI] [PMC free article] [PubMed] [Google Scholar]
- 9.Kaufhold F, Zimmermann H, Schneider E, et al. Optic neuritis is associated with inner nuclear layer thickening and microcystic macular edema independently of multiple sclerosis. PLoS One 2013;8:e71145. [DOI] [PMC free article] [PubMed] [Google Scholar]
- 10.Barboni P, Carelli V, Savini G, et al. Microcystic macular degeneration from optic neuropathy: not inflammatory, not trans-synaptic degeneration. Brain 2013;136:e239. [DOI] [PubMed] [Google Scholar]
- 11.Bhargava P, Calabresi PA. The expanding spectrum of aetiologies causing retinal microcystic macular change. Brain 2013;136:3212–4. [DOI] [PMC free article] [PubMed] [Google Scholar]
- 12.Gills JP, Wadsworth JA. Degeneration of the inner nuclear layer of the retina following lesions of the optic nerve. Trans Am Ophthalmol Soc 1966;64:66. [PMC free article] [PubMed] [Google Scholar]
- 13.Reichenbach A, Wurm A, Pannicke T, et al. Müller cells as players in retinal degeneration and edema. Graefes Arch Clin Exp Ophthalmol 2007;245:627–36. [DOI] [PubMed] [Google Scholar]
- 14.Govetto A, Su D, Farajzadeh M, et al. Microcystoid macular changes in association with idiopathic epiretinal membranes in eyes with and without glaucoma: clinical insights. Am J Ophthalmol 2017;181:156–65. [DOI] [PubMed] [Google Scholar]
- 15.Mahmoudinezhad G, Lin M, Rabiolo A, et al. Rate of visual field decay in glaucomatous eyes with acquired pits of the optic nerve. Br J Ophthalmol 2021;105:381–6. [DOI] [PubMed] [Google Scholar]
- 16.Mahmoudinezhad G, Mohammadzadeh V, Amini N, et al. Local macular thickness relationships between 2 OCT devices. Ophthalmol Glaucoma 2021;4:209–15. [DOI] [PMC free article] [PubMed] [Google Scholar]
- 17.Gelfand JM, Nolan R, Schwartz DM, et al. Microcystic macular oedema in multiple sclerosis is associated with disease severity. Brain 2012;135:1786–93. [DOI] [PMC free article] [PubMed] [Google Scholar]
- 18.Hodapp E, Parrish RK, Anderson DR. Clinical decisions in glaucoma. Mosby Incorporated, 1993. [Google Scholar]
- 19.Kim JH, Rabiolo A, Morales E, et al. Risk factors for fast visual field progression in glaucoma. Am J Ophthalmol 2019;207:268–78. [DOI] [PubMed] [Google Scholar]
- 20.Wu Z, Saunders LJ, Daga FB, et al. Frequency of testing to detect visual field progression derived using a longitudinal cohort of glaucoma patients. Ophthalmology 2017;124:786–92. [DOI] [PubMed] [Google Scholar]
- 21.Yousefi S, Mahmoudi Nezhad GS, Pourahmad S, et al. Distribution and rates of visual field loss across different disease stages in primary open-angle glaucoma. Ophthalmol Glaucoma 2018;1:52–60. [DOI] [PubMed] [Google Scholar]
- 22.Jiang WJ, Wu JF, Hu YY, et al. Intraocular pressure and associated factors in children: the Shandong children eye study. Invest Ophthalmol Vis Sci 2014;55:4128–34. [DOI] [PubMed] [Google Scholar]
- 23.Sotirchos ES, Saidha S, Byraiah G, et al. In vivo identification of morphologic retinal abnormalities in neuromyelitis optica. Neurology 2013;80:1406–14. [DOI] [PMC free article] [PubMed] [Google Scholar]
- 24.Kessel L, Hamann S, Wegener M, et al. Microcystic macular oedema in optic neuropathy: case series and literature review. Clin Exp Ophthalmol 2018;46:1075–86. [DOI] [PubMed] [Google Scholar]
- 25.Brazerol J, Iliev ME, Höhn R, et al. Retrograde maculopathy in patients with glaucoma. J Glaucoma 2017;26:423–9. [DOI] [PubMed] [Google Scholar]
- 26.Yousefi S, Sakai H, Murata H, et al. Asymmetric patterns of visual field defect in primary open-angle and primary angle-closure glaucoma. Invest Ophthalmol Vis Sci 2018;59:1279–87. [DOI] [PubMed] [Google Scholar]
- 27.Suzuki Y, Iwase A, Araie M, et al. Risk factors for open-angle glaucoma in a Japanese population: the Tajimi study. Ophthalmology 2006;113:1613–7. [DOI] [PubMed] [Google Scholar]
- 28.Kim M, Kim T-W, Park KH, et al. Risk factors for primary open-angle glaucoma in South Korea: the Namil study. Jpn J Ophthalmol 2012;56:324–9. [DOI] [PubMed] [Google Scholar]
- 29.Leung CKS, Ye C, Weinreb RN, et al. Impact of age-related change of retinal nerve fiber layer and macular thicknesses on evaluation of glaucoma progression. Ophthalmology 2013;120:2485–92. [DOI] [PubMed] [Google Scholar]
- 30.Ashimatey BS, King BJ, Swanson WH. Retinal putative glial alterations: implication for glaucoma care. Ophthalmic Physiol Opt 2018;38:56–65. [DOI] [PMC free article] [PubMed] [Google Scholar]
- 31.Tielsch JM, Sommer A, Katz J, et al. Racial variations in the prevalence of primary open-angle glaucoma. The Baltimore eye survey. JAMA 1991;266:369–74. [PubMed] [Google Scholar]
- 32.Saidha S, Sotirchos ES, Ibrahim MA, et al. Microcystic macular oedema, thickness of the inner nuclear layer of the retina, and disease characteristics in multiple sclerosis: a retrospective study. Lancet Neurol 2012;11:963–72. [DOI] [PMC free article] [PubMed] [Google Scholar]
- 33.Dysli M, Ebneter A, Menke MN, et al. Patients with epiretinal membranes display retrograde maculopathy after surgical peeling of the internal limiting membrane. Retina 2019;39:2132–40. [DOI] [PubMed] [Google Scholar]
- 34.Lujan BJ, Horton JC. Microcysts in the inner nuclear layer from optic atrophy are caused by retrograde trans-synaptic degeneration combined with vitreous traction on the retinal surface. Brain 2013;136:e260. [DOI] [PMC free article] [PubMed] [Google Scholar]
- 35.Abegg M, Zinkernagel M, Wolf S. Microcystic macular degeneration from optic neuropathy. Brain 2012;135:e225. [DOI] [PubMed] [Google Scholar]
Associated Data
This section collects any data citations, data availability statements, or supplementary materials included in this article.
Supplementary Materials
Data Availability Statement
Data are available upon reasonable request.