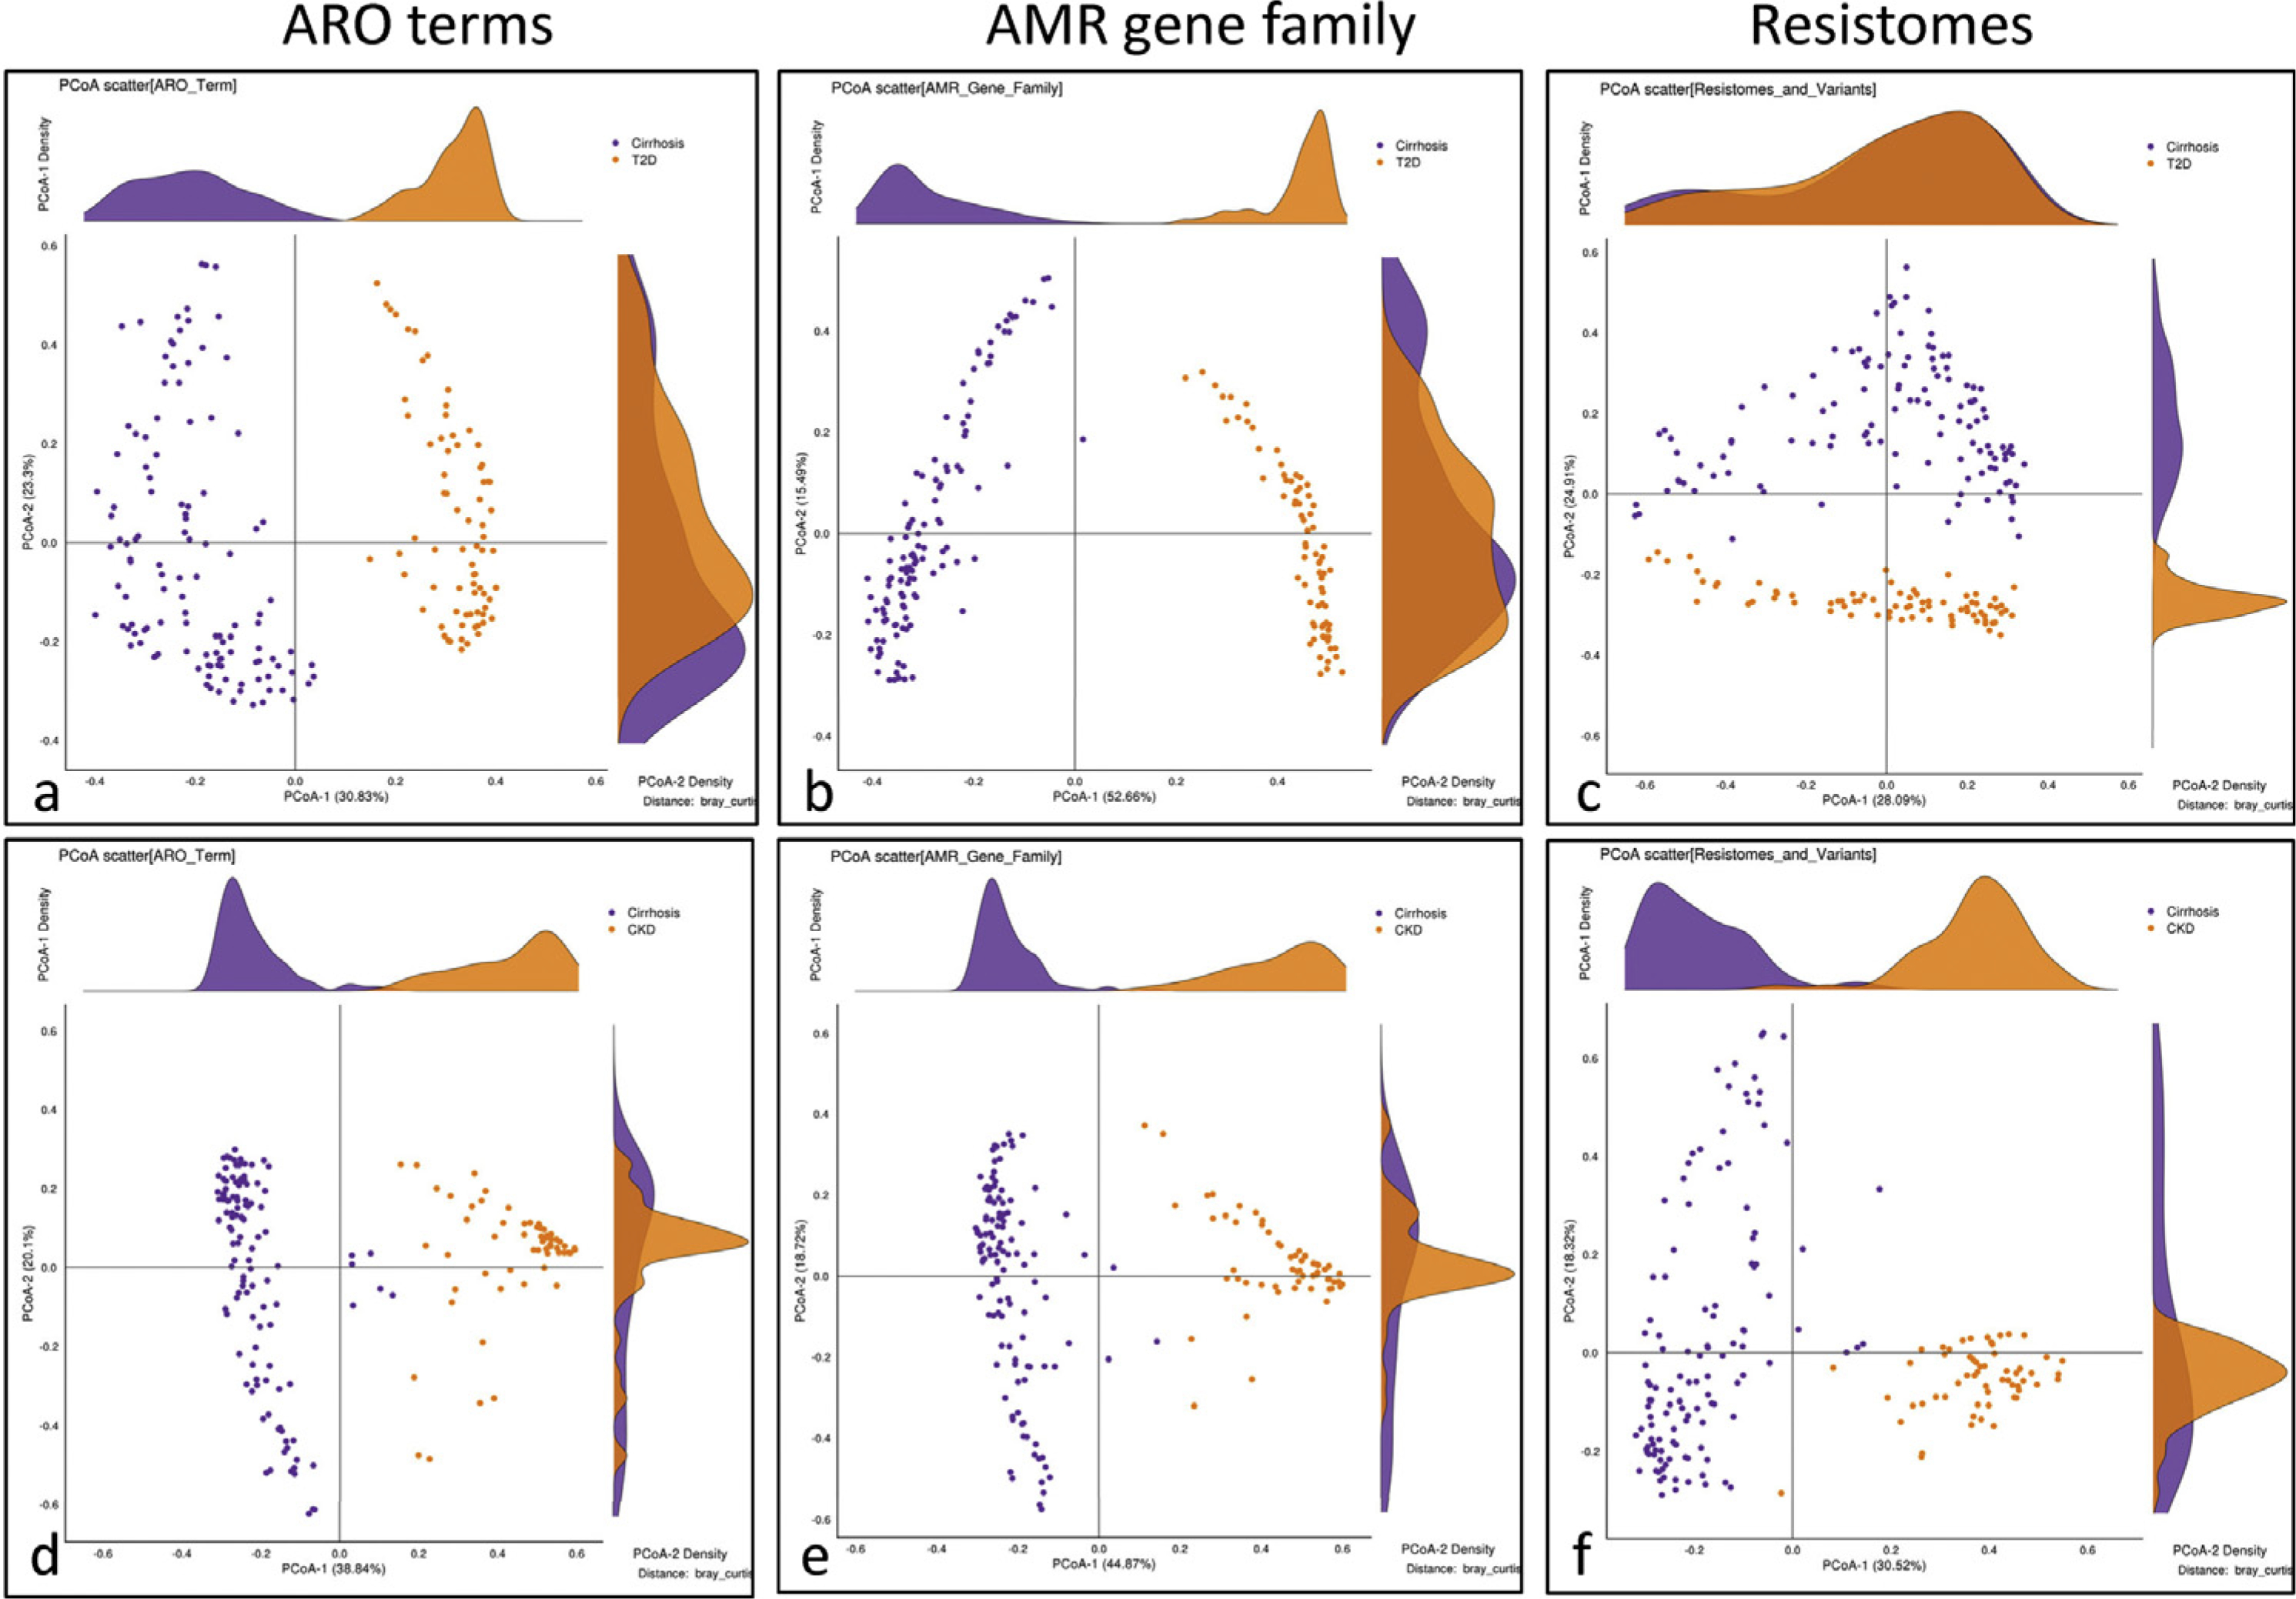
Figure 3.

Principal coordinate analysis of cirrhosis compared to other chronic diseases. (A-C) Comparison of cirrhosis (purple) with T2D (orange, Qin et al30) showing clear separation between the groups on resistome, AMR gene family, and ARO term abundances. (D-F) Comparison of cirrhosis (purple) with CKD on dialysis (orange, Wang et al31) showing clear separation between the groups on resistome, AMR gene family, and ARO term abundances.
