Abstract
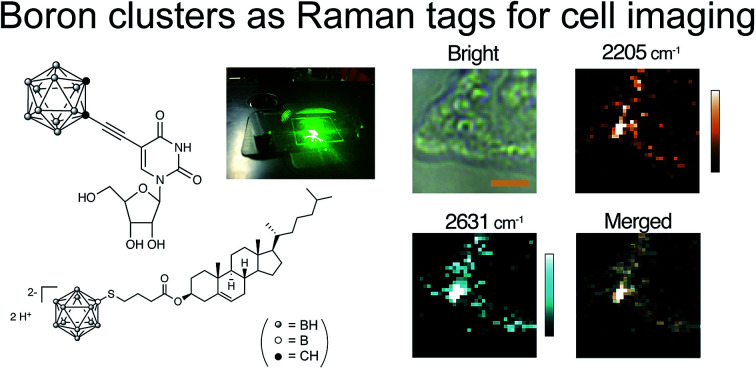
Raman spectroscopic measurements and theoretical calculation revealed that the Raman bands corresponding to the B–H stretching vibrations of two types of simple icosahedral boron clusters, ortho-carborane 3 and closo-dodecaborate 4 appeared at approximately 2450–2700 cm−1, and did not overlap with those of cellular components. Although ortho-carborane 3 possesses a possible property as a Raman probe, it was difficult to measure Raman imaging in the cell due to its poor water solubility. In fact, ortho-carborane derivative 6, which internally has an alkyne moiety, exhibited very weak Raman signals of the C C stretching and the B–H stretching vibrations were barely detected at a 400 ppm boron concentration in HeLa cells. In contrast, closo-dodecaborate derivatives such as BSH (5) were found to be a potential Raman imaging probe cluster for target molecules in the cell. BSH-conjugated cholesterol 7 (BSH-Chol) was synthesized and used in Raman imaging in cells. Raman imaging and spectral analysis revealed that BSH-based Raman tags provide a versatile platform for quantitative Raman imaging.
Introduction
Analyses of the distribution of biomolecules in cells have provided fundamental knowledge of a variety of cellular functions to understand complex molecular processes in living systems.1 Fluorescence microscopy, one of the most powerful tools for the evaluation of cellular behavior, is capable of real-time molecular imaging at the single-molecule level with nanoscale resolution. Fluorescent probes are widely used for visualizing the distribution of cellular components in a single cell in a liquid. However, although fluorescence-based microscopy is a well-established technique, the functionalization of fluorescent probes to label a specific molecule often induces undesired effects. Most of the fluorescent probes are typically large and hydrophobic. Therefore, they sometimes alter the cellular activities or the properties of the targeted biomolecules such as proteins, peptides or even small organic molecules, because their hydrophobic and electrostatic properties lead to undesired interactions to the biomolecules. To avoid such effects, a cell imaging technique that does not require large and hydrophobic fluorescent probes should be established for visualizing biomolecules in the cell.
Raman microscopy can visualize the distribution of organic and biological molecules in the cell without any fluorescent probes by detecting the Raman scattering of the specific vibrational modes of the molecules.2 Raman microscopy has revealed the biodistribution of various molecules including DNA,3 cytochrome c4 and lipid molecules5 in the cells. However, in the case of the small target molecules, their local distribution is difficult to visualize because the Raman bands of cellular components often overlap with and mask those of small molecules of interest. To address the issue, much focus has been given to cell imaging techniques with Raman probes to distinguish the Raman bands of a target molecule from those of other cellular components. These Raman probes are required to possess unique Raman bands at 1800–2800 cm−1, which is a specific region where all the natural cellular components do not generate the Raman bands (called cellular-Raman silent region). Therefore, by tagging the Raman probe, it is possible to visualize target molecules without any interference from cellar components. Alkyne (C C),6–8 deuterium (C–D),9,10 and nitrile (C N)11 have been reported as effective Raman probes, because these probes enabled the visualization of several small molecules such as bromodeoxyuridine (BrdU), choline, fatty acids and amino acids in the cell. The chemical stability of these Raman probes is critical for the quantitative analyses of Raman imaging and needs to be elucidated as well as the toxicity check and the demonstration of Raman imaging.
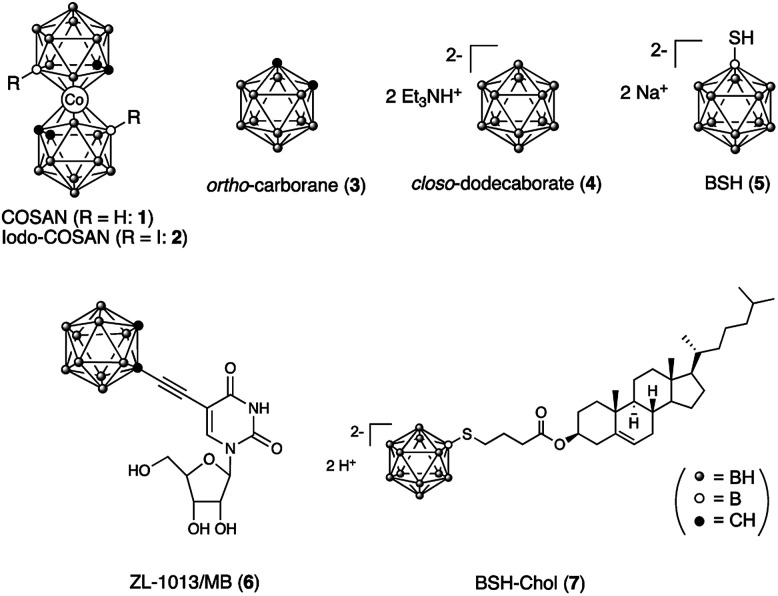
In 2014, Harwood's group first reported that a unique inorganic-boron-based molecule, cobalabisdicarbollide (COSAN: 1 in Fig. 1), possesses B–H stretching vibrations of Raman bands at 2570 cm−1, which is within the cellular-Raman silent region.12 They achieved the direct imaging of 1 and its iodinated derivative 2 in the cell using Raman microspectroscopy and found that both 1 and 2 were localized into certain regions associated with cell components within the cytoplasm. Although the introduction of the compound into the cells was successful, local distributions of specific biomolecules did not become clear.
Fig. 1. Structures of boron clusters (1–4) and their biologically active compounds (5–7).
The situation of Raman tags for cell imaging occurred to us that B–H stretching vibrations of various boron clusters have a potential to be used as an alternative Raman probe if the peaks of those of the boron clusters do not overlap with the cellular components. In this paper, we examined B–H stretching vibrations of Raman bands of various boron clusters, including simple icosahedral boron clusters, ortho-carborane 313 its conjugation with metal nano particles14 and closo-dodecaborate 4,15 and their biologically active derivatives 5–7 (Fig. 1). ortho-Carborane derivative 616 has an internal alkyne moiety, thus can be performed for Raman imaging of both B–H and C C stretching vibrations of Raman bands in the cells. Mercaptoundecahydrododecaborane (BSH, 5) and a closo-dodecaborate derivative are clinically used boron compounds for boron neutron capture therapy (BNCT).17,18 In particular, BSH is less toxic,19 and its chemical modification is possible at a mercapto (–SH) group on the boron cluster. Therefore, we designed BSH-conjugated cholesterol 7 (BSH-Chol) and performed Raman imaging in the cells.
Results and discussion
We first measured the B–H stretching vibrations of representative simple boron clusters; ortho-carborane 3 and closo-dodecaborate bistriethylammonium 4. ortho-Carborane is a hydrophobic icosahedral boron cluster containing two carbons and ten borons.13 Its framework is readily prepared from acetylene and decaborate (B10H14) in organic solvents. Therefore, various ortho-carborane-containing organic molecules can be readily synthesized from the corresponding acetylene derivatives. However, ortho-carborane is highly lipophilic, and its conjugated organic molecules are often poorly soluble in water and relatively cytotoxic.20,21 In contrast, closo-dodecaborate (B12H122−) is an anionic icosahedral boron cluster containing twelve boron atoms and is highly soluble in aqueous media.15 In general, boron compounds conjugated with organic molecules are water-soluble and show low cytotoxicity.19,21,22
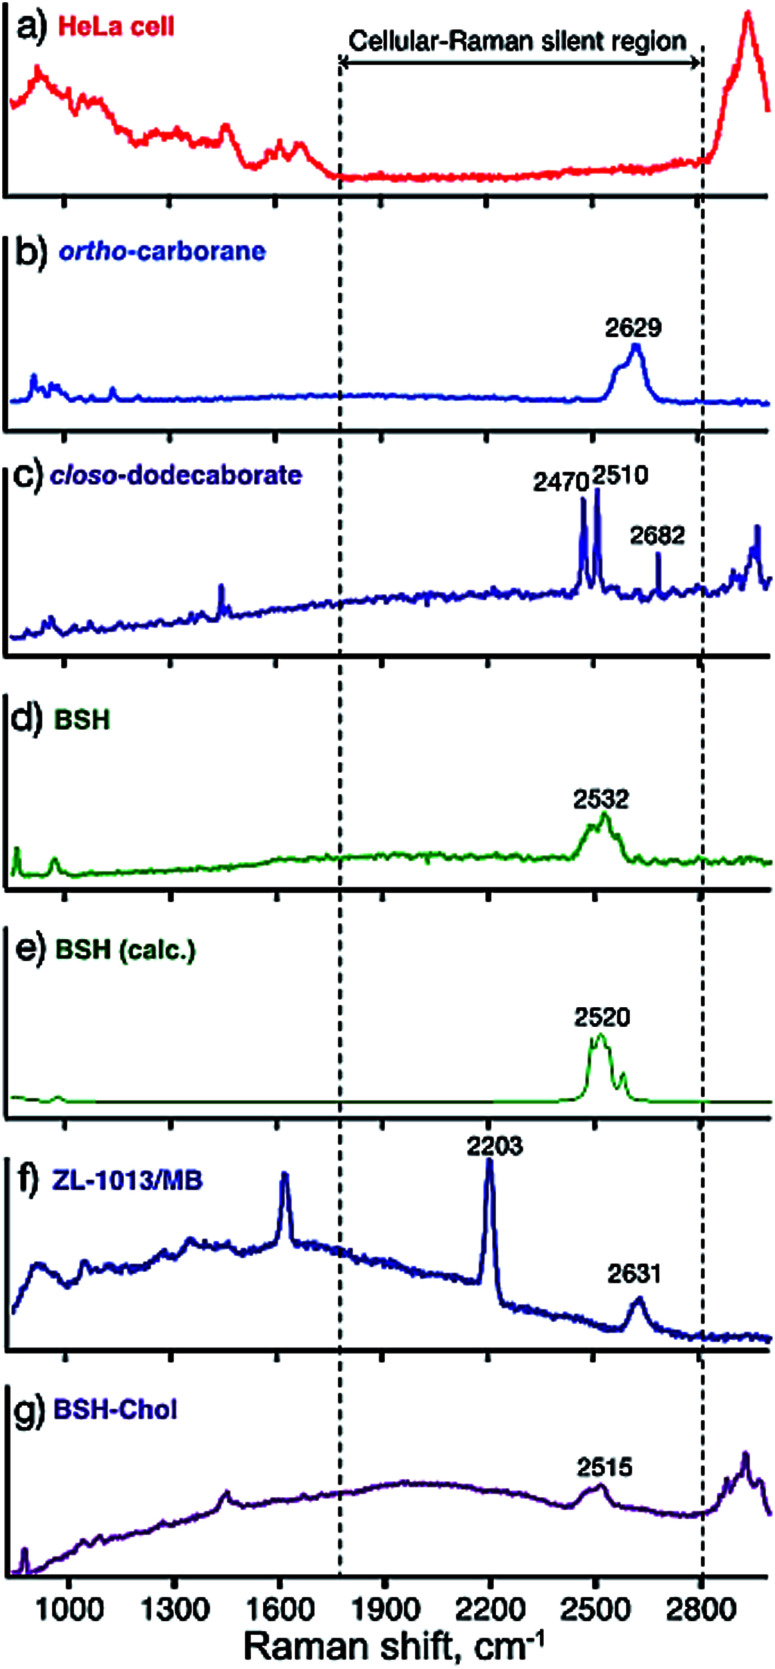
Fig. 2(a) showed the Raman spectrum of fixed HeLa cells in PBS. The spectrum of HeLa cells contains many peaks at the regions of 500–1800 cm−1 (fingerprint region) and 2800 cm−1 ∼ (C–H, O–H, and N–H stretching modes).23,24 On the other hand, there is no peak in the region of 1800–2800 cm−1, where biomolecules constituting HeLa cells do not possess vibrational modes (so-called cellular-Raman silent region). The Raman spectra of the powders of simple boron clusters 3, 4 and 5 are shown in Fig. 2(b)–(d), respectively. These three clusters generate Raman bands at around 2500 to 2600 cm−1. We calculated the vibrational modes of compound 5, and found that the vibrational modes located in this region are assigned to B–H stretching modes (Fig. 2e).25 These results promise the applications of the clusters as Raman probes. Fig. 2(f) shows the Raman spectrum of ortho-carborane derivative 6 that contains an alkyne moiety internally. As known that alkyne also has a characteristic vibrational mode (C C stretching) in the cellular Raman silent region,6–8 both Raman signals corresponding to the C C and the B–H stretching vibrations were observed at 2203 and 2631 cm−1, respectively. These results suggest that compound 6 presented here can be used as a bioorthogonal Raman probe. The Raman spectra of compound 7, which is derived from BSH also showed characteristic modes in the cellular silent region, promising the possibility of the application as a Raman probe.
Fig. 2. Raman spectra of the compounds; (a) a typical Raman spectrum of a HeLa cell in PBS solution, (b) 3, (c) 4, (d) 5, and (e) theoretically calculated Raman spectrum of 5, (f) 6, and (g) 7.
We next conducted Raman imaging of the boron clusters in the cell. Although ortho-carborane 3 possesses a possible property as Raman probes, it was difficult to detect the signals corresponding to the B–H stretching modes, because 3 was poorly water soluble. Next, BSH (5) as a closo-dodecaborate derivative was subjected to the Raman imaging in HeLa cells. However, the Raman images of BSH were not detected by our system after the incubation (200 ppm for 1 h), probably due to their low concentrations in the cells (Fig. S1†). Because there is a proportional relation between the concentration of BSH and Raman intensity as demonstrated in Fig. S2,† we concluded that the BSH molecules were not introduced into HeLa cells or introduced but not stabilized in the cell, then emitted easily from the cell.
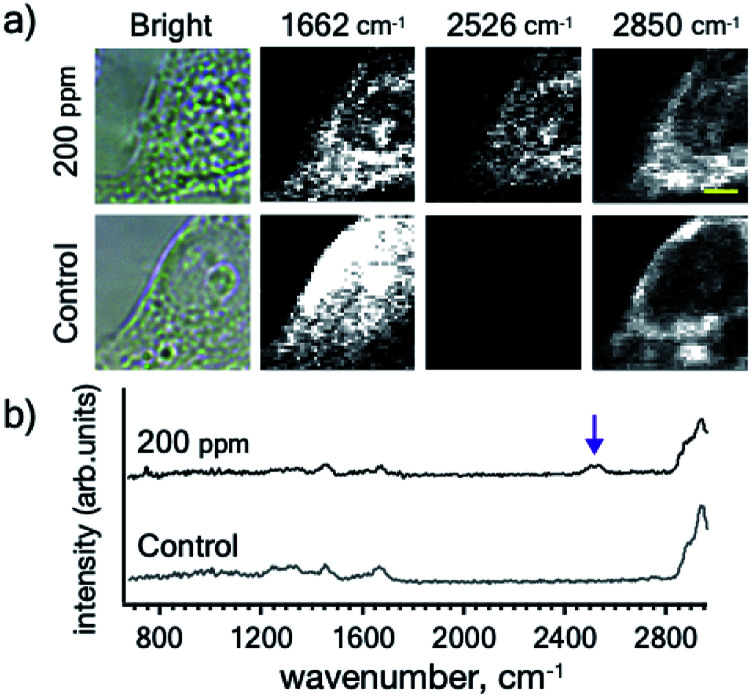
BSH is highly water soluble, relatively low cytotoxic, and it can be easily conjugated with various biologically active molecules through its mercapto (–SH) group. To increase the affinity of BSH and cells, we designed BSH-conjugated cholesterol 7 (BSH-Chol) as shown in Fig. 1. We previously reported the synthesis of the BSH-conjugated cholesterol,22 which was accumulated into liposomal membranes to be delivered into tumor tissues in mice.26 Thus, we expected that BSH-Chol would accumulate in lipid membranes of the cells. In contrast with the results of BSH, BSH-Chol was accumulated in HeLa cells after incubating (200 ppm for 1 h) (Fig. 3). This result indicates that the conjugation with cholesterol drastically enhanced the affinity of BSH to HeLa cells and that the conjugation with ligands or receptors improved the visualization of specific target molecules via Raman imaging. The process of transfer of BSH-Chol is still under investigation by using stimulated Raman scattering spectroscopy, which enables us to perform Raman imaging at a video rate.
Fig. 3. (a) Raman imaging of the HeLa cells incubated with BSH-Chol at a concentration of 200 ppm (b) averaged Raman spectrum (9 measuring points) in the area of the HeLa cell. The arrow indicates the peaks assigned to the B–H stretching modes. Scale bar: 4 μm. Other imaging results are presented in Fig. S3.†.
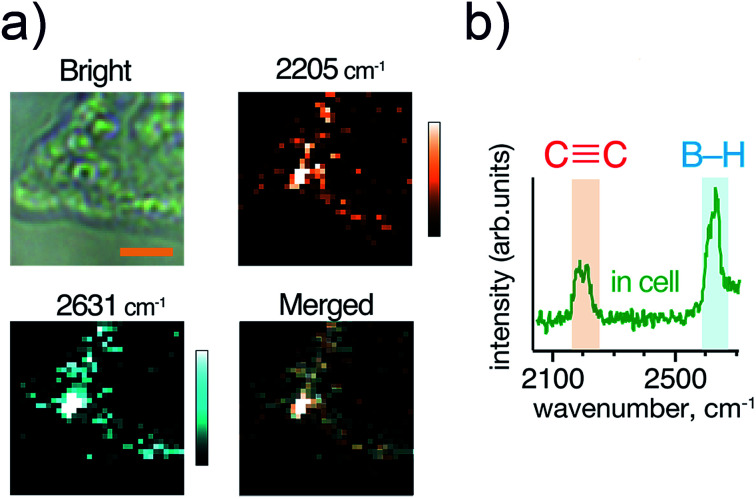
Next, we compared the Raman signals of the C C and the B–H stretching vibrations in the cells. We incubated HeLa cells with compound 6 at a boron concentration of 200 ppm as shown in Fig. 4(a). Both the alkyne and ortho-carborane moieties were clearly imaged with the almost same distribution, indicating that compound 6 was successfully accumulated into HeLa cells.
Fig. 4. (a) Optical and Raman images of HeLa cells incubated with 200 ppm [B] concentration of compound 6. (b) A Raman spectrum of compound 6 inside the cell. Scale bar indicates 4 μm. Other imaging results are presented in Fig. S3.†.
We also investigated the Raman signals from the alkyne and ortho-carborane moieties in HeLa cells. Fig. 4(b) shows the Raman spectrum of HeLa cells after incubation with compound 6. In a powder form [Fig. 2(f)], the C–C stretching mode exhibited much stronger intensity than the B–H stretching mode. The difference originates in the difference in their Raman activities. However, the opposite trend was observed in the cell. The reason for the change in the intensities is still unclear. One of the possible reasons is a chemical reaction of the compound in the cell. However, to answer this question, we need further experiments to check the chemical stability of the alkyne and ortho-carborane moieties in living cells. Nevertheless, our results here strongly indicate the possibility of boron cluster compounds as Raman tags. By combining alkyne and boron cluster moieties with different vibrational energies can perform multi-colour cell imaging, which cannot be realized by FL microscopes.
Finally, we would like to describe the cell toxicity of compounds 6 and 7. Cell viability after the exposure to the compounds is summarized in Fig. S4.† The MTT assay revealed that cell viability with the condition of the exposure in the experiments were 50 and 3.3%, respectively. In the experiment, we also confirmed that some cells lost their native shapes. Therefore, we carefully selected the cells that maintained their native shapes for Raman imaging. The cell toxicity of compound 7 (BSH-Chol) is higher than that of compound 6. Previously, we reported that the cell toxicity of BSH itself is low19 In this work, we, however, found that the toxicity increased by the conjugation with cholesterol. We expect that the amphiphilic character of compound 6 induces physical damage to the cell membranes. Therefore, it is necessary to consider such the effect of the chemical structure on cell toxicity in the design of Raman tags in the future.
Experimental
Compounds used for Raman imaging
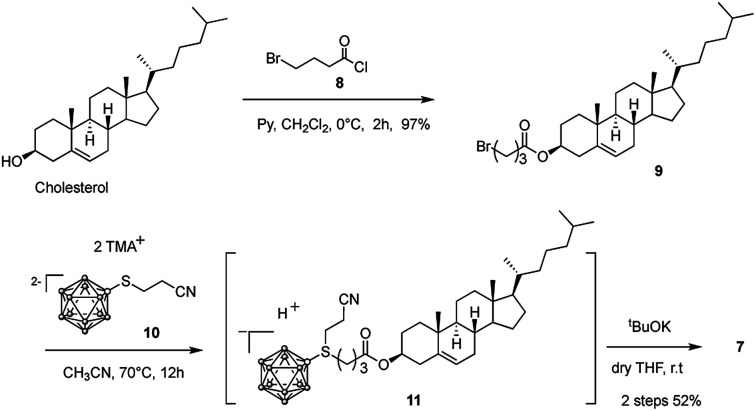
ortho-Carborane (3), closo-dodecaborate (4), and BSH (5) were purchased from Katchem Co. Ltd (Czech Republic). 5-[(1,12-dicarba-closo-dodecaboran-2-yl)ethyn-1-yl]uridine (6) was obtained as described earlier.16 Cholesterol-closo-dodecaborate-conjugate 7 was synthesized from cholesterol according to our previously established protocol with modification as shown in Scheme 1.22
Scheme 1. Synthesis of BSH-conjugated cholesterol 7.
Cholesterol bromobutanoate (9)
To a solution of cholesterol (4.0 g, 10.3 mmol) in dry CH2Cl2 (50 mL), pyridine (1.0 mL, 12.4 mmol) and 4-bromobutanoyl chloride 8 (1.4 mL, 12.4 mmol) were added under a N2 atmosphere. The reaction mixture was stirred at room temperature for 2 h. The solvent was removed under reduced pressure. The residue was purified by column chromatography (silica gel, hexane : AcOEt = 50 : 1) to give compound 9 (5.4 g, 10.0 mmol, 97%). 1H NMR (400 MHz; CDCl3) δ 5.42–5.32 (m, 1H), 4.68–4.56 (m, 1H), 3.46 (t, J = 6.4 Hz, 2H), 2.47 (t, J = 7.2 Hz, 2H), 2.31 (d, J = 3.8 Hz, 2H), 2.21–0.81 (m, 40H), 0.68 (s, 3H); 13C NMR (300 MHz; CDCl3) δ 174.7, 142.4, 125.6, 80.4, 80.0, 79.5, 59.5, 59.0, 52.9, 45.2, 42.6, 42.4, 41.0, 39.8, 39.4, 39.1, 38.7, 35.7, 35.6, 34.8, 34.7, 31.1, 30.9, 30.7, 30.6, 27.1, 26.7, 25.7, 25.4, 23.9, 22.2, 21.6, 14.7; IR (KBr, cm−1) 2949, 1735, 1468, 1376, 1249, 1173, 1003; anal. calcd for C31H51BrO2: C, 69.51; H, 9.60. Found: C, 69.41; H, 9.36.
BSH-Chol (7)
To a solution of compound 9 (2.2 g, 4.1 mmol) in dry acetonitrile (150 mL), boron cluster 10 (1.5 g, 4.1 mmol) was added under a N2 atmosphere. The reaction mixture was stirred for 10 h under the reflux condition. The solvent was removed under reduced pressure. The residue was purified by column chromatography on silica gel (hexane : AcOEt = 1 : 1) to give the crude compound 11. A solution of tBuOK (1.0 mL, 4.1 mmol) in dry THF (10 mL) was added dropwise to a solution of compound 11 in dry THF (50 mL). The mixture was stirred at room temperature for 3 min. The solvent was removed under reduced pressure. The residue was purified by column chromatography on silica gel (hexane : AcOEt = 1 : 3) to give compound 7 as a white solid (1.3 g, 2.1 mmol, 52%). 1H NMR (400 MHz; CD3CN) δ 5.42–5.36 (m, 1H), 4.50 (tt, J = 6.0 Hz, J = 2.2 Hz, 1H), 3.22–2.96 (m, 2H), 2.44–2.26 (m, 4H), 2.14–0.82 (m, 51H), 0.70 (s, 3H); 13C NMR (300 MHz; CD3CN) δ 173.6, 140.6, 122.6, 74.0, 57.1, 56.5, 50.6, 42.6, 40.1, 39.7, 38.3, 37.4, 36.9, 36.4, 36.1, 34.3, 32.2, 32.1, 28.4, 28.3, 28.2, 28.0, 24.4, 24.0, 22.5, 22.3, 21.3, 19.2, 18.6, 11.7; IR (KBr, cm−1) 35 88, 2936, 2493, 1714, 1617, 1467, 1375, 1193, 1059, 845, 722; anal. calcd for C31H62B12O2S: C, 59.23; H, 9.94; S, 5.10. Found: C, 59.42; H, 9.89; S, 5.19; MS (ESI, negative) m/z = 314.2 ([M − 2H]2−/2).
Preparation of cell samples for Raman imaging study
HeLa cells were cultured under 5% CO2 at 37 °C in RPMI-1640 medium (Wako) containing 10% fetal bovine serum (FBS, Gibco). HeLa cells were seeded at the density of 1 × 10⁵ cells per mL × 100 μL were plated on 18 × 18 mm slide glasses in 35 mm dishes. After 1 h incubation under 5% CO2 at 37 °C, medium (1 mL) was added to each dish and incubated for 12 h. Each boron compound sample solution was added to make a final boron concentration of 200 ppm (from a solution of 6000 ppm B in EtOH), and the cells were incubated for 2 h. Then, the medium was removed and the cells were washed three times in the dish with 0.3 mL of PBS buffer. Raman imaging was performed without fixation of cells.
Raman spectral measurements and imaging
We have developed a Raman system with an inverted microscope (IX-71, Olympus).27–29 A solid-state laser for excitation (λ = 532 nm, 100 mW, JUNO, SOC Co. Ltd) was focused on a sample surface through an objective lens (NA = 0.95, × 50, Olympus). Raman scattering light was collected through the same objective lens, dispersed with a spectrometer (HR-640, HORIBA) and detected with a liquid-nitrogen-cooled CCD detector (SPEC-10, Princeton Instruments). A pinhole (150 μm) was placed at the confocal position of the microscope to increase the spatial resolution in the z-direction (approximately, 1 μm). All Raman imaging experiments were performed at room temperature (23 °C).
For the Raman imaging, we measured a spectrum at each point (acquisition time is 1 s). A peak height at each vibrational mode was converted to the contrast in the Raman imaging.
Theoretical calculations of vibrational modes of boron clusters
The calculation was performed based on density functional theory (DFT) with B3LYP functional employing Gaussian 16 software. The optimum structure as well as vibrational frequencies were calculated using 6-31G++(d,p) basis set. IR frequencies obtained from the calculated results were multiplied with the scaling factor of 0.9613.30
Conclusions
We demonstrated the possibility of using two types of simple boron clusters, ortho-carborane 3 and closo-dodecaborate 4, as a Raman probe for cell imaging. Our Raman imaging study revealed that biologically active compounds derived from both ortho-carborane and closo-dodecaborate clusters were effectively taken up by and accumulated in the cells, indicating the possibility of visualization of target molecules specifically by conjugating with ligand molecules.
We also compared the chemical stability of ortho-carborane and alkyne, which was also found to function as a Raman marker because of its characteristic vibrational mode in the cellular-Raman silent region. By employing a molecule containing ortho-carborane, alkyne, and nucleoside, our Raman imaging and spectral analysis revealed that the chemical stability of ortho-carborane in HeLa cells is higher than that of alkyne in HeLa cells. The result indicates that ortho-carborane derivatives would provide a versatile platform for quantitative Raman imaging.
Finally, closo-dodecaborates including BSH are attractive boron sources for BNCT because of their high water solubility and relatively low cytotoxicity. We strongly expect that the Raman imaging would be a powerful technique to optimize a drug for BNCT in the future.
Author contributions
M. M. and T. H. performed all Raman imaging experiments and the analysis of the data. S. A. performed all DFT calculations and contributed to the spectral analysis. S. S, H. N., and Z. J. L. synthesized all chemical compounds. S. S. contributed to the preparation of the cell samples. T. H. and H. N. supervised the whole project and wrote the manuscript. All authors reviewed the manuscript.
Conflicts of interest
The authors declare no conflict of interest.
Supplementary Material
Acknowledgments
This work was supported by the Tokyo Tech World Research Hub Initiative (WRHI) Program of the Institute of Innovative Research, Tokyo Institute of Technology, a Grant-in-Aid for Scientific Research (No. 15KK0184, 17H02202, and 17K20095), and a Grant-in-Aid for Scientific Research in Innovative Areas “Chemistry for Multimolecular Crowding Biosystems” (18H045420) from the Ministry of Education, Culture, Sports, Science and Technology, Japan. We also acknowledge the help of Ms. Kazue Taki for this joint project.
Electronic supplementary information (ESI) available. See DOI: 10.1039/c9ra04228h
Notes and references
- Alberts B., Bray D., Hopkin K., Johnson A. D., Lewis J., Raff M., Roberts K. and Walter P., Essential cell biology, Garland Science, 2015 [Google Scholar]
- Puppels G. J. Schut T. C. B. Sijtsema N. M. Grond M. Maraboeuf F. Degrauw C. G. Figdor C. G. Greve J. J. Mol. Struct. 1995;347:477–483. doi: 10.1016/0022-2860(95)08570-L. [DOI] [Google Scholar]
- Uzunbajakava N. Lenferink A. Kraan Y. Volokhina E. Vrensen G. Greve J. Otto C. Biophys. J. 2003;84:3968–3981. doi: 10.1016/S0006-3495(03)75124-8. [DOI] [PMC free article] [PubMed] [Google Scholar]
- Morimoto T. Chiu L. D. Fujita K. Kanda H. Hozumi K. Nishida K. Fujikado T. Invest. Ophthalmol. Visual Sci. 2018;59:4688. [Google Scholar]
- Syed A. Smith E. A. Annu. Rev. Anal. Chem. 2017;10:271–291. doi: 10.1146/annurev-anchem-061516-045317. [DOI] [PubMed] [Google Scholar]
- Yamakoshi H. Dodo K. Okada M. Ando J. Palonpon A. Fujita K. Kawata S. Sodeoka M. J. Am. Chem. Soc. 2011;133:6102–6105. doi: 10.1021/ja108404p. [DOI] [PubMed] [Google Scholar]
- Yamakoshi H. Dodo K. Palonpon A. Ando J. Fujita K. Kawata S. Sodeoka M. J. Am. Chem. Soc. 2012;134:20681–20689. doi: 10.1021/ja308529n. [DOI] [PubMed] [Google Scholar]
- Wei L. Hu F. H. Shen Y. H. Chen Z. X. Yu Y. Lin C. C. Wang M. C. Min W. Nat. Methods. 2014;11:410–412. doi: 10.1038/nmeth.2878. [DOI] [PMC free article] [PubMed] [Google Scholar]
- Matthaus C. Chernenko T. Quintero L. Milan L. Kale A. Amiji M. Torchilin V. Diem M. Proc. SPIE. 2008:6991. [Google Scholar]
- van Manen H. J. Lenferink A. Otto C. Anal. Chem. 2008;80:9576–9582. doi: 10.1021/ac801841y. [DOI] [PubMed] [Google Scholar]
- Yamakoshi H. Palonpon A. F. Dodo K. Ando J. Kawata S. Fujita K. Sodeoka M. Chem. Commun. 2014;50:1341–1343. doi: 10.1039/C3CC48587K. [DOI] [PubMed] [Google Scholar]
- Tarrés M. Canetta E. Viñas C. Teixidor F. Harwood A. J. Chem. Commun. 2014;50:3370–3372. doi: 10.1039/C3CC49658A. [DOI] [PubMed] [Google Scholar]
- Scholz M. Hey-Hawkins E. Chem. Rev. 2011;111:7035–7062. doi: 10.1021/cr200038x. [DOI] [PubMed] [Google Scholar]
- Kennedy D. C. Duguay D. R. Tay L. L. Richeson D. S. Pezacki J. P. Chem. Commun. 2009:6750–6752. doi: 10.1039/B916561D. [DOI] [PubMed] [Google Scholar]
- Sivaev I. B. Bregadze V. I. Sjoberg S. Collect. Czech. Chem. Commun. 2002;67:679–727. doi: 10.1135/cccc20020679. [DOI] [Google Scholar]
- Bialek-Pietras M. Olejniczak A. B. Paradowska E. Studzinska M. Suski P. Jablonska A. Lesnikowski Z. J. J. Organomet. Chem. 2015;798:99–105. doi: 10.1016/j.jorganchem.2015.07.002. [DOI] [Google Scholar]
- Yamamoto T. Nakai K. Matsumura A. Cancer Lett. 2008;262:143–152. doi: 10.1016/j.canlet.2008.01.021. [DOI] [PubMed] [Google Scholar]
- Soloway A. H. Hatanaka H. Davis M. A. J. Med. Chem. 1967;10:714–717. doi: 10.1021/jm00316a042. [DOI] [PubMed] [Google Scholar]
- Tachikawa S. Miyoshi T. Koganei H. El-Zaria M. E. Vinas C. Suzuki M. Ono K. Nakamura H. Chem. Commun. 2014;50:12325–12328. doi: 10.1039/C4CC04344H. [DOI] [PubMed] [Google Scholar]
- Armstrong A. F. Valliant J. F. Dalton Trans. 2007:4240–4251. doi: 10.1039/B709843J. [DOI] [PubMed] [Google Scholar]
- Issa F. Kassiou M. Rendina L. M. Chem. Rev. 2011;111:5701–5722. doi: 10.1021/cr2000866. [DOI] [PubMed] [Google Scholar]
- Nakamura H. Ueno M. Lee J. D. Ban H. S. Justus E. Fan P. Gabel D. Tetrahedron Lett. 2007;48:3151–3154. doi: 10.1016/j.tetlet.2007.03.043. [DOI] [Google Scholar]
- Movasaghi Z. Rehman S. Rehman I. U. Appl. Spectrosc. Rev. 2007;42:493–541. doi: 10.1080/05704920701551530. [DOI] [Google Scholar]
- Talari A. C. S. Movasaghi Z. Rehman S. Rehman I. U. Appl. Spectrosc. Rev. 2015;50:46–111. doi: 10.1080/05704928.2014.923902. [DOI] [Google Scholar]
- The difference in the broadness of the B–H stretching modes is probably attributed to the difference in intermolecular interaction of the molecules.
- Nakamura H. Methods Enzymol. 2009;465:179–208. doi: 10.1016/S0076-6879(09)65010-2. [DOI] [PubMed] [Google Scholar]
- Oguchi M. Mochizuki M. Yano T. Hara M. Hayashi T. Chem. Lett. 2014;43:808–810. doi: 10.1246/cl.140093. [DOI] [Google Scholar]
- Mochizuki M. Asatyas S. Suthiwanich K. Hayashi T. Chem. Lett. 2016;45:1207–1209. doi: 10.1246/cl.160572. [DOI] [Google Scholar]
- Mochizuki M. Lkhamsuren G. Suthiwanich K. Mondarte E. A. Yano T. A. Hara M. Hayashi T. Nanoscale. 2017;9:10715–10720. doi: 10.1039/C7NR02398G. [DOI] [PubMed] [Google Scholar]
- Bauschlicher C. W. Partridge H. J. Chem. Phys. 1995;103:1788–1791. doi: 10.1063/1.469752. [DOI] [Google Scholar]
Associated Data
This section collects any data citations, data availability statements, or supplementary materials included in this article.


