Abstract
In this study, the therapeutic potential of phosphorene as a drug-delivery system for chlorambucil to treat cancer was evaluated. The geometric, electronic and excited state properties of chlorambucil, phosphorene and the phosphorene–chlorambucil complex were evaluated to explore the efficiency of phosphorene as a drug-delivery system. The nature of interaction between phosphorene and chlorambucil is illustrated through a non-covalent interaction (NCI) plot, which illustrated that weak forces of interaction are present between phosphorene and chlorambucil. These weak intermolecular forces are advantageous for an easy offloading of the drug at the target. Frontier molecular orbital analysis revealed that charge was transferred from chlorambucil to phosphorene during excitation from the HOMO to LUMO. The charge transfer was further supplemented by charge-decomposition analysis (CDA). Excited-state calculations showed that the λmax was red-shifted by 79 nm for the phosphorene–chlorambucil complexes. The photo-induced electron-transfer (PET) process was observed for different excited states, which could be well explained visually based on the electron–hole theory. The photo-induced electron transfer suggests that a quenching of fluorescence occurs upon interaction. This study confirmed that phosphorene possesses significant therapeutic potential as a drug-delivery system for chlorambucil to treat cancer. This study will also motivate further exploration of other 2D materials for drug-delivery applications.
Therapeutic potential of phosphorene as drug delivery system for chlorambucil to treat cancer is evaluated. The photo-induced electron transfer suggests that phosphorene possess significant therapeutic potential as drug delivery system.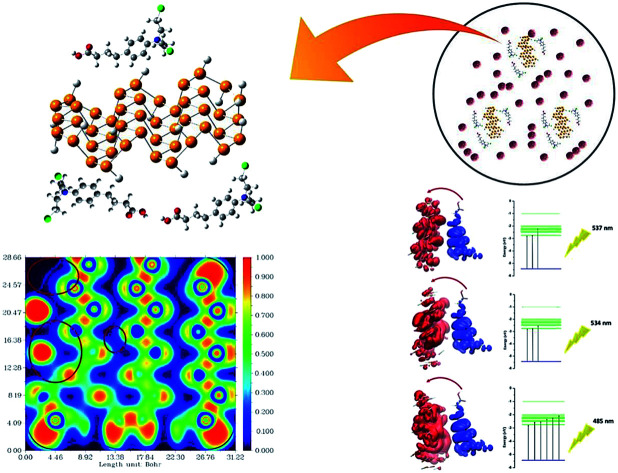
Introduction
Typical therapeutic treatments still experience impeded target specificity, poor bioavailability and organ toxicity.1,2 To improve the pharmacological properties and bioavailability of many drugs, drug-delivery systems are introduced to release a controlled amount of drug at the intended target sites.3 In the field of medicine, nanotechnology has played a revolutionary role in which nanostructures are used to deliver drugs to specific disease-centred cells. The application of nanotechnology in the field of medicine is developing rapidly. In this regard, scientists are focused on developing drug-delivery systems based on nanostructures that can deliver a drug at a specific target site.4 These nanostructures are smaller in size, and therefore, they can cross biological membranes and biological barriers and also increase the life span of the drug in the body. These nanostructures are designed in such a way that they can selectively interact with the diseased cells and aid their direct treatment, therefore, the side-effects of the drug on the other healthy body organs, tissues and cells can be reduced. Also, they control the amount of drug release at the target site.4–6 Drug intake can also be reduced due to the controlled drug release and long-time circulation in the body.7
Interest in drug release through a drug-delivery system was initiated after the discovery of nanostructures, such as fullerenes and nanotubes.8 Functionalized carbon nanotubes and fullerenes have been used for drug delivery to specific target sites in the body.6,9 Two-dimensional nanomaterials, such as molybdenum disulfide (MoS2),10 tungsten diselenide (WSe2),11 hexagonal boron nitride (h-BN),12 bismuth selenide (Bi2Se3)13 and graphene,14 have also been used as nanocarriers because of their good physio-chemical properties. The recent discovery of black phosphorus (so-called phosphorene) has introduced new possibilities for designing a sensible candidate for drug delivery because of its relatively low cytotoxicity and good biocompatibility.15 Owing to the wrinkled lattice configuration of black phosphorus, it has a much higher surface to volume ratio, which can increase the drug-loading capacity as compared to other two-dimensional materials such as h-BN and graphene.16 The two-dimensional black phosphorus shows a layer-dependent band gap, high charge mobility and tangible anisotropy in optoelectronics as well as phononic properties.17–20 The biodegradation of phosphorene inside the human body produces non-toxic intermediates, such as phosphite, phosphate and other PxOy, therefore, BP is not harmful, especially for the treatment of cancer for in vivo applications.16 Because of its tuneable band gap (depending on the number of layers from ∼0.3 in the bulk to ∼2.0 in the monolayer) and broad absorption range in the UV-vis region, black phosphorus is superior to WSe2 and MoS2.21 Due to the promising properties of black phosphorus, it can be used as a carrier by loading the drug into the nanostructure cavities or by loading on the nanostructure by making a complex. The drugs are captured by the nanostructure by weak attraction forces (i.e. London dispersion forces).
The photo-induced charge (PCT) and electron-transfer (PET) processes are of high importance in biological systems because these processes affect the dynamics of other phenomena, such as phosphorescence and fluorescence.22–24 For example, the transfer of electrons or charge from a chelator to a fluorophore causes fluorescence quenching.25,26 In drug-delivery systems along with fluorescence detection, the optical detection ability of the drug and drug carrier is also of high importance.27,28 An excitation wavelength (electron-transfer wavelength) in the visible region is preferred because ultraviolet light is harmful for living organisms.29
Many anticancer therapeutic drugs are effective for cancer treatment, but their use is limited because of their toxicities.30 For example, chlorambucil has a number of side-effects like acute bone marrow suppression, azoospermia, teratogenicity and anovulation.31 In addition, other potential side-effects include gastrointestinal and hepato-toxicity, seizures, drug fever, interstitial pneumonia and pulmonary fibrosis.32,33 To improve the therapeutic index and to reduce the side-effects, researchers are focused on developing nanoscale anticancer drug carriers.34,35 Herein, the drug delivery potential of phosphorene for chlorambucil was evaluated through density functional theory (DFT) and TD-DFT. Chlorambucil is a chemotherapeutic medicine used to treat various types of cancers, such as chronic lymphocytic leukaemia (CLL)36 and Hodgkin and non-Hodgkin lymphoma.37 The mode of action of the drug involves its interaction with DNA.
Computational details
All calculations were performed by using density functional theory (DFT)38 with Gaussian 09 software package.39 The B3LYP functional with the 6-31 G** basis set was used for the optimization of the geometries.40 Several possible orientations of chlorambucil on phosphorene were considered in order to search for the most stable structure. The optimized structures were confirmed as true minima through frequency calculations at the same level of theory (lack of any imaginary frequency). Excited state calculations were performed by time-dependent DFT at TD-B3LYP/6-31G**. The HOMO and LUMO orbital energies and some important parameters, such as the dipole moment, chemical potential (μ), chemical hardness (η), chemical softness (s) and global electrophilicity index (ω), were calculated at the ground-state optimized geometries of the drug, phosphorene and the complex molecule. Electron-localization function (ELF) electron-density images were plotted to analyse the change in the electron density after complex formation.41,42
The charge-decomposition analysis (CDA) was performed to analyse the splitting of the ligand field for the phosphorene–chlorambucil complex systems and the contribution of the energy levels of the two components in the formation of the complex.43 NBO analysis is an important parameter to analyse the intermolecular orbital interactions in complexes, particularly the charge transfer between the two components of a complex.44,45 Electron transitions from the drug to phosphorene and phosphorene to the drug in the complex and the transition in phosphorene itself were also observed. The UV-vis absorption spectra of phosphorene, chlorambucil and phosphorene–chlorambucil were obtained in the gaseous phase. The non-covalent interaction (NCI) analysis and the photo-induced electron-transfer process (PET) were studied at the B3LYP/6-31G** level of theory.
Results and discussion
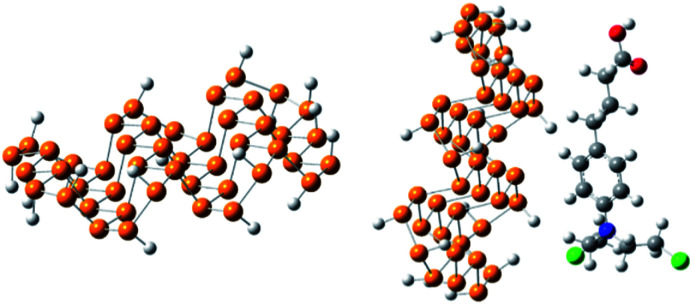
The optimized geometry of phosphorene and the phosphorene–chlorambucil complex are shown in Fig. 1. The optimized geometries of the complex (Fig. 1) clearly illustrate that the drug molecule interacts with phosphorene through P⋯H non-bonding interactions, where the drug molecule acts as a hydrogen bond donor. There are five P⋯H interactions present when chlorambucil is adsorbed on the surface of phosphorene.
Fig. 1. Optimized geometry of phosphorene and the phosphorene–chlorambucil complex.
Two aromatic protons interact with phosphorene at distances of 3.46 and 3.64 Å. The aliphatic protons (CH2) of the drug also interact with the phosphorus atoms of phosphorene with similar interaction distances (3.50–3.60 Å). The dipole moment of the optimized phosphorene was negligible. After the formation of the phosphorene–chlorambucil complex, the dipole moment is increased to 2.49 D. The increase in the dipole moment of this complex is quite useful for its solubility in polar solvents (i.e. water). The increase in the hydrophilicity after the formation of the complex is helpful for the movement of the drug in living systems.
HOMO and LUMO analysis
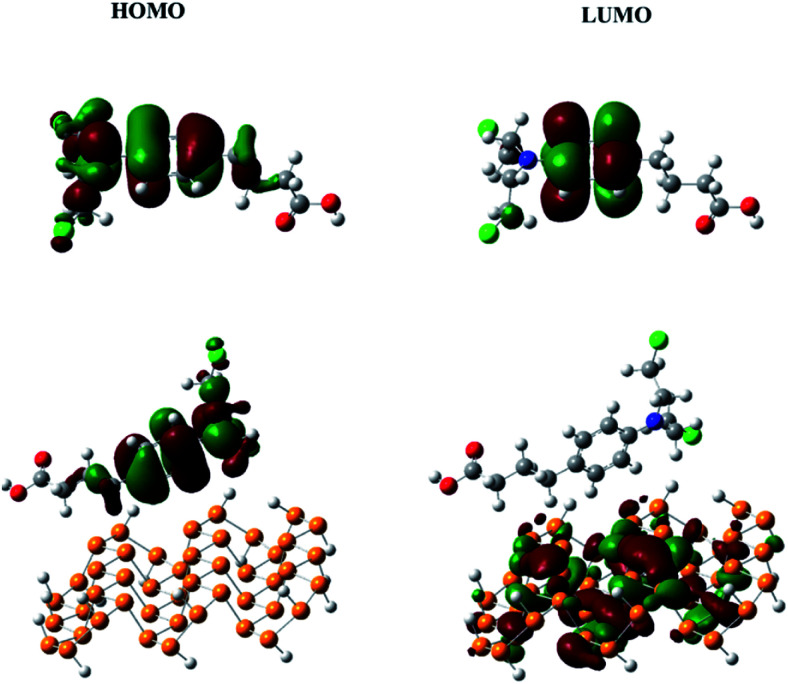
The frontier molecular orbitals (HOMO and LUMO) give very useful information about the reactivity of a molecule.46 The energy gap between the HOMO and LUMO (Eg) helps to understand the kinetic stability and chemical reactivity. For example, a molecule with a small band gap is more polarizable and generally shows low kinetic stability and high chemical reactivity (i.e., it is a soft molecule).47 The HOMO and LUMO of chlorambucil and the phosphorene–chlorambucil complex are shown in Fig. 2. In chlorambucil, the HOMO is distributed on the entire molecule except on the hydroxyl group end, whereas the LUMO is distributed mostly on the benzene ring. For the phosphorene–chlorambucil complex, the LUMO is located on the phosphorene molecule and the HOMO is located on the drug molecule with a complete separation of densities, which indicates that charge transition occurs between the drug and phosphorene molecule. The charge is transferred from the drug to phosphorene. The energies of the HOMO and LUMO and the band gap along with the absorption wavelengths are given in Table 1. Phosphorene has a band gap of 3.28 eV, having HOMO and LUMO energies of −6.01 eV and −2.72 eV, respectively. Chlorambucil has an energy gap of 5.28 eV, with HOMO and LUMO energies of −5.49 and −0.21 eV, respectively. The energy gap of the phosphorene–chlorambucil complex (2.49 eV) is much lower than those of phosphorene (3.28 eV) and chlorambucil (5.28 eV), which indicates that the phosphorene–chlorambucil complex requires less energy to go from the ground state to the excited state. The HOMO energy of the phosphorene–chlorambucil complex matches with the energy of chlorambucil, whereas the LUMO energy matches with that of phosphorene. Interestingly, this pattern is consistent with the densities in the HOMO and LUMO; the HOMO is present on chlorambucil, whereas the LUMO is present on phosphorene. The lowering of the energy gap suggests that the excitation wavelength is red-shifted for the chlorambucil–phosphorene complex. The maximum absorption (λmax) for phosphorene was observed at 458 nm in the UV-visible region, which was red-shifted by 79 nm for the chlorambucil–phosphorene complex (λmax = 537 nm).
Fig. 2. HOMO and LUMO of chlorambucil and the phosphorene–chlorambucil complex.
Energies of the HOMO and LUMO, H–L gap (Eg), maximum absorption wavelength (λmax), dipole moment, chemical potential(μ), chemical hardness (η), chemical softness (s) and global electrophilicity index (ω) of phosphorene, the drug molecule and phosphorene–drug complexes.
| E HOMO | E LUMO | E g (eV) | λ max (nm) | Dipole moment | μ (eV) | η (eV) | s (eV−1) | ω (eV) | |
|---|---|---|---|---|---|---|---|---|---|
| Phosphorene | −6.01 | −2.72 | 3.28 | 458 | 0.56 | −4.37 | 1.64 | 0.30 | 5.82 |
| Chlorambucil | −5.49 | −0.21 | 5.28 | 269 | 2.37 | −2.85 | 5.28 | 0.09 | 0.78 |
| Phosphorene–chlorambucil | −5.43 | −2.76 | 2.67 | 537 | 2.49 | −4.1 | 1.33 | 0.37 | 6.32 |
Charge decomposition analysis (CDA) and density of states (DOS)
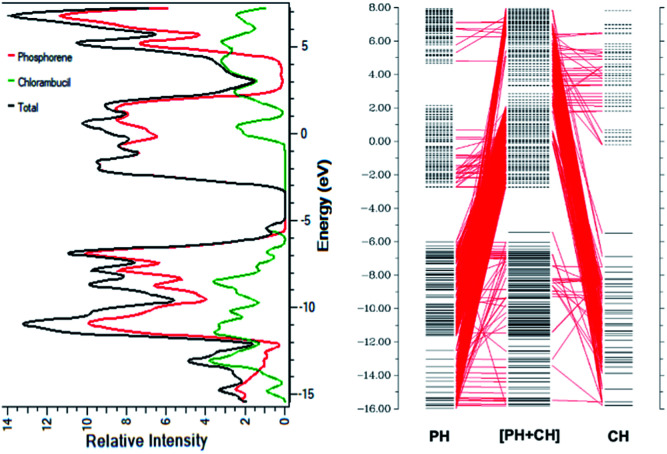
The smaller HOMO–LUMO gap of the complex facilitates the charge transfer within the complex molecule. The decrease in the band gap is due to the addition of molecular energy levels in the complex MOs by the component fragments, as can be seen in the CDA diagram. The CDA diagram clearly shows how the phosphorene–chlorambucil complex orbitals are formed by the mixing of each of the fragment's orbitals (phosphorene and chlorambucil). The addition of a molecular energy level by phosphorene and chlorambucil causes an increase in the energy of the HOMO (−5.43 eV) and a decrease in the energy of the LUMO (−2.76 eV) of the complex, which favourably contributes to a decrease in the band gap, which further contributes to the charge-transfer process. These results also show that the drug was successfully attached to the phosphorene molecule. In the CDA analysis, the orbital interaction diagram was plotted for the complex, in which the orbital contributions of the drug and phosphorene in the formation of the complex were observed. The matching DOS diagrams can be seen in Fig. 3, which is in good agreement with the CDA results. It can be seen that the MOs of phosphorene and chlorambucil are mixed together to form the molecular energy level of the complex and this phenomenon causes the decrease in the band gap after the complex formation (2.67 eV), which contributes to the charge-transfer process.
Fig. 3. (a) Density of states of chlorambucil, phosphorene and phosphorene–chlorambucil (b) charge-decomposition analysis of phosphorene–chlorambucil.
Dipole moment, chemical potential, chemical hardness, chemical softness and global electrophilicity index
The dipole moment, chemical potential (μ), chemical hardness (η), chemical softness (s) and global electrophilicity index (ω) are also given in Table 1 for the drug and phosphorene molecule and for the complex. Interesting properties were observed for the complex. The chemical potential of the complex (−4.1 eV) was lower than that of phosphorene (−4.37 eV); however, it was higher than the drug molecule (−2.85 eV). The chemical hardness (η), chemical softness (s) and global electrophilicity index (ω) follow a uniform pattern, where the properties of the complex are at either end of the spectrum. The complex was softer than phosphorene or the drug molecule, as reflected by the lower hardness and higher softness values. The softness (hardness) values of the complex were 1.33 eV (0.37 eV−1) compared to 1.64 (0.30) and 5.28 (0.09) for phosphorene and the drug, respectively. These parameters give information about the molecular stability and electron transfer in the molecule. The global electrophilicity index (ω) determines the stabilization in energy when a molecular system gains additional charge from its surroundings. The negative chemical potential values of the complex (−4.1 eV) indicated the stability of the complex. The intended target site can be determined based on the softness, hardness and electronegativity of the drug and target site.
Non-covalent interaction (NCI) analysis
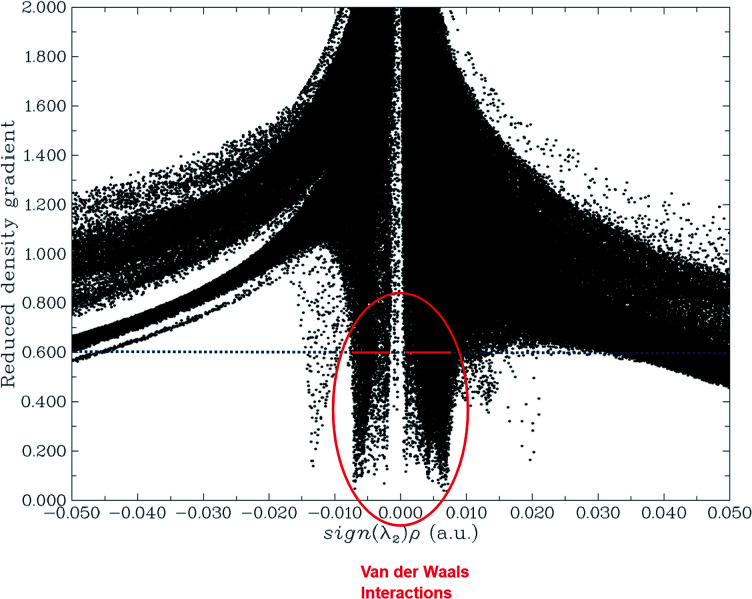
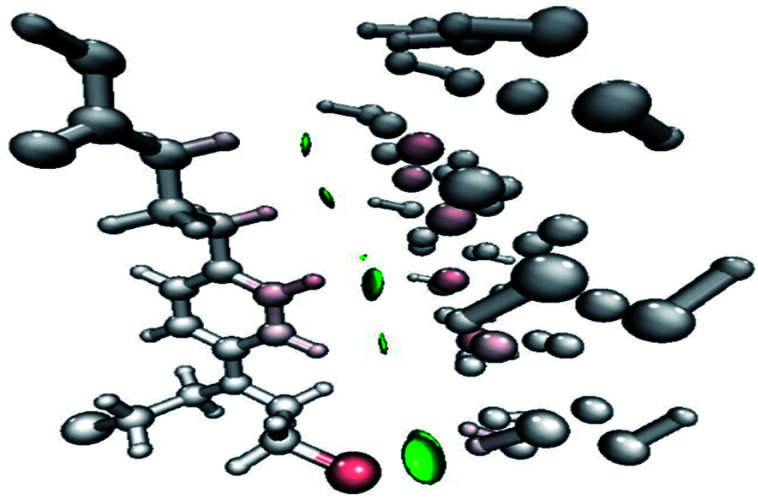
The NCI analysis gives useful information about the non-covalent interactions within a molecule.48 The strong directional attractions associated with localized atom–atom contacts and the molecular regions having weak interactions can be distinguished by an NCI plot. The scatter graphs plotted between the reduced density gradient and electron density r, oriented by the sign of λ2 and the 3D color-filled reduced density gradient isosurface are shown in Fig. 4. From the graph, it can be seen that weak forces of interaction are present between the complex molecules, which can also be seen in the color-filled inter-molecular isosurface image (Fig. 5).
Fig. 4. Non-covalent interaction (NCI) analysis of the phosphorene–chlorambucil complex.
Fig. 5. Orbital overlapping between the drug molecule and phosphorene in phosphorene–chlorambucil.
The green regions between the components of the complex (i.e. phosphorene and drug) depict van der Waals-type interactions, which are weak intermolecular forces. This inference is consistent with the geometric analysis, whereby weak interactions are realized between H atoms of the drug and phosphorus atoms of phosphorene. These weak interactions are quite advantageous because the drug molecule can easily be removed from phosphorene at its target site (destination). The orbital overlap between the drug and phosphorene in the complex depicts the load exchange between the drug and phosphorene.
Electron localization function (ELF) and NBO analysis
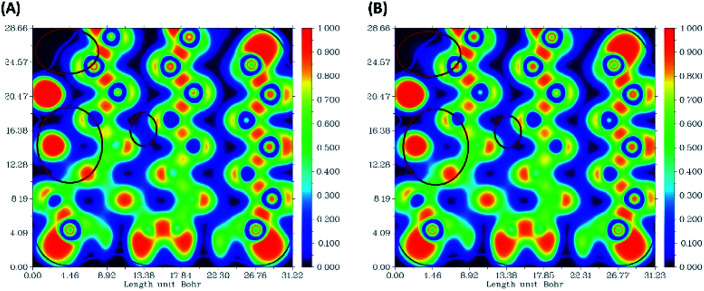
The ELF electron-density images of phosphorene and the phosphorene–drug complex are shown in Fig. 6A and B, respectively. The ELF shows slight changes in the electron density after the formation of the complex. The electron density of phosphorene is affected after the formation of the phosphorene–chlorambucil complex.
Fig. 6. Electron-density images of some phosphorus atoms present in phosphorene: (A) ELF for phosphorene, (B) ELF for phosphorene present in phosphorene–chlorambucil.
These ELF images help to understand the transition occuring from the drug to phosphorene and from phosphorene to the drug in the NBO analysis of the complexes. These transitions cause the changes in the electron density of phosphorus atoms present in phosphorene. The changes in energies for internal transition occuring in phosphorene before and after the formation of complex can be seen in Table 2.
Results of the NBO calculation for phosphorene before and after the formation of a complex with chlorambucil; the energies are given in kcal mol−1.
| CH → PHS | Energies | PHS → PHS | Before | After |
|---|---|---|---|---|

|
0.11 |

|
1.83 | 1.85 |

|
0.06 |

|
1.66 | 1.69 |

|
0.09 |

|
1.55 | 1.56 |

|
0.07 |

|
1.66 | 1.69 |

|
0.75 |

|
3.32 | 3.29 |

|
0.08 |

|
2.92 | 2.97 |

|
0.29 |

|
3.13 | 3.17 |
| PHS → CH |

|
3.15 | 3.19 | |
| LP(1)P3 → σC73–H93 | 0.21 |

|
4.23 | 4.28 |
| LP(1)P4 → σC70–H87 | 0.15 |

|
5.28 | 5.30 |
| LP(1)P7 → σC71–H89 | 0.12 |

|
2.13 | 2.15 |
| LP(1)P17 → σC70–H87 | 0.16 |

|
3.56 | 3.58 |
| LP(1)P18 → σC65–H84 | 0.06 |

|
2.96 | 2.98 |
Photophysical properties
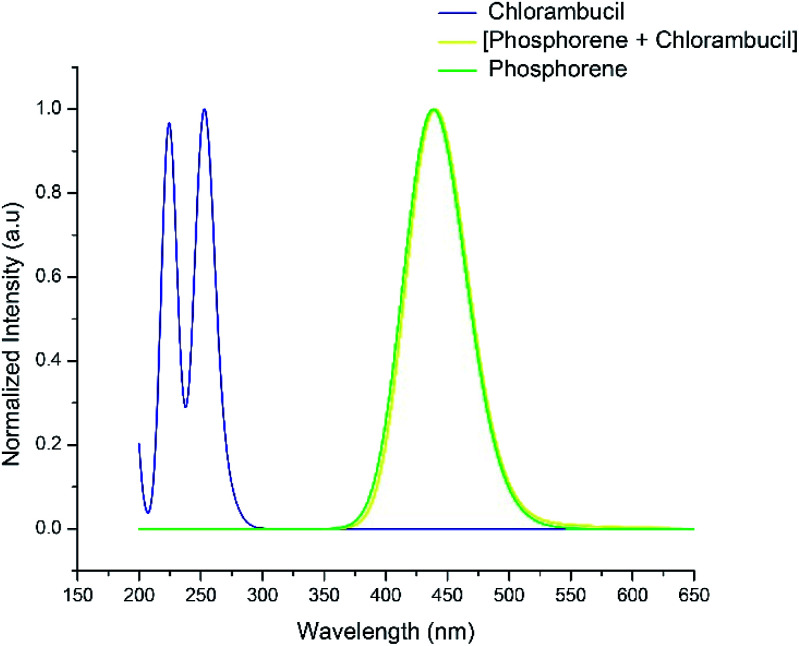
The UV-vis absorption spectra of chlorambucil, phosphorene and the chlorambucil–phosphorene complex are shown in Fig. 7. The chlorambucil–phosphorene complex absorbs at a much higher wavelength (537 nm) than chlorambucil (269 nm), which allows a broad absorption in the UV-vis region. The absorption at 537 nm for the complex corresponds to 2.30 eV, which is very much consistent with the HOMO–LUMO gap. This correlation suggests that the excitation at 537 nm corresponds to the excitation from the HOMO to LUMO, which in turn is a transfer of charge from the drug to phosphorene. Noticeable changes in the visible region of the absorption spectrum can be applied for the colorimetric and fluorescence detection of various types of bioanalytes (e.g. proteins, DNA and inorganic ions), which promotes the target specificity.49
Fig. 7. UV-vis absorption spectra of chlorambucil, phosphorene and phosphorene–chlorambucil.
Photoinduced electron transfer analysis
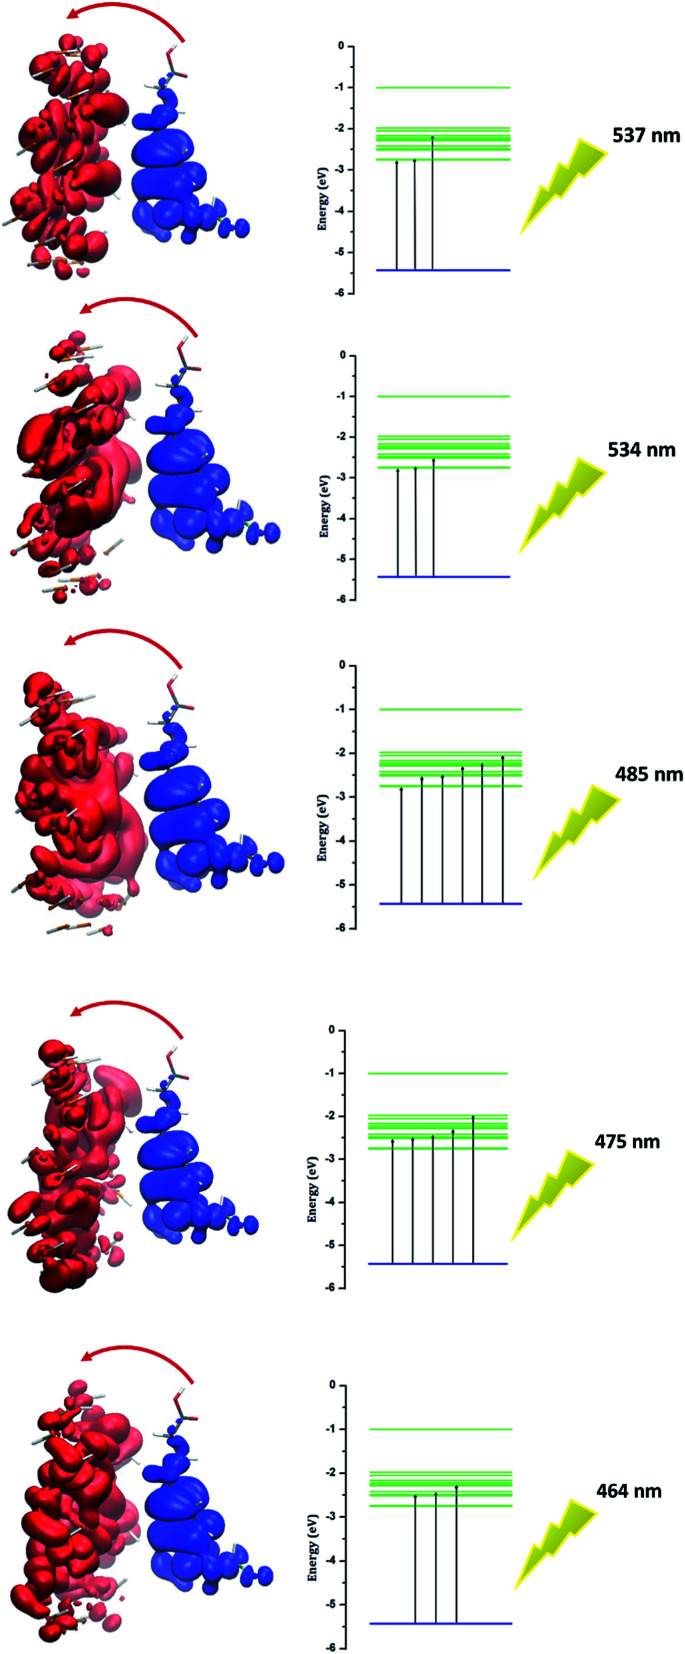
Investigation of electron excitation for a drug delivery system gives information about its biological activity.16 The electron-transfer process and the contribution of electron or hole orbitals can easily be recognized by the electron–hole theory. The electron–hole orbitals for the first five excited states are shown in Fig. 8 for phosphorene–chlorambucil. As shown in Fig. 8, the electron and hole orbitals are separated with good approximation, which represents that the PET phenomenon occurs between the complex components. The PET and PCT processes affect the fluorescence process. In other words, these processes cause quenching in the fluorescence emission spectrum. This can give very useful information about the biochemical system. Analysis results of the hole–electrons for the first five excited states of phosphorene–chlorambucil are given in Table 3. The greater the distance (D) between the orbitals, the longer the charge-transfer length; however, for the localized excitation this distance is small. A smaller value of the hole–electron overlap integral (S) represents a high charge-transfer rate. The distances between the orbitals (D) for the first five excited states of the complex were 6.81 Å, 6.79 Å, 6.65 Å, 6.85 Å and 6.90 Å. The distance between the orbitals (D) was greater for all first excited states, which shows a high charge-transfer length. The hole–electron overlap integrals (S) for the first five excited states were 0.006, 0.003, 0.004, 0.003 and 0.002. A smaller value of the hole–electron overlap integral (S) shows a large charge-transfer rate. This analysis also showed that a charge-transfer process occurs between the complex components, which causes a quenching in the fluorescence emission spectrum. The decrease in the fluorescence intensity can give molecular information as well as the location of the drug in a biological system.
Fig. 8. Electron–hole orbitals and PET process for n-state = 1–5 of phosphorene–chlorambucil.
Analysis of hole–electrons for first five excited states of phosphorene–chlorambucil.
| Excited states of phosphorene–chlorambucil | 1 | 2 | 3 | 4 | 5 |
|---|---|---|---|---|---|
| λ max (nm) | 537 | 534 | 485 | 475 | 464 |
| ΔE (eV) | 2.31 | 2.32 | 2.55 | 2.61 | 2.67 |
| F | 0.002 | 0.0002 | 0.0001 | 0.0003 | 0.00 |
| D (Å) | 6.81 | 6.79 | 6.65 | 6.85 | 6.90 |
| S | 0.006 | 0.003 | 0.004 | 0.003 | 0.002 |
| Transition mode | CT | CT | CT | CT | CT |
For example, the energies of excitation  reached 3.29 kcal mol−1 from 3.32 kcal mol−1 after the complex formation. Similarly, for
  , the excitation energy was raised to 2.69 kcal mol−1 from 2.66 kcal mol−1 and for
  , the excitation energy was raised to 3.19 kcal mol−1 from 3.15 kcal mol−1.
Conclusions
In this study, the therapeutic potential of phosphorene as a drug delivery system for chlorambucil to treat cancer was evaluated. The geometric, electronic and excited state properties of chlorambucil, phosphorene and the phosphorene–chlorambucil complex were evaluated to explore the efficiency of phosphorene as a drug-delivery system. The complex between chlorambucil and phosphorene was established through weak P⋯H bonds. The phosphorene–chlorambucil complex had a dipole moment value of 2.49 D, which was significantly higher than that of phosphorene. The increase in the dipole moment after the formation of the complex suggests an increased solubility in the polar solvent (water). The nature of interaction between phosphorene and chlorambucil was illustrated through a non-covalent interaction (NCI) plot, which illustrated that weak forces of interaction were present between phosphorene and chlorambucil. These weak intermolecular forces are advantageous for an easy offloading of the drug at the target. The HOMO in the phosphorene–chlorambucil complex was localized on the chlorambucil, whereas the LUMO was centered on phosphorene. Frontier molecular orbital analysis revealed that the charge was transferred from chlorambucil to phosphorene during excitation from the HOMO to LUMO. The charge transfer was further supplemented by a charge-decomposition analysis (CDA). The energies for different transitions from the donor to acceptor (drug to phosphorene and phosphorene to drug) in NBO analysis also indicated a charge transfer between the drugs and phosphorene molecules. Excited-state calculations showed that the λmax was red-shifted by 79 nm for the phosphorene–chlorambucil complexes. The photo-induced electron-transfer (PET) process was observed for different excited states, which could be well explained visually based on the electron–hole theory. The photo-induced electron transfer suggests a quenching of fluorescence upon interaction. In summary, phosphorene possesses significant therapeutic potential as a drug-delivery system for chlorambucil to treat cancer.
Conflicts of interest
The authors declare that they have no conflicts of interest.
Supplementary Material
Acknowledgments
The computations/simulations/SIMILAR were performed on resources provided by the Swedish National Infrastructure for Computing (SNIC) at Umeå University, 901 87, Umeå, Sweden. The authors acknowledge the financial and technical support from Punjab Bio-energy Institute (PBI), University of Agriculture Faisalabad (UAF).
References
- Sheng Z. Hu D. Zheng M. Zhao P. Liu H. Gao D. Gong P. Gao G. Zhang P. Ma Y. ACS Nano. 2014;8:12310–12322. doi: 10.1021/nn5062386. [DOI] [PubMed] [Google Scholar]
- Misra S. K. Ghoshal G. Gartia M. R. Wu Z. De A. K. Ye M. Bromfield C. R. Williams E. M. Singh K. Tangella K. V. ACS Nano. 2015;9:10695–10718. doi: 10.1021/acsnano.5b05974. [DOI] [PMC free article] [PubMed] [Google Scholar]
- Allen T. M. Cullis P. R. Science. 2004;303:1818–1822. doi: 10.1126/science.1095833. [DOI] [PubMed] [Google Scholar]
- Liu Y. Miyoshi H. Nakamura M. Int. J. Cancer. 2007;120:2527–2537. doi: 10.1002/ijc.22709. [DOI] [PubMed] [Google Scholar]
- Sun X. Liu Z. Welsher K. Robinson J. T. Goodwin A. Zaric S. Dai H. Nano Res. 2008;1:203–212. doi: 10.1007/s12274-008-8021-8. [DOI] [PMC free article] [PubMed] [Google Scholar]
- Koo O. M. Rubinstein I. Onyuksel H. Nanomedicine. 2005;1:193–212. doi: 10.1016/j.nano.2005.06.004. [DOI] [PubMed] [Google Scholar]
- Nasongkla N. Bey E. Ren J. Ai H. Khemtong C. Guthi J. S. Chin S.-F. Sherry A. D. Boothman D. A. Gao J. Nano Lett. 2006;6:2427–2430. doi: 10.1021/nl061412u. [DOI] [PubMed] [Google Scholar]
- Farokhzad O. C. Langer R. ACS Nano. 2009;3:16–20. doi: 10.1021/nn900002m. [DOI] [PubMed] [Google Scholar]
- Bianco A. Kostarelos K. Prato M. Curr. Opin. Chem. Biol. 2005;9:674–679. doi: 10.1016/j.cbpa.2005.10.005. [DOI] [PubMed] [Google Scholar]
- Liu T. Wang C. Gu X. Gong H. Cheng L. Shi X. Feng L. Sun B. Liu Z. Adv. Mater. 2014;26:3433–3440. doi: 10.1002/adma.201305256. [DOI] [PubMed] [Google Scholar]
- Cheng L. Yuan C. Shen S. Yi X. Gong H. Yang K. Liu Z. ACS Nano. 2015;9:11090–11101. doi: 10.1021/acsnano.5b04606. [DOI] [PubMed] [Google Scholar]
- Weng Q. Wang B. Wang X. Hanagata N. Li X. Liu D. Wang X. Jiang X. Bando Y. Golberg D. ACS Nano. 2014;8:6123–6130. doi: 10.1021/nn5014808. [DOI] [PubMed] [Google Scholar]
- Cheng L. Shen S. Shi S. Yi Y. Wang X. Song G. Yang K. Liu G. Barnhart T. E. Cai W. Adv. Funct. Mater. 2016;26:2185–2197. doi: 10.1002/adfm.201504810. [DOI] [PMC free article] [PubMed] [Google Scholar]
- Chen L. Zhong X. Yi X. Huang M. Ning P. Liu T. Ge C. Chai Z. Liu Z. Yang K. Biomaterials. 2015;66:21–28. doi: 10.1016/j.biomaterials.2015.06.043. [DOI] [PubMed] [Google Scholar]
- Childers D. L. Corman J. Edwards M. Elser J. J. Bioscience. 2011;61:117–124. doi: 10.1525/bio.2011.61.2.6. [DOI] [Google Scholar]
- Choi J. R. Yong K. W. Choi J. Y. Nilghaz A. Lin Y. Xu J. Lu X. Theranostics. 2018;8:1005. doi: 10.7150/thno.22573. [DOI] [PMC free article] [PubMed] [Google Scholar]
- Zhang C. Lian J. Yi W. Jiang Y. Liu L. Hu H. Xiao W. Du S. Sun L. Gao H. J. Phys. Chem. C. 2009;113:18823–18826. doi: 10.1021/jp907062n. [DOI] [Google Scholar]
- Cai Y. Zhang G. Zhang Y.-W. Sci. Rep. 2014;4:6677. doi: 10.1038/srep06677. [DOI] [PMC free article] [PubMed] [Google Scholar]
- Zhang S. Yang J. Xu R. Wang F. Li W. Ghufran M. Zhang Y.-W. Yu Z. Zhang G. Qin Q. ACS Nano. 2014;8:9590–9596. doi: 10.1021/nn503893j. [DOI] [PubMed] [Google Scholar]
- Kim J. Baik S. S. Ryu S. H. Sohn Y. Park S. Park B.-G. Denlinger J. Yi Y. Choi H. J. Kim K. S. Science. 2015;349:723–726. doi: 10.1126/science.aaa6486. [DOI] [PubMed] [Google Scholar]
- Wang Q. H. Kalantar-Zadeh K. Kis A. Coleman J. N. Strano M. S. Nat. Nanotechnol. 2012;7:699. doi: 10.1038/nnano.2012.193. [DOI] [PubMed] [Google Scholar]
- De Silva A. P. Gunaratne H. N. Gunnlaugsson T. Huxley A. J. McCoy C. P. Rademacher J. T. Rice T. E. Chem. Rev. 1997;97:1515–1566. doi: 10.1021/cr960386p. [DOI] [PubMed] [Google Scholar]
- An B. Yuan H. Zhu Q. Li Y. Guo X. Zhang J. Spectrochim. Acta, Part A. 2017;175:36–42. doi: 10.1016/j.saa.2016.12.020. [DOI] [PubMed] [Google Scholar]
- De Silva A. P. Fox D. B. Huxley A. J. Moody T. S. Coord. Chem. Rev. 2000;205:41–57. doi: 10.1016/S0010-8545(00)00238-1. [DOI] [Google Scholar]
- Taherpour A. A. Jamshidi M. Rezaei O. J. Mol. Struct. 2017;1147:815–820. doi: 10.1016/j.molstruc.2017.06.069. [DOI] [Google Scholar]
- Krämer R. Angew. Chem., Int. Ed. 1998;37:772–773. doi: 10.1002/(SICI)1521-3773(19980403)37:6<772::AID-ANIE772>3.0.CO;2-Z. [DOI] [PubMed] [Google Scholar]
- Jiang P. Guo Z. Coord. Chem. Rev. 2004;248:205–229. doi: 10.1016/j.cct.2003.10.013. [DOI] [Google Scholar]
- Reisner E. Arion V. B. Keppler B. K. Pombeiro A. J. Inorg. Chim. Acta. 2008;361:1569–1583. doi: 10.1016/j.ica.2006.12.005. [DOI] [Google Scholar]
- Burdette S. C. Lippard S. J. Coord. Chem. Rev. 2001;216:333–361. doi: 10.1016/S0010-8545(01)00308-3. [DOI] [Google Scholar]
- Park J. W. Chae E. H. Kim S. H. Lee J. H. Kim J. W. Yoon S. M. Choi J.-Y. Mater. Chem. Phys. 2006;97:371–378. doi: 10.1016/j.matchemphys.2005.08.028. [DOI] [Google Scholar]
- Sinoway P. A. Callen J. P. Arthritis Rheum. 1993;36:319–324. doi: 10.1002/art.1780360305. [DOI] [PubMed] [Google Scholar]
- Hoofnagle J. H. Davis G. L. Schafer D. F. Peters M. Avigan M. I. Pappas S. C. Hanson R. G. Minuk G. Y. Dusheiko G. M. Campbell G. Gastroenterology. 1986;91:1327–1334. doi: 10.1016/0016-5085(86)90183-6. [DOI] [PubMed] [Google Scholar]
- Rapini R. P., Jordan R. E. and Wolverton S. E., Cytotoxic agents, Systemic Drugs for Skin Diseases, ed. S. E. Wolverton and J. K. Wilkins, WB Saunders, Philadelphia, 1991, pp. 125–151 [Google Scholar]
- Hua M.-Y. Yang H.-W. Liu H.-L. Tsai R.-Y. Pang S.-T. Chuang K.-L. Chang Y.-S. Hwang T.-L. Chang Y.-H. Chuang H.-C. Biomaterials. 2011;32:8999–9010. doi: 10.1016/j.biomaterials.2011.08.014. [DOI] [PubMed] [Google Scholar]
- Shi J. Liu Y. Wang L. Gao J. Zhang J. Yu X. Ma R. Liu R. Zhang Z. Acta Biomater. 2014;10:1280–1291. doi: 10.1016/j.actbio.2013.10.037. [DOI] [PubMed] [Google Scholar]
- Rai K. R. Peterson B. L. Appelbaum F. R. Kolitz J. Elias L. Shepherd L. Hines J. Threatte G. A. Larson R. A. Cheson B. D. N. Engl. J. Med. 2000;343:1750–1757. doi: 10.1056/NEJM200012143432402. [DOI] [PubMed] [Google Scholar]
- Lacher M. J. Durant J. R. Ann. Intern. Med. 1965;62:468–476. doi: 10.7326/0003-4819-62-3-468. [DOI] [PubMed] [Google Scholar]
- Patel R. Singh Y. P. J. Mol. Struct. 2018;1153:162–169. doi: 10.1016/j.molstruc.2017.10.010. [DOI] [Google Scholar]
- Frisch M. J., Trucks G. W., Schlegel H. B., Scuseria G. E., Robb M. A., Cheeseman J. R., Scalmani G., Barone V., Mennucci B., Petersson G. A., Nakatsuji H., Caricato M., Li X., Hratchian H. P., Izmaylov A. F., Bloino J., Zheng G., Sonnenberg J. L., Hada M., Ehara M., Toyota K., Fukuda R., Hasegawa J., Ishida M., Nakajima T., Honda Y., Kitao O., Nakai H., Vreven T., Montgomery Jr J. A., Peralta J. E., Ogliaro F., Bearpark M., Heyd J. J., Brothers E., Kudin K. N., Staroverov V. N., Kobayashi R., Normand J., Raghavachari K., Rendell A., Burant J. C., Iyengar S. S., Tomasi J., Cossi M., Rega N., Millam J. M., Klene M., Knox J. E., Cross J. B., Bakken V., Adamo C., Jaramillo J., Gomperts R., Stratmann R. E., Yazyev O., Austin A. J., Cammi R., Pomelli C., Ochterski J. W., Martin R. L., Morokuma K., Zakrzewski V. G., Voth G. A., Salvador P., Dannenberg J. J., Dapprich S., Daniels A. D., Farkas O., Foresman J. B., Ortiz J. V., Cioslowski J. and Fox D. J., Gaussian 09, Revision B.01, Gaussian Inc., Wallingford, 2010 [Google Scholar]
- Becke A. J. Chem. Phys. 1993;98:5648. doi: 10.1063/1.464913. [DOI] [Google Scholar]
- Jamshidi M. Rezaei O. Belverdi A. R. Malekian S. Belverdi A. R. J. Mol. Struct. 2016;1123:111–115. doi: 10.1016/j.molstruc.2016.06.005. [DOI] [Google Scholar]
- Su X. Si P. Hou Q. Kong X. Cheng W. Phys. B. 2009;404:1794–1798. doi: 10.1016/j.physb.2009.02.021. [DOI] [Google Scholar]
- Wagner F. R. Bezugly V. Kohout M. Grin Y. Chem.–Eur. J. 2007;13:5724–5741. doi: 10.1002/chem.200700013. [DOI] [PubMed] [Google Scholar]
- Rajesh P. Kandan P. Sathish S. Manikandan A. Gunasekaran S. Gnanasambandan T. Abirami S. B. J. Mol. Struct. 2017;1137:277–291. doi: 10.1016/j.molstruc.2017.01.072. [DOI] [Google Scholar]
- Gangadharan R. P. Krishnan S. S. Acta Phys. Pol., A. 2014;125:18–22. doi: 10.12693/APhysPolA.125.18. [DOI] [Google Scholar]
- Seminario J. M., Recent developments and applications of modern density functional theory, Elsevier, 1996 [Google Scholar]
- Fukui K. Angew. Chem., Int. Ed. Engl. 1982;21:801–809. doi: 10.1002/anie.198208013. [DOI] [Google Scholar]
- Johnson E. R. Keinan S. Mori-Sanchez P. Contreras-Garcia J. Cohen A. J. Yang W. J. Am. Chem. Soc. 2010;132:6498–6506. doi: 10.1021/ja100936w. [DOI] [PMC free article] [PubMed] [Google Scholar]
- Ling X. Wang H. Huang S. Xia F. Dresselhaus M. S. Proc. Natl. Acad. Sci. U. S. A. 2015;112:4523–4530. doi: 10.1073/pnas.1416581112. [DOI] [PMC free article] [PubMed] [Google Scholar]


