

Abstract
Medical image segmentation is one of the core tasks of medical image analysis. Automatic segmentation of brain magnetic resonance images (MRIs) can be used to visualize and track changes of the brain’s anatomical structures that may occur due to normal aging or disease. Machine learning techniques are widely used in automatic structure segmentation. However, the contrast variation between the training and testing data makes it difficult for segmentation algorithms to generate consistent results. To address this problem, an image–to–image translation technique called MR image harmonization can be used to match the contrast between different data sets. It is important for the harmonization to transform image intensity while maintaining the underlying anatomy. In this paper, we present a 3D U-Net algorithm to segment the thalamus from multiple MR image modalities and investigate the impact of harmonization on the segmentation algorithm. Manual delineations of thalamic nuclei on two data sets are available. However, we aim to analyze the thalamus in another large data set where ground truth labels are lacking. We trained two segmentation networks, one with unharmonized images and the other with harmonized images, on one data set with manual labels, and compared their performances on the other data set with manual labels. These two data groups were diagnosed with two brain disorders and were acquired with similar imaging protocols. The harmonization target is the large data set without manual labels, which also has a different imaging protocol. The networks trained on unharmonized and harmonized data showed no significant difference when evaluating on the other data set; demonstrating that image harmonization can maintain the anatomy and does not affect the segmentation task. The two networks were evaluated on the harmonization target data set and the network trained on harmonized data showed significant improvement over the network trained on unharmonized data. Therefore, the network trained on harmonized data provides the potential to process large amounts of data from other sites, even in the absence of site-specific training data.
Keywords: MRI, thalamus, segmentation, harmonization
1. INTRODUCTION
Brain magnetic resonance image (MRI) segmentation is an important task in brain data analysis and many clinical applications. Automatic segmentation of brain anatomical structures using MRI can help visualize and track brain development in normal aging, injury, or disease. In recent years, machine learning techniques—especially deep learning methods implemented with convolutional neural networks (CNN)—have been widely used for automatic brain MRI segmentation.1–3 In most segmentation algorithms, some MR images with corresponding ground truth labels, referred to as training data, are used to train a model and then the model can be applied to testing data. However, the contrast variation between the training and testing data can degrade the performance of the trained model on the testing data,4 which can be formalized as a domain shift problem.5
To address the domain shift problem, MR image harmonization, an image–to–image translation technique, can be used to transform the intensity from one domain to another and therefore can match the contrast between the training and testing images.6–8 It is worth noting that while the harmonization algorithm manipulates image intensity, the underlying brain anatomy should be maintained. In this work, we investigate the impact of an MR image harmonization method7 on a 3D U-Net9 algorithm for thalamus segmentation from multi-modal MRIs.
The thalamus is a key subcortical structure that contains many thalamic nuclei with various functions. The thalamus controls how sensory and motor signals are passed through different parts of the cerebral cortex10 (see Fig. 1 for an example of MR images cropped around the thalamus). Therefore, volume changes in thalamic nuclei are of great interest in many neurodegenerative studies, such as Alzheimer’s disease,11 multiple sclerosis,12 and traumatic brain injury.13 Thus, accurate and consistent segmentation of the thalamus would be beneficial to better understand and manage neurological diseases. We present a 3D U-Net method to segment the thalamus into different nuclei. Manual delineations of the thalamic nuclei from two data sets are available. Both data sets were acquired under similar protocols. We trained two networks, one with unharmonized images from one data set and tested on the unharmonized images from the other data set. The other network has the same architecture and hyper-parameters, but the training and testing data are harmonized. The harmonization target is a new large data group with different imaging protocol from the two data sets, and manual labels for the nuclei are not available. The two networks showed no significant difference in terms of Dice coefficients, demonstrating that image harmonization maintains the anatomy and does not introduce unwanted side effects to the segmentation network. The two networks were then evaluated on the harmonization target data group. The network trained with harmonized images showed better performance than the other network on whole thalamus segmentation. Therefore, the harmonization algorithm provides a potential to process a large amount of data from different sites given a few ground truth labels from one data set.
Figure 1.

Example training data for the segmentation network. (a) Axial slice of a T1-w MRI. A: anterior; L: left, (b) Fractional anisotropy map from DTI. (c) Knutsson edge map from DTI. (d) Manual nuclei labels overlaid on (a).
2. METHODS
2.1. Data and ground truth labels
We evaluated the segmentation network using 3D brain T1-weighted (T1-w) MRIs and diffusion tensor imaging (DTI) from two data sets. The first data set comprised 22 subjects that were diagnosed with spinocerebellar ataxia (SCA), and the second data set comprised 6 subjects that were diagnosed with multiple sclerosis (MS). The T1-w and DTI were aligned to the MNI space by rigid registration. Both data sets were acquired with similar scanning parameters. The harmonization target for the T1-w images comes from another data set where the subjects were diagnosed with mild traumatic brain injury (MTBI) and the scanning parameters are different from the SCA and MS data. Thalamic nuclei masks for the subjects from SCA and MS data were created by manual delineation.14 There is no manual delineation of the thalamic nuclei for the MTBI data set.
2.2. Thalamus segmentation network
A 3D U-Net is proposed to segment the thalamus and parcellate it into 6 nuclei: anterior nucleus (AN), medial dorsal (MD), ventral nuclear group (VN), pulvinar nucleus (PUL), medial geniculate nucleus (MG), and lateral geniculate nucleus (LG). The input to the network is a multi-channel patch including the T1-w image, and the fractional anisotropy and Knutsson edge maps,14 both calculated from DTI (see Fig. 1 for an example). All the input images are cropped as 128 × 128 × 128 patches around the image center. In the network (Fig. 2), the encoder block consists of a residual unit15 and instance normalization is used to standardize the features. The final decoder block is followed by a convolutional layer to reduce the number of features to 7, i.e., 6 nuclei labels and a background label. The loss function is one minus the mean Dice coefficient16 of each label.
Figure 2.

Architecture of the thalamus segmentation network. The numbers in the encoder and decoder blocks indicate the number of features. The shape of the tensor is denoted at each resolution level.
2.3. Image harmonization
CALAMITI,7,8 an image harmonization approach, learns a disentangled latent space containing anatomical and contrast information; it is used to transform the image contrast between sites. However, it remains unknown how—if at all—the intensity transformation will change the underlying anatomy. We applied white matter (WM) peak normalization17 and CALAMITI to the T1-w MR images of our two data sets, SCA and MS, and trained the thalamus segmentation network, as described below.
3. EXPERIMENTS AND RESULTS
3.1. Quantitative evaluation on the MS data
We used the SCA data set to train the network and evaluated the performance on the MS data set. During training, 20 subjects were used to train and two subjects were used to validate. We trained two networks, one using SCA data where only WM peak normalization was applied to the T1-w images, and the other one using SCA data with T1-w images harmonized to the MTBI data. Both networks are the same except for their training data. The left plot of Fig. 4 presents the contrast latent space, which is a two-dimensional vector for each T1-w image, of the three data sets after WM peak normalization, and before image harmonization. Since SCA and MS were acquired under similar imaging protocols, they have similar parameters in the contrast latent space. The MTBI data have different contrast from those two data sets and are located in a different cluster. The right plot of Fig. 4 presents the same contrast latent space before and after harmonizing all the T1-w MR images in the three data sets to a target image in the MTBI data. We can observe that the three data sets group together in the latent space after harmonization (see solid symbols), which means all the T1-w images have similar contrast.
Figure 4.

Left: A visualization of the contrast latent space (two-dimensional vector) of the T1-w images from SCA, MS, and MTBI data sets before harmonization. The “target” cross is the harmonization target in our experiments. Right: A visualization of the contrast latent space of the three data sets before and after harmonization.
We evaluated the performance of the first network on the MS data without harmonization and the second network on the MS data with T1-w images harmonized to the MTBI data. A visual comparison of the segmentation results is shown in Fig. 3. The gray matter in the harmonized T1-w image is brighter compared to the unharmonized image. We computed the Dice coefficients of each thalamic nuclei and the whole thalamus masks produced by the two networks (see Fig. 5). We note that the network trained on harmonized images achieved competitive results in terms of Dice coefficients compared to the network trained on unharmonized images. We conducted a paired Wilcoxon signed-rank test18 and found no significant differences between the two networks for all labels. It is worth mentioning that the Dice measurement is sensitive to the shape and size of the structure. Therefore the Dice is low for small structures like the LG nucleus. And the proposed method achieved comparable performance with state-of-the-art thalamus segmentation algorithms.19,20
Figure 3.
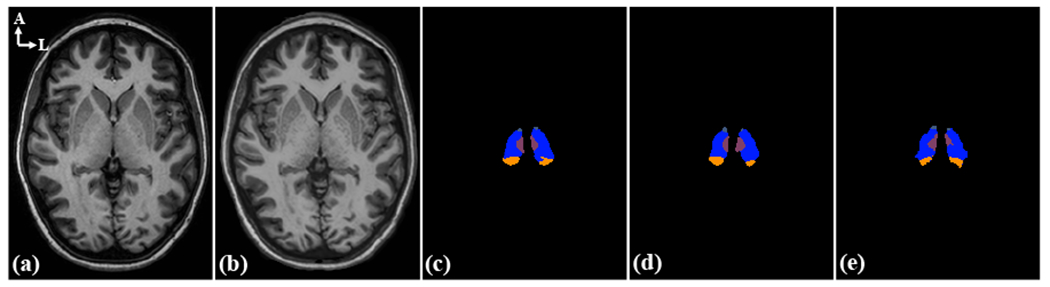
Example thalamus segmentation result on MS data. (a) Unharmonized T1-w image from MS. (b) T1-w image from MS and harmonized to MTBI. (c) Segmentation result of the network trained on unharmonized SCA data and applied on (a). (d) Segmentation result of the network trained on harmonized SCA data and applied on (b). (e) Manual delineation.
Figure 5.
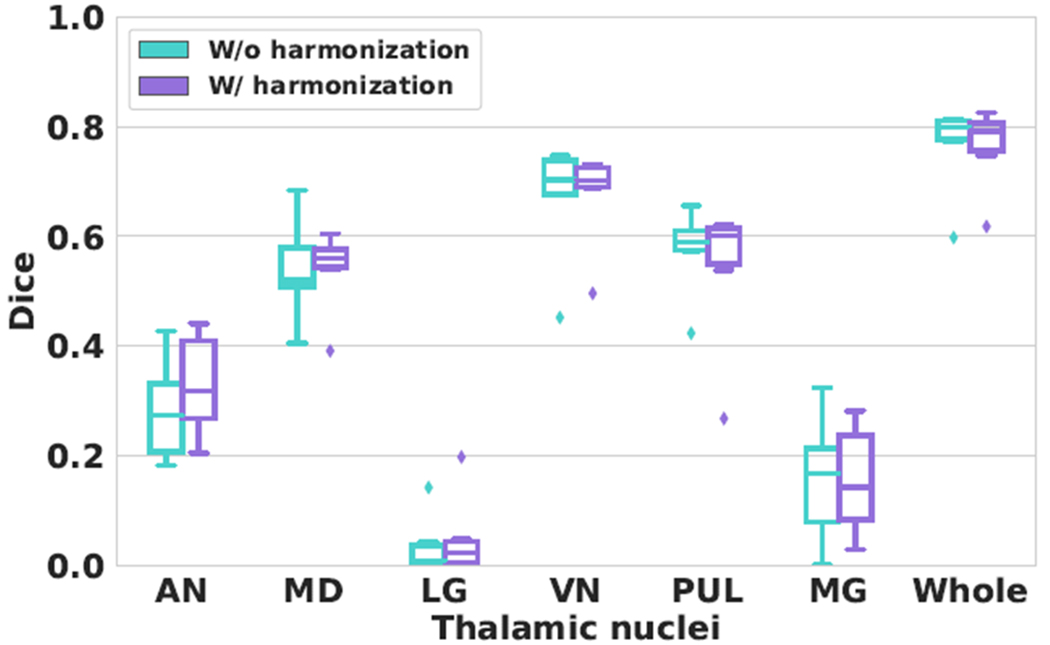
Boxplots of the Dice coefficients on the six nuclei and the whole thalamus (Whole) produced by the two networks. “W/o harmonization”: the network was trained on unharmonized SCA data and tested on unharmonized MS data. “W/ harmonization”: the network was trained on harmonized SCA data and tested on harmonized MS data.
3.2. Quantitative evaluation on the MTBI data
The purpose of applying image harmonization to the training data of the network is to reduce the contrast variation between the training and testing data, therefore enabling the network to process data from different sites. Before harmonization, the T1-w MR images in the MTBI data set (testing data) have different contrast from those in the SCA data set (training data). After harmonization, all the T1-w MR images were translated to a target image and the contrast were matched between the training and testing images. We evaluated the performance of the two networks described in Section 3.1 on the unharmonized and harmonized MTBI data, respectively. We manually delineated the whole thalamus of some key axial slices in 5 MTBI subjects, and there are 60 slices with manual mask in total. Figure 6 presents a visual comparison of the segmentation results from the two networks on an MTBI subject. We can observe that the second network produces a more smooth thalamus boundary than the first one and is more consistent with the manual mask. We computed the Dice coefficients of the whole thalamus masks produced by the two networks (see Fig. 7). The mean Dice coefficients (± standard deviation) on the whole thalamus are 0.817(±0.170) and 0.852(±0.087) for the two networks, respectively. The network trained with harmonized data showed significant improvement (p < 0.01) over the network trained with unharmonized data based on a paired Wilcoxon signed-rank test. Therefore, the network trained with harmonized data can be applied on data from different sites without creating new manual labels or retraining the network on the new data sets.
Figure 6.

Example thalamus segmentation result on MTBI data. (a) Cropped T1-w axial slice after WM peak normalization and before harmonization from the MTBI data set. (b) FA map. (c) Segmentation result of the network trained on unharmonized SCA data and applied on (a). (d) Segmentation result of the network trained on harmonized SCA data and applied on harmonized MTBI data. (e) Manual thalamus mask.
Figure 7.

Boxplots of the Dice coefficients on the whole thalamus produced by the two networks. Circles: mean Dice coefficients. “W/o harmonization”: the network was trained on unharmonized SCA data and tested on unharmonized MTBI data. “W/ harmonization”: the network was trained on harmonized SCA data and tested on harmonized MTBI data. The Dice was calculated on select 2D axial slices, as we do not have a complete 3D delineation. See Sec. 3.2 for more details.
4. DISCUSSIONS AND CONCLUSIONS
In this paper, we present a 3D U-Net architecture to segment and label the thalamus using multiple MR image modalities and evaluate the impact of a MR image harmonization algorithm on the network. We trained two networks on one data set and evaluated on another data set. The two data sets were acquired under similar imaging protocols. The network trained with T1-w images harmonized to a new target achieved competitive performance comparing to the network trained with unharmonized images, demonstrating that the harmonization can maintain the underlying anatomy and does not introduce adverse effects to the segmentation network. The two networks were then applied on the new target data set. The network trained with harmonized images showed significantly better segmentation results compared to the other one. Therefore, the harmonization algorithm provides potential to process large amounts of data from different sites.
ACKNOWLEDGMENTS
This work was supported by the NIH/NINDS under grant R01-NS105503 (PI: R.P. Gullapalli). Support was also provided by the Intramural Research Program of the NIH, National Institute on Aging.
REFERENCES
- [1].Kayalibay B, Jensen G, and van der Smagt P, “CNN-based segmentation of medical imaging data,” arXiv preprint arXiv:1701.03056 (2017). [Google Scholar]
- [2].Shao M, Han S, Carass A, Li X, Blitz AM, Shin J, Prince JL, and Ellingsen LM, “Brain ventricle parcellation using a deep neural network: Application to patients with ventriculomegaly,” NeuroImage: Clinical 23, 101871 (2019). [DOI] [PMC free article] [PubMed] [Google Scholar]
- [3].Han S, Carass A, He Y, and Prince JL, “Automatic cerebellum anatomical parcellation using U-net with locally constrained optimization,” NeuroImage 218, 116819 (2020). [DOI] [PMC free article] [PubMed] [Google Scholar]
- [4].Shao M, Han S, Carass A, Li X, Blitz AM, Prince JL, and Ellingsen LM, “Shortcomings of ventricle segmentation using deep convolutional networks,” in [Understanding and Interpreting Machine Learning in Medical Image Computing Applications], 79–86, Springer; (2018). [DOI] [PMC free article] [PubMed] [Google Scholar]
- [5].He Y, Carass A, Zuo L, Dewey BE, and Prince JL, “Self domain adapted network,” in [23rd International Conference on Medical Image Computing and Computer Assisted Intervention (MICCAI 2020)], Lecture Notes in Computer Science 12261, 437–446, Springer Berlin Heidelberg; (2020). [Google Scholar]
- [6].Dewey BE, Zuo L, Carass A, He Y, Liu Y, Mowry EM, Newsome S, Oh J, Calabresi PA, and Prince JL, “A disentangled latent space for cross-site MRI harmonization,” in [International Conference on Medical Image Computing and Computer-Assisted Intervention], 720–729, Springer; (2020). [Google Scholar]
- [7].Zuo L, Dewey BE, Carass A, Liu Y, He Y, Calabresi PA, and Prince JL, “Information-based disentangled representation learning for unsupervised MR harmonization,” in [International Conference on Information Processing in Medical Imaging], 346–359, Springer; (2021). [Google Scholar]
- [8].Zuo L, Dewey BE, Liu Y, He Y, Newsome SD, Mowry EM, Resnick SM, Prince JL, and Carass A, “Unsupervised MR harmonization by learning disentangled representations using information bottleneck theory,” NeuroImage 243, 118569 (2021). [DOI] [PMC free article] [PubMed] [Google Scholar]
- [9].Çiçek Ö, Abdulkadir A, Lienkamp SS, Brox T, and Ronneberger O, “3D U-Net: learning dense volumetric segmentation from sparse annotation,” in [International conference on medical image computing and computer-assisted intervention], 424–432, Springer; (2016). [Google Scholar]
- [10].Sherman SM and Guillery RW, [Exploring the thalamus], Elsevier; (2001). [Google Scholar]
- [11].Ryan NS, Keihaninejad S, Shakespeare TJ, Lehmann M, Crutch SJ, Malone IB, Thornton JS, Mancini L, Hyare H, Yousry T, et al. , “Magnetic resonance imaging evidence for presymptomatic change in thalamus and caudate in familial alzheimer’s disease,” Brain 136(5), 1399–1414 (2013). [DOI] [PMC free article] [PubMed] [Google Scholar]
- [12].Cifelli A, Arridge M, Jezzard P, Esiri MM, Palace J, and Matthews PM, “Thalamic neurodegeneration in multiple sclerosis,” Annals of Neurology: Official Journal of the American Neurological Association and the Child Neurology Society 52(5), 650–653 (2002). [DOI] [PubMed] [Google Scholar]
- [13].Zhuo J, Jiang L, Sours Rhodes C, Roys S, Shanmuganathan K, Chen H, Prince JL, Badjatia N, and Gullapalli RP, “Early stage longitudinal subcortical volumetric changes following mild traumatic brain injury,” Brain injury 35(6), 725–733 (2021). [DOI] [PMC free article] [PubMed] [Google Scholar]
- [14].Fan X, Thompson M, Bogovic JA, Bazin P-L, and Prince JL, “A novel contrast for DTI visualization for thalamus delineation,” in [Medical Imaging 2010: Visualization, Image-Guided Procedures, and Modeling], 7625, 762533, International Society for Optics and Photonics; (2010). [DOI] [PMC free article] [PubMed] [Google Scholar]
- [15].He K, Zhang X, Ren S, and Sun J, “Identity mappings in deep residual networks,” in [European conference on computer vision], 630–645, Springer; (2016). [Google Scholar]
- [16].Dice LR, “Measures of the amount of ecologic association between species,” Ecology 26(3), 297–302 (1945). [Google Scholar]
- [17].Reinhold JC, Dewey BE, Carass A, and Prince JL, “Evaluating the impact of intensity normalization on MR image synthesis,” in [Medical Imaging 2019: Image Processing], 10949, 109493H, International Society for Optics and Photonics; (2019). [DOI] [PMC free article] [PubMed] [Google Scholar]
- [18].Wilcoxon F, “Individual comparisons by ranking methods,” in [Breakthroughs in statistics], 196–202, Springer; (1992). [Google Scholar]
- [19].Stough JV, Glaister J, Ye C, Ying SH, Prince JL, and Carass A, “Automatic method for thalamus parcellation using multi-modal feature classification,” in [International Conference on Medical Image Computing and Computer-Assisted Intervention], 169–176, Springer; (2014). [DOI] [PMC free article] [PubMed] [Google Scholar]
- [20].Glaister J, Carass A, Stough JV, Calabresi PA, and Prince JL, “Thalamus parcellation using multi-modal feature classification and thalamic nuclei priors,” in [Medical Imaging 2016: Image Processing], 9784, 97843J, International Society for Optics and Photonics; (2016). [DOI] [PMC free article] [PubMed] [Google Scholar]