Abstract
This study aimed to investigate the integrated pharmacokinetics (PK) of Dengzhanxixin injection (EBI) in rats by combination of multicomponent PK and pharmacological assays. First, the protective effects of 13 main components (30 mg kg−1 per day, i.v. for 7 days) on isoprenaline-induced myocardial infarction (MI) in mice were evaluated by measuring electrocardiogram and serum creatine kinase (CK) activity, and observing cardiac pathological changes. Second, the quantitative analysis method of the main components in rat plasma was established and applied to pharmacokinetic study of EBI in rats (0.72 mL kg−1 and 3.2 mL kg−1 of 10 times concentrated EBI, single i.v.). Third, based on the multicomponent PK and anti-MI effects, PK markers were selected, and the integrated PK of EBI in rats were investigated using “plasma drug concentration sum method” and “AUC weighting integrated method”. In the in vivo anti-MI study, the ST segment elevation seldom occurred and the serum CK significantly decreased (P < 0.05 vs. model group); additionally tissue sections showed mild edema and inflammatory infiltration, and there was a little loss of striations in heart tissue in scutellarin, 3-caffeoylquinic acid (3-CQA), apigenin-7-O-glucuronide (A-7-O-G) and 4,5-dicaffeoylquinic acid (4,5-diCQA) treated groups, suggesting that scutellarin, 3-CQA, A-7-O-G and 4,5-diCQA were the main anti-MI effective substances. In the PK study, the systematic exposure level of scutellarin, erigoster B, 3,4-diCDOA (or 4,9-diCDOA), A-7-O-G, and 4,5-diCQA is relatively high. Considering the contents in EBI, anti-MI efficacy and PK properties of each component, scutellarin, 3-CQA, A-7-O-G, erigoster B, 3,4-diCDOA (or 4,9-diCDOA) and 4,5-diCQA were selected as pharmacokinetic markers to characterize the integrated pharmacokinetic behavior of EBI in vivo. The integrated pharmacokinetic study of EBI in rats could reveal the overall in vivo process and improve the safety and rationality of the clinical use of EBI.
The integrated pharmacokinetic study of Dengzhanxixin injection in rats could reveal its overall in vivo process.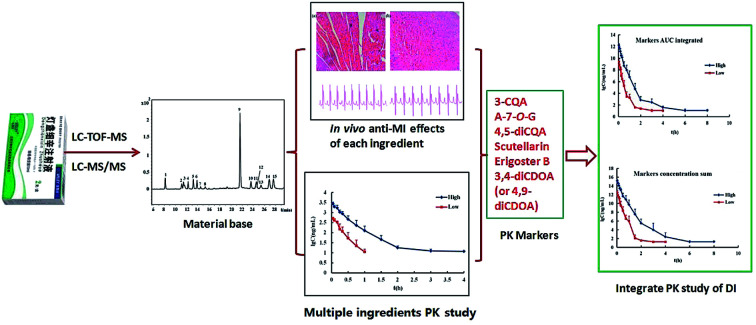
1. Introduction
Traditional Chinese medicine (TCM) injection is an original preparation form from Chinese medicine.1 It has a definite and rapid effect and plays an active role in clinical practice. However, the adverse reactions of TCM injections are faster or more severe than those oral administrated preparations. In recent years, adverse events of TCM injections have occurred from time to time.2 In 2015, the National Adverse Drug Reaction Monitoring Network received a total of 127 000 reports of TCM injections, accounting for 51.3% of adverse drug reactions events of TCMs and the most reported are anti-cardiovascular disease injections.3 The occurrence of adverse affects of TCM injections is often related to incorrect clinical drug use, such as overdose of medications, irrational compounding or combination therapy. The root of the above problems lies in a lack of scientific understanding of the in vivo process of most TCM injections. The components of TCM injections are complicated, and the pharmacological actions of TCM injections always result from the synergistic integration of multi-components, multi-pathways and multi-targets. Thus, it is of great significance to carry out the integrated pharmacokinetic studies of TCM injections to reveal the overall in vivo process of their multiple components and to improve the safety and rationality of the clinical use of TCM injections.4
Many fruitful works on integrated PK of TCMs have been carried out in recent years, mostly based on the “Area under curve (AUC) weighting integrated method”, which proposed by Li et al.5 and referred to: (1) the ingredients with favourable PK characteristics and therapeutic effects were selected as PK markers; (2) the blood drug concentration of each PK marker was determined and its blood drug concentration–time curve was plotted; (3) the ratio of each PK marker' AUC0–∞ to the sum of all the PK markers' AUC0–∞ was calculated and considered as the AUC-based self-defined weighting coefficient of each PK marker; (4) the integrated blood drug concentration of PK markers at each sampling time point was obtained by summing the value of the blood drug concentration × AUC-based self-defined weighting coefficient of each marker, so as to profile the integrated drug concentration–time curve and calculate the integrated PK parameters to indicate the whole PK properties of the TCM.5,6 Based on this method, the integrated PK studies of total Panax Notoginsenosides in rats,5 three rhodojaponins of Rhododendri Mollis Flos extract,7 three flavonoid C-glycosides of Abrus mollis extract,8 twelve alkaloids of Zuojin formula and Fan-Zuojin formula,9 have been carried out. Besides, the total drug concentration method has also been utilized in the integrated PK study of twelve alkaloids of Zuojin formula and Fan-Zuojin formula.9
Dengzhanxixin (Latin name: Erigeron breviscapus (Vant.) Hand.-Mazz.) belonging to the Compositae family, is an important Chinese traditional herbal medicine endemic to Southwestern China, which has been widely used as a folk remedy for treatment of cardiovascular and cerebrovascular diseases.10–13 The major components in Dengzhanxixin are caffeic acid and its esters, as well as flavonoids.14,15 Dengzhanxixin injection (EBI) was made from the aqueous extract of E. breviscapus. Its main components, including phenolic acids, such as caffeic acid, chlorogenic acid, etc., and flavonoids, such as scutellarin, apigenin-7-O-glucuronide, etc., have been qualitatively and/or quantitatively analyzed using high performance liquid chromatography (HPLC)16 or HPLC combined with mass spectrometry (MS).17–19 EBI has been widely used for the clinical treatment of both cardiac ischemic and cerebral ischemic diseases, such as acute myocardial infarction (MI),20 angina pectoris,21 cerebral infarction,22 acute ischemic stroke,23 and so on. Systematic investigation of the mechanism of E. breviscapus for treating cerebrovascular diseases has been reported,13 but the effective components in EBI with anti-MI effects have not been revealed systematically. Besides, studies on pharmacokinetics (PK) of Dengzhanxixin or its injection have been reported. A ultra-high performance liquid chromatography-tandem mass spectrometry (UHPLC-MS/MS) method was selective and sensitive for the PK study of twelve constituents following oral administration of E. breviscapus extracts.24 And a rapid and highly sensitive LC/MS/MS method for simultaneous determination of two phenolic acids in rat plasma was developed, and was successfully applied to a pharmacokinetic study of EBI in rats.25 However, at present, there are no reports on the integrated PK of multicomponents of EBI.
Therefore, in this study, an integrated pharmacokinetic study of EBI in rats has been performed by combination of multicomponent PK and anti-myocardial ischemic assays, which could reveal the anti-myocardial ischemic substances of EBI and its overall pharmacokinetic behavior in rats. This study could provide a new methodological reference for the pharmacokinetic study of multicomponents of Chinese medicines with anti-myocardial ischemic properties.
2. Results and discussion
2.1. In vivo anti-Mi study of main components in EBI in mice
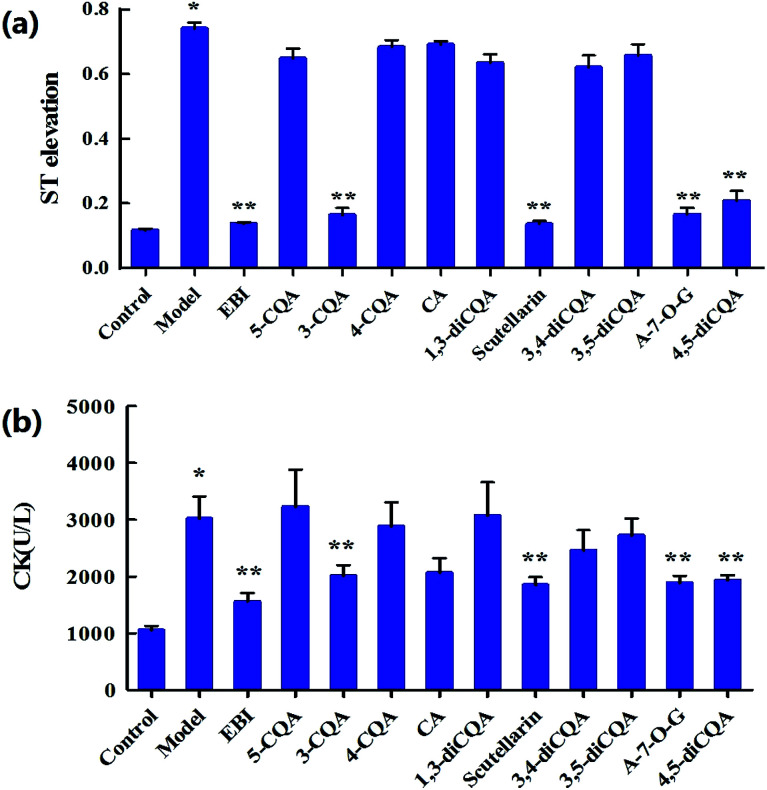
Ten components including 5-caffeoylquinic acid (5-CQA), 3-CQA, 4-CQA, 1,3-dicaffeoylquinic acid (1,3-diCQA), caffeic acid, scutellarin, 3,4-diCQA, 3,5-diCQA, apigenin-7-O-glucuronide (A-7-O-G) and 4,5-diCQA were examined (30 mg kg−1 dosage for each; i.v.) in the anti-MI study in mice. As shown in Fig. S1,† the electrocardiogram (ECG) of the control group showed a regular pattern with defined P, Q, R, S, and T waves. When the MI or necrosis occurred in the heart of the mice, the ST segment of the ECG shifted.26 The isoprenaline-induced MI mice model showed an elevated ST segment (P < 0.05 vs. control group) (Fig. 1a), suggesting that the MI mice models were prepared successfully. The ST segment elevation seldom occurred in scutellarin-, 3-CQA-, A-7-O-G- and 4,5-diCQA-treated groups (P < 0.05 vs. model group). There was no significant difference between the other groups and the model group.
Fig. 1. (a) The ST segment elevations on the seventh day of trial. *P < 0.05, vs. control group; **P < 0.05, vs. model group (mean ± SD, n = 8). (b) The serum CK of each group on the seventh day of trial. *P < 0.05, vs. control group; **P < 0.05, vs. model group (mean ± SD, n = 8).
As shown in Fig. 1b, biochemical changes could be observed in the MI groups. Isoprenaline increased serum creatine kinase (CK) activity, suggesting that myocardial injury occurred in the model group. Meanwhile, scutellarin, 3-CQA, A-7-O-G and 4,5-diCQA groups significantly decreased the serum CK (P < 0.05 vs. model group), suggesting that scutellarin, 3-CQA, A-7-O-G and 4,5-diCQA had protective effects against isoprenaline-induced MI in mice. There was no significant difference between the other groups and the model group.
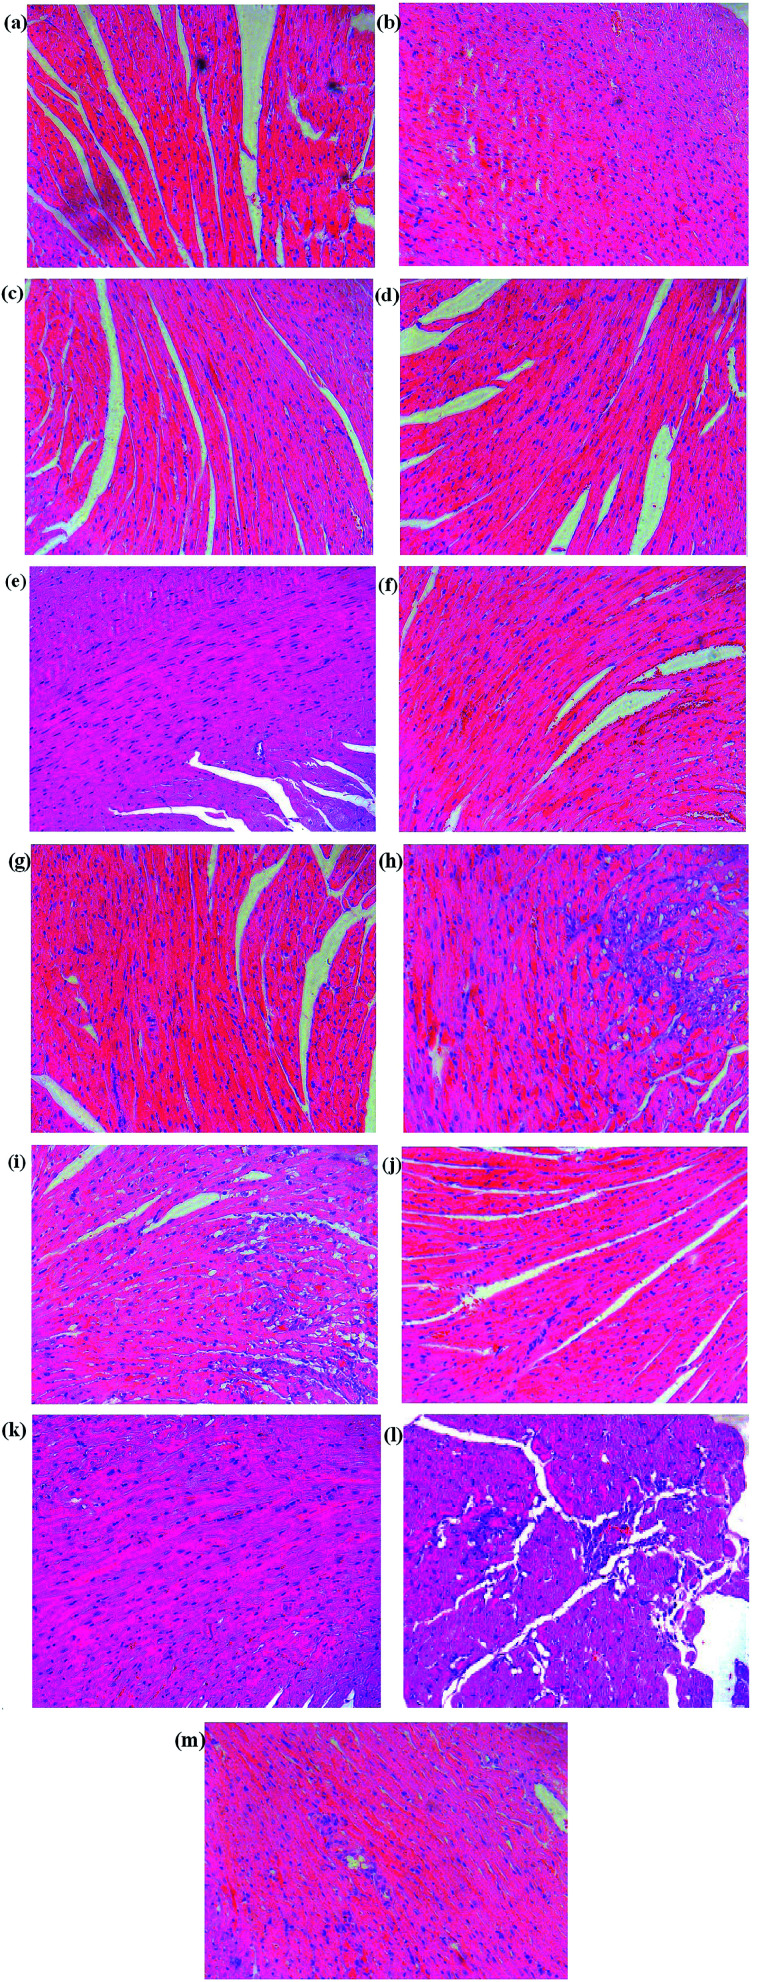
Histopathology of the heart in mice from the control group showed a normal architecture structure with striations, branched appearance and continuity with adjacent myofibrils as shown in Fig. 2. Heart tissue from MI mice models showed marked infiltrating inflammatory cells, edema, inferior continuity with adjacent myofibrils and partial necrosis of myocardial cells. The Dengzhanxixin-treated group showed less severe histological damage, namely, normal myocardial arrangement, clear transverse striations and few invasive inflammatory cells. Tissue sections from scutellarin-, 3-CQA-, A-7-O-G- and 4,5-diCQA-treated groups showed mild edema, inflammatory infiltration and loss of striations in heart tissue. The other groups showed severe histological damage, a large number of cells dissolved, nuclei aggregated, and a large number of inflammatory cell infiltration. The histopathological results suggested that scutellarin, 3-CQA, A-7-O-G and 4,5-diCQA possessed a favorable anti-MI effect.
Fig. 2. The hematoxylin and eosin (H&E) staining pathology sections of each group on the seventh day of trial. (a) Control, (b) model, (c) EBI, (d) scutellarin, (e) caffeic acid, (f) 3-CQA, (g) A-7-O-G, (h) 5-CQA, (i) 4-CQA, (j) 4,5-diCQA, (k) 3,5-diCQA, (l) 3,4-diCQA, and (m) 1,3-diCQA.
To sum up, scutellarin, 3-CQA, A-7-O-G and 4,5-diCQA can significantly reduce the ST segment elevation and serum CK level in mice, and reduce the pathological damage of myocardium in mice, which could be the main effective component of EBI against MI. Besides, scutellarin and 3-CQA have been reported to possess anti-MI effects, respectively;27–29 and Breviscapine, a crude extract of several flavonoids of E. breviscapus, mainly containing scutellarin and A-7-O-G, has been reported to exert a broad range of cardiovascular pharmacological effects, such as myocardial protection,30 both of which have supported our results.
2.2. Pharmacokinetics study of EBI in rats
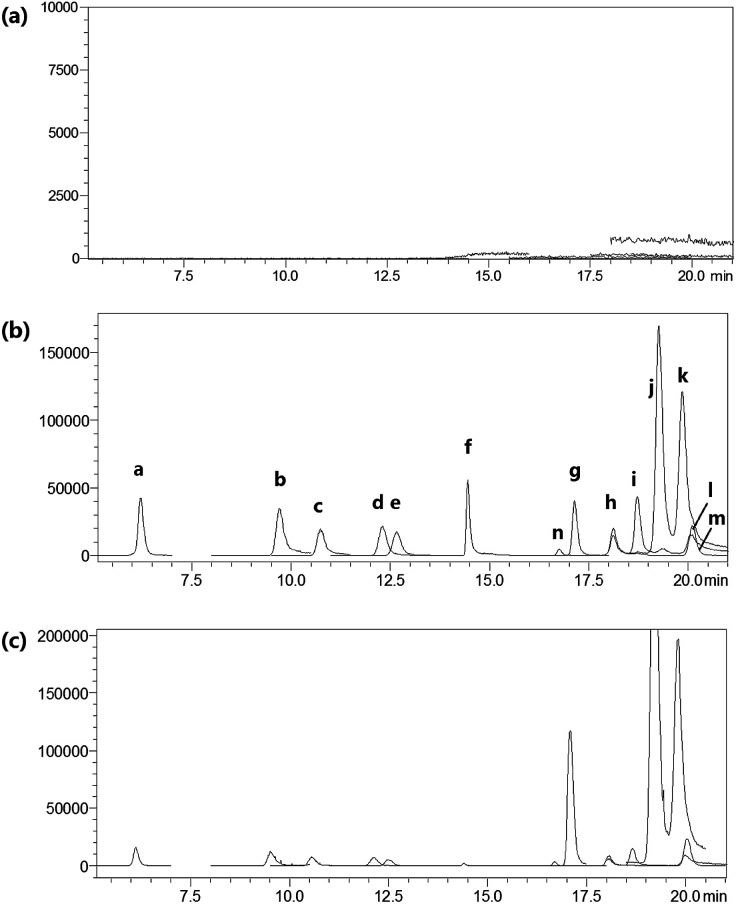
For LC-MS/MS bioanalysis, method validation was performed referring to linearity, the limits of detection (LOD), the limits of quantification (LOQ), precision, accuracy, extraction recovery, matrix effect and stability for the thirteen compounds in plasma. The typical complete multiple reaction monitoring (MRM) and single ion monitoring (SIM) chromatograms in negative mode of the thirteen compounds plus luteolin-7-O-glucoside (L-7-O-G; internal standard (IS)) are shown in Fig. 3. The chromatography run was divided into several time segments for enhancing detection sensitivity. No interference could be observed from the chromatograms, suggesting the good specificity of the presented LC-MS/MS bioanalysis method. All calibration curves were of good linearity with high correlation coefficients (r2 ≧ 0.990) over the tested range, which are summarized in Table S1.† Relative standard deviation (RSD) values of intra- and inter-day precisions were 1.97–10.01% and 0.64–10.82% in Table S2,† and relative error (RE) values of intra- and inter-day precisions were −15.55 to 14.05% and −15.51 to 12.78%, respectively. The overall extraction recoveries and matrix effects of the 13 compounds were in the range of 79.60–112.66% and 66.11–147.69%, respectively, with RSD values below 11.40% as displayed in Table S3.† The 13 compounds proved to be stable in sample solutions under the condition of placing extracted plasma samples in auto-sampler for 12 h, as well as placing plasma samples at 4 °C for 12 h, in freeze–thaw three cycles, and at −80 °C for 30 days, as listed in Table S4.†
Fig. 3. The typical complete MRM and SIM chromatograms in negative mode of the thirteen compounds and L-7-O-G (IS). (a) Blank plasma, (b) spiked plasma and (c) drug plasma after i.v. administration for 5 min. Compounds (a)–(n) present 5-CQA, 3-CQA, 4-CQA, 4-CDOA, caffeic acid, 1,3-diCQA, scutellarin, 3,4-diCQA, 3,5-diCQA, erigoster B, 3,4-diCDOA (or 4,9-diCDOA), A-7-O-G, 4,5-diCQA and IS, respectively.
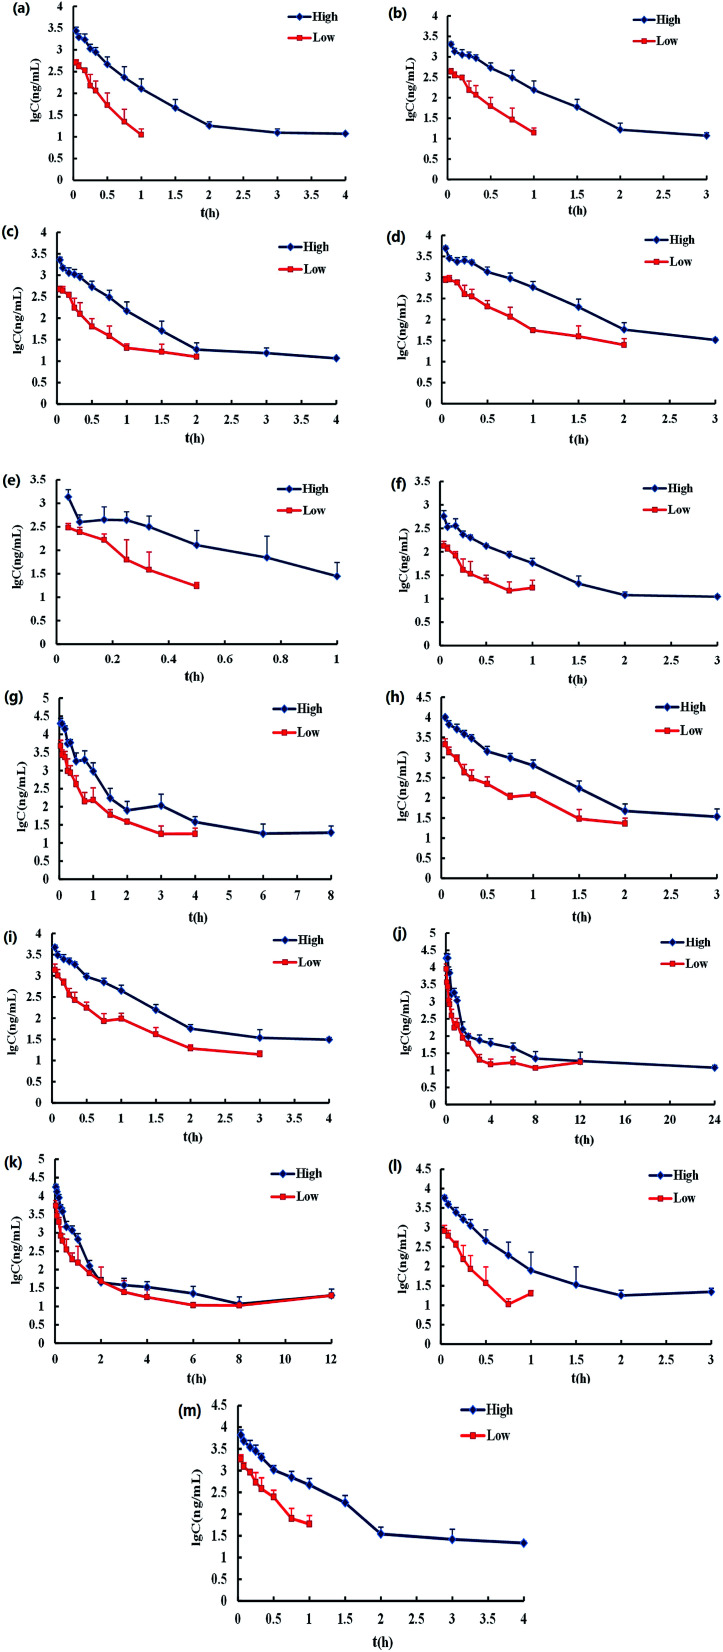
All results were satisfactory, suggesting that the developed LC-MS/MS bioanalysis method could be used for the simultaneous determination of thirteen compounds in rat plasma. The plasma drug concentration–time profiles of thirteen compounds after a single i.v. administration of 7.2 mL kg−1 and 36 mL kg−1 of 10 times concentrated EBI are shown in Fig. 4. The respective pharmacokinetic parameters are listed in Table 1. The results showed that 5-CQA, 3-CQA, 4-CQA, 4-caffeoyl-2,7-anhydro-3-deoxy-2-octulopyranosonic acid (4-CDOA), caffeic acid, 1,3-diCQA, 3,4-diCQA, 3,5-diCQA, A-7-O-G and 4,5-diCQA were eliminated quickly (t1/2 < 1 h), whereas scutellarin, erigoster B and 3,4-diCDOA (or 4,9-diCDOA) were eliminated relatively slowly (t1/2 > 1.2 h) in rat blood. The values of AUC0–t of erigoster B, scutellarin, 3,4-diCDOA (or 4,9-diCDOA), 3,4-diCQA, 3,5-diCQA, A-7-O-G, 4,5-diCQA and 4-CDOA were relatively higher than the others. Among them, the AUC0–t value of erigoster B is the largest in the blood circulation of rats, and scutellarin is the second. In general, the contents of scutellarin, A-7-O-G, 4,5-diCQA and erigoster B in EBI are relatively high; the systematic exposure level of scutellarin, erigoster B, 3,4-diCDOA (or 4,9-diCDOA), A-7-O-G, and 4,5-diCQA is relatively high; scutellarin, 3-CQA, A-7-O-G and 4,5-diCQA have the strongest anti-MI effects in vivo. Therefore, considering all these factors, scutellarin, 3-CQA, A-7-O-G, erigoster B, 3,4-diCDOA (or 4,9-diCDOA) and 4,5-diCQA were selected as drug markers to profile the in vivo behavior of EBI.
Fig. 4. The mean drug plasma concentration–time curves of thirteen compounds after i.v. administration of EBI with high and low dosages. (a)–(m) Represent 5-CQA, 3-CQA, 4-CQA, 4-CDOA, caffeic acid, 1,3-diCQA, scutellarin, 3,4-diCQA, 3,5-diCQA, erigoster B, 3,4-diCDOA (or 4,9-diCDOA), A-7-O-G and 4,5-diCQA, respectively (mean ± SD, n = 6).
The pharmacokinetic parameters of thirteen compounds in rat plasma after intravenous administration of EBI with high and low dosages (mean ± SD, n = 6).
| Analyte | Group | t 1/2 (h) | AUC0–t (h ng mL−1) | Vd (L) | Cl (L h−1) | MRT0–t (h) |
|---|---|---|---|---|---|---|
| 5-CQA | Low | 0.32 ± 0.08 | 172.34 ± 77.29 | 0.16 ± 0.05 | 0.35 ± 0.14 | 0.26 ± 0.08 |
| High | 0.75 ± 0.32 | 943.72 ± 201.44 | 0.29 ± 0.13 | 0.27 ± 0.05 | 0.37 ± 0.04 | |
| 3-CQA | Low | 0.33 ± 0.08 | 166.55 ± 72.23 | 0.15 ± 0.06 | 0.32 ± 0.13 | 0.3 ± 0.08 |
| High | 0.48 ± 0.29 | 846.20 ± 156.52 | 0.17 ± 0.09 | 0.26 ± 0.04 | 0.41 ± 0.04 | |
| 4-CQA | Low | 0.65 ± 0.29 | 202.53 ± 83.05 | 0.26 ± 0.16 | 0.26 ± 0.09 | 0.41 ± 0.14 |
| High | 0.66 ± 0.34 | 873.70 ± 163.41 | 0.24 ± 0.14 | 0.26 ± 0.04 | 0.42 ± 0.05 | |
| 4-CDOA | Low | 0.44 ± 0.09 | 459.32 ± 163.96 | 0.19 ± 0.05 | 0.30 ± 0.12 | 0.42 ± 0.08 |
| High | 0.41 ± 0.12 | 2187.22 ± 293.22 | 0.16 ± 0.06 | 0.26 ± 0.03 | 0.47 ± 0.04 | |
| Caffeic acid | Low | 0.23 ± 0.03 | 75.22 ± 43.75 | 0.16 ± 0.07 | 0.48 ± 0.21 | 0.14 ± 0.04 |
| High | 0.22 ± 0.07 | 392.91 ± 144.63 | 0.13 ± 0.06 | 0.41 ± 0.13 | 0.20 ± 0.07 | |
| 1,3-diCQA | Low | 0.67 ± 0.20 | 55.08 ± 36.85 | 0.23 ± 0.09 | 0.26 ± 0.14 | 0.34 ± 0.17 |
| High | 0.56 ± 0.30 | 232.15 ± 19.59 | 0.21 ± 0.10 | 0.27 ± 0.02 | 0.45 ± 0.12 | |
| Scutellarin | Low | 1.24 ± 0.64 | 1514.18 ± 574.10 | 0.90 ± 0.54 | 0.51 ± 0.20 | 0.39 ± 0.09 |
| High | 2.51 ± 0.95 | 6862.12 ± 989.25 | 1.63 ± 0.65 | 0.45 ± 0.06 | 0.45 ± 0.10 | |
| 3,4-diCQA | Low | 0.53 ± 0.20 | 650.03 ± 236.17 | 0.25 ± 0.11 | 0.34 ± 0.12 | 0.37 ± 0.13 |
| High | 0.46 ± 0.13 | 3259.07 ± 444.77 | 0.18 ± 0.06 | 0.28 ± 0.03 | 0.36 ± 0.02 | |
| 3,5-diCQA | Low | 0.60 ± 0.24 | 482.00 ± 164.95 | 0.14 ± 0.04 | 0.17 ± 0.06 | 0.42 ± 0.16 |
| High | 0.80 ± 0.38 | 1871.50 ± 228.63 | 0.22 ± 0.10 | 0.19 ± 0.02 | 0.48 ± 0.07 | |
| Erigoster B | Low | 4.21 ± 1.50 | 2275.72 ± 597.88 | 1.16 ± 0.72 | 0.18 ± 0.063 | 0.68 ± 0.32 |
| High | 4.16 ± 1.28 | 7484.27 ± 953.92 | 1.37 ± 0.28 | 0.24 ± 0.03 | 0.72 ± 0.17 | |
| 3,4-diCDOA (or 4,9-diCDOA) | Low | 2.50 ± 0.43 | 1570.16 ± 465.15 | 0.93 ± 0.43 | 0.25 ± 0.07 | 0.64 ± 0.18 |
| High | 3.23 ± 1.04 | 4847.40 ± 642.09 | 1.53 ± 0.38 | 0.34 ± 0.04 | 0.44 ± 0.14 | |
| A-7-O-G | Low | 0.26 ± 0.10 | 215.61 ± 119.28 | 0.24 ± 0.08 | 0.70 ± 0.29 | 0.19 ± 0.09 |
| High | 0.66 ± 0.44 | 1422.05 ± 324.88 | 0.35 ± 0.19 | 0.41 ± 0.09 | 0.25 ± 0.07 | |
| 4,5-diCQA | Low | 0.34 ± 0.13 | 582.02 ± 279.04 | 0.26 ± 0.08 | 0.58 ± 0.23 | 0.26 ± 0.12 |
| High | 0.46 ± 0.22 | 2331.32 ± 479.31 | 0.42 ± 0.24 | 0.61 ± 0.11 | 0.40 ± 0.07 | |
| Concentration sum method | Low | 5.86 ± 2.36 | 6524.01 ± 1891.26 | 2.57 ± 1.40 | 0.30 ± 0.08 | 1.20 ± 1.36 |
| High | 6.24 ± 1.32 | 23 900.04 ± 3290.67 | 3.25 ± 0.70 | 0.36 ± 0.05 | 0.59 ± 0.04 | |
| AUC integrated method | Low | 6.63 ± 2.36 | 1716.01 ± 406.14 | 2.16 ± 1.05 | 0.22 ± 0.04 | 1.43 ± 1.72 |
| High | 8.02 ± 2.21 | 5478.38 ± 714.25 | 3.65 ± 0.97 | 0.32 ± 0.04 | 0.66 ± 0.06 |
2.3. Integrated PK study of multiple components of EBI
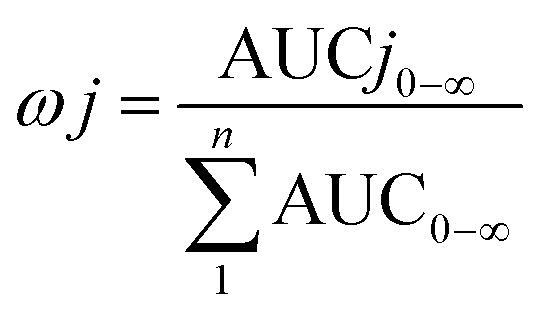
The total concentrations of the markers in rat plasma were calculated by the “plasma drug concentration sum method” and the “AUC weighting integrated method”6,9 at the studied PK time points, respectively. For the plasma drug concentration sum method, the concentration values of all ingredients studied at the same sampling time point were directly summed up, and the summation was then plotted against the each correlative sampling time point to obtain the sum drug-time curve and calculate the PK parameters of the plasma drug concentration sum method. For the AUC weighting integrated method, the weighting coefficient and integrated concentrations are calculated by following equations:
 |
1 |
 |
2 |
| CT = ωC1CC1 + ωC2CC2+ ωC3CC3+ … + ωCnCCn | 3 |
where ω represents the weighting coefficient, j represents each component, n represents the number of components studied, C1–Cn represents the concentration of each components, and CT represents the integrated concentration at T time point, respectively.
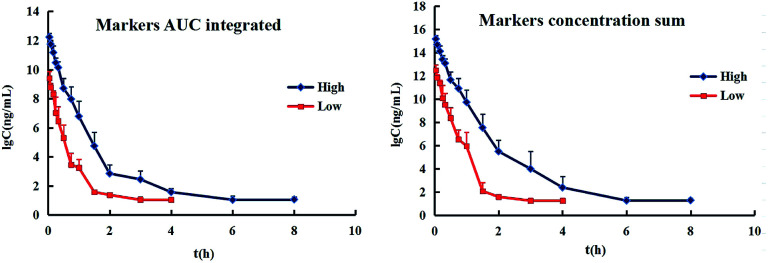
The resulting integrated plasma drug concentration–time curves and PK parameters are shown in Fig. 5 and Table 1, respectively. There are no significant differences for almost all the PK parameters between the plasma drug concentration sum method and AUC weighting integrated method except for AUC0–t. The values of AUC0–t from the plasma drug concentration sum method are higher than those from the AUC weighting integrated method. The AUC weighting integrated method has relatively highlighted the influence of the larger exposure level components on the overall exposure of Chinese medicines, but the plasma drug concentration sum method faithfully reflects the influence of the concentration of each component on the whole at each time point. The parameters obtained by both of the plasma drug concentration sum method and the AUC weight integration method, require further exploration for guiding the design of the clinical drug delivery scheme.
Fig. 5. The integrated drug plasma concentration–time curves of thirteen compounds by the plasma concentration sum and AUC weighing integrated methods after intravenous administration of EBI with high and low dosages (mean ± SD, n = 6).
3. Experimental
3.1. Chemicals and reagents
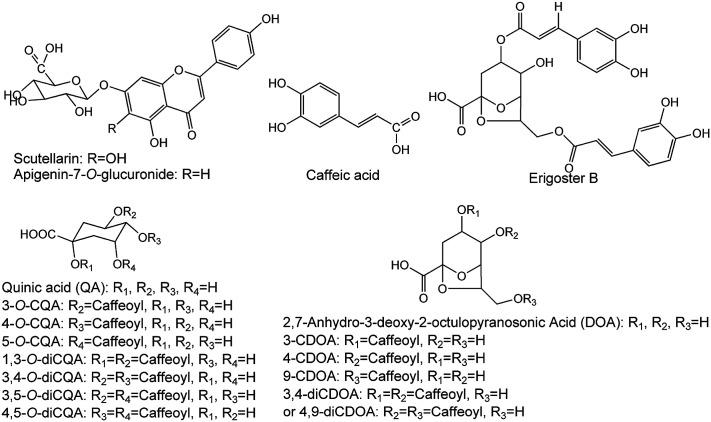
EBIs were offered by Yunnan Biovalley Dengzhanhua Pharmaceutical Co., Ltd. (batch no. 20150246, 20150940, 20160143, 20160347, 20160435 and 20171147), in which the identified compounds are 5-CQA, 3-CQA, 4-CQA, 3-CDOA, 4-CDOA, 9-CDOA, caffeic acid, 1,3-diCQA, scutellarin, 3,4-diCQA, erigoster B, 3,5-diCQA, 3,4-diCDOA (or 4,9-diCDOA), A-7-O-G and 4,5-diCQA,15,17–19 as measured by LC-Q-TOF-MS and LC-MS/MS (Fig. S2, Tables S5 and S6†), and the structure of the fifteen compounds is shown in Fig. 6. The contents of 5-CQA, 3-CQA, 4-CQA, 4-CDOA, caffeic acid, 1,3-diCQA, scutellarin, 3,4-diCQA, 3,5-diCQA, erigoster B, 3,4-diCDOA (or 4,9-diCDOA), A-7-O-G and 4,5-diCQA in EBI were measured by LC-MS/MS, and listed in Table S7.†
Fig. 6. The chemical structure of fifteen compounds in EBI.
Reference compounds, 3-CQA, caffeic acid, 4-CQA, 5-CQA, scutellarin, 1,3-diCQA, 3,4-diCQA, 3,5-diCQA, 4,5-diCQA and A-7-O-G, L-7-O-G (IS) were provided by Shanghai Ronghe Medicine Technology Development Co., Ltd., with a purity of >99%. 4-CDOA, erigeron B, 3,4-diCDOA (or 4,9-diCDOA) were prepared from EBI using preparative HPLC in our laboratory and identified by NMR and MS. The purities of all the compounds were determined to be above 98% by HPLC analysis. Because the content of 3-CDOA and 9-CDOA in EBI was low, we have not prepared enough amount of them to perform quantitative analysis.
Isoprenaline chloride was purchased from Shanghai Yuanye Bio-Technology Co., Ltd. (Shanghai, China). Pentobarbital sodium was obtained from Beijing Sai Bo Run Te Science Technology Development Center (Beijing, China). Physiological saline was obtained from Fuzhou Hai Wang Fu Pharmaceutical Co., Ltd. Propylene glycol was obtained from Jiangxi Yi Pu Sheng Pharmaceutical Co., Ltd. Sodium bicarbonate was obtained from China Pharmaceutical Group Chemical Reagent Co., Ltd.
Acetonitrile and methanol were of chromatographic grade (Sigma, USA). Ultra pure water was purified by the Milli-Q system (Millipore, Bedfoed, MA). Glacial acetic acid was purchased from Sinopharm Chemical Reagent Co., Ltd. (Shanghai, China).
3.2. Experimental animals
The investigation conforms to the Guide for the Care and Use of Laboratory Animals published by the US National Institutes of Health (NIH Publication no. 85-23, revised 1996). The Animal Ethic Review Committee of Fujian Medical University (Fuzhou, China) approved all animal protocols. Male Kunming mice (about 8 weeks old and 20 to 30 g body weight) and Sprague-Dawley rats (200 ± 20 g) were obtained from Laboratory Animal Center of Fujian Medical University (Fuzhou, China) and were housed in mouse cages (29 × 17.8 × 16 cm3) and rat cages (48 × 29 × 18 cm3), respectively, in a unidirectional airflow room under controlled temperature (22 ± 2 °C), relative humidity (40–70%), and a 12 h light/dark cycle. Filtered tap water was available ad libitum. The mice were given commercial mouse food ad libitum. The rats were given commercial rat food ad libitum except for the overnight period before dosing. All animals were acclimated to the facilities and environment for 7 days before the experiments.
3.3. In vivo anti-MI study of main components in EBI in mice
In vivo anti-MI effects of 5-CQA, 3-CQA, 4-CQA, 1,3-diCQA, caffeic acid, scutellarin, 3,4-diCQA, 3,5-diCQA, A-7-O-G and 4,5-diCQA were evaluated by using isoprenaline-induced MI mice models. The mice were randomly allocated into thirteen groups (n = 8). The control and model groups received physiological saline and blank solvent (0.5% NaHCO3 : propylene glycol : normal saline = 17 : 2 : 81) (0.1 mL, i.v.) for 7 days. The remaining eleven groups received EBI, 5-CQA, 3-CQA, 4-CQA, 1,3-diCQA, caffeic acid, scutellarin, 3,4-diCQA, 3,5-diCQA, A-7-O-G and 4,5-diCQA, respectively (30 mg kg−1 dose; i.v.) for 7 days. Administration solutions were prepared with blank solvent (0.5% NaHCO3 : propylene glycol : normal saline = 17 : 2 : 81). All groups, except the control one, were intraperitoneally injected with 5 mg kg−1 of isoprenaline chloride once daily for two successive days (in the 4th and 5th days of treatment).
Thirty min after the injection with isoprenaline chloride in the 5th day and 30 min after the last administration in the 7th day, the mice were anesthetized with pentobarbital sodium (70 mg kg; i.p.) for ECG monitoring with a standard artifact free lead II (right forelimb to left hind limb).6 Needle electrodes were inserted subcutaneously into the limbs of each mouse and connected to an MD3000 bioinformation collector (Huaibei Zhenghua Bioinstrument Co., Ltd., Anhui, China). The elevation of ST segment was measured according to the ECG. After the ECG monitoring in the 7th day, the blood samples were collected from the orbital vein for serum separation and estimation of CK activity. Mice were then sacrificed by cervical vertebra dislocation. Immediately after the sacrifice of the mice, the hearts were treated according to the method reported for sectioning and H&E staining.31 Sections from the left ventricle were examined by light microscopy (Leica DMR, Germany) at 200× magnification.
3.4. Pharmacokinetics study of EBI in rats
3.4.1. Instrument and analytical conditions
Shimadzu LC-MS 8040 (Shimadzu, Japan) was used for LC-MS/MS analysis. Separation was carried out by elution on an Ultimate®XB-C18 column (4.6 × 100 mm, 3.5 μm). The mobile phase consisted of 0.5% acetic acid aqueous solution (A) and acetonitrile (B). The gradient elution was employed as follows: 9–13% B at 0–10 min; 13–22% B at 10–11 min; 22–24.5% B at 11–20 min; 24.5–95% B at 20–21 min; 95–9% at 21–22 min. The flow rate was 0.7 mL min−1. The column temperature was kept at 30 °C and the volume of sample injected was 5 μL. The MS conditions for MS/MS were as follows: block heating temperature, 400 °C; desolvation line temperature, 250 °C; dry gas (nitrogen), 12 mL min−1; and auxiliary gas (nitrogen), 3 mL min−1. MS/MS spectra were obtained for selected precursor ions through collision-induced dissociation with neutral gas (argon) molecules in the collision cell. Quantification was performed using MRM in negative ionization mode by monitoring the fragmentation of m/z 353.00 → 191.00 with collision energy at 18 V for 5-CQA, m/z 353.00 → 191.00 (14 V) for 3-CQA, m/z 353.00 → 173.00 (16 V) for 4-CQA, m/z 381.00 → 161.00 (20 V) for 4-CDOA, m/z 515.00 → 353.00 (20 V) for 1,3-diCQA, m/z 179.00 → 135.00 (18 V) for caffeic acid, m/z 461.00 → 285.00 (16 V) for scutellarin, m/z 515.00 → 173.00 (26 V) for 3,4-diCQA, m/z 515.00 → 353.00 (16 V) for 3,5-diCQA, m/z 445.00 → 269.00 (15 V) for A-7-O-G, m/z 515.00 → 353.00 (20 V) for 4,5-diCQA, and m/z 447.00 → 285.00 (30 V) for IS. Besides, quantification was carried out using SIM in negative ionization mode by monitoring m/z 543.00 for erigoster B and 3,4-diCDOA (or 4,9-diCDOA).
3.4.2. Pharmacokinetic experiment
Rats were randomly allocated into two groups (n = 6). The clinical dosage of EBI is 20–40 mL each time, and 1–2 times a day. The clinical equivalent dose of rats is 6.3 times that of human beings, whose average body weight is usually 70 kg. Thus, the maximum dosage of EBI is 7.2 mL kg−1 with i.v. administration to rats. In the present study, 7.2 mL kg−1, and five times of that, 36 mL kg−1 of EBI, were chosen. Considering the volume of administration suitable for rats, each group received a single i.v. administration of 10 times concentrated EBI (containing 336.57 μg mL−1 of 5-CQA, 292.47 μg mL−1 of 3-CQA, 298.56 μg mL−1 of 4-CQA, 773.42 μg mL−1 of 4-CDOA, 199.42 μg mL−1 of caffeic acid, 87.79 μg mL−1 of 1,3-diCQA, 4174.04 μg mL−1 of scutellarin, 1208.38 μg mL−1 of 3,4-diCQA, 490.91 μg mL−1 of 3,5-diCQA, 2374.21 μg mL−1 of erigoster B, 2231.48 μg mL−1 of 3,4-diCDOA (or 4,9-diCDOA), 778.34 μg mL−1 of A-7-O-G and 1878.61 μg mL−1 of 4,5-diCQA) via the tail vein at a dose of 0.72 mL kg−1 and 3.6 mL kg−1, respectively. After administration, the rat tail was carefully cleaned with alcohol soaked cotton balls around the injection site to remove the residual drug. Blood was collected from the cut-tail before dosing and at the following time points: 2.5, 5, 10, 15, 20, 30, 45 min, and 1, 1.5, 2, 3, 4, 6, 8, 12, and 24 h after dosing. After sampling at the 2 h time point, each rat was supplemented 2 mL of physiological saline via intraperitoneal injection. Plasma was isolated from the blood samples by centrifugation and then stored at −20 °C until analysis.
3.4.3. Plasma sample preparation
For LC-MS/MS analysis, stored samples were allowed to thaw at ambient temperature, followed by shaking for 30 s via a vortex apparatus. Plasma (100 μL) was removed and transferred to an appropriately labeled polypropylene tube (1.5 mL) containing 10 μL of internal standard solution (10 μg mL−1 L-7-O-G) and methanol (300 μL), followed by shaking for 3 min using a vortex apparatus. The samples were centrifuged (12 000 rpm, 4 °C, 10 min) and 5 μL of clear supernatant was injected into LC-MS system for bioanalysis by a validated LC-MS/MS method.
3.4.4. Method validation
The LC-MS/MS method was validated by linearity, LOD, LOQ, precision, accuracy, extraction recovery, matrix effect and stability of 13 components in rat plasma. Calibration curves were plotted using weighted linear regression of the ratio of analyte and IS peak areas against the corresponding nominal concentration of the analyte. LOD was defined as the detectable concentration at which the ratio of signal to noise was more than 3 (S/N > 3). LOQ was defined as the detectable concentration at which the ratio of signal to noise more than 10 (S/N > 10). Intra- and inter-day accuracy and precision were assessed by detecting QC samples using five replicates of rat samples at three concentration levels for 5-CQA, 3-CQA, 4-CQA, 1,3-diCQA, caffeic acid, scutellarin, erigoster B, 3,4-diCDOA (or 4, 9-diCDOA), A-7-O-G, 4,5-diCQA (30, 400 and 4000 ng mL−1) and 4-CDOA, 3,4-diCQA, 3,5-diCQA (60, 800 and 8000 ng mL−1) on one or three validation days, respectively. Accuracy and precision were expressed by RE and RSD, respectively. The extraction recovery and matrix effect of thirteen components at above-mentioned three concentration levels were determined. Stability of thirteen components were assessed under the condition of placing extracted plasma samples in auto-sampler for 12 h, as well as placing plasma samples at 4 °C for 12 h, in freeze–thaw three cycles, and at −80 °C for 30 days.
3.5. Data processing
Noncompartmental pharmacokinetic parameters were calculated by DAS 3.0 software (Chinese Pharmacologic Society, Beijing, China). All the results are expressed as mean ± SD. A single-tailed Student's t test was performed in the work.
4. Conclusions
In this paper, the protective effects of ten components on isoprenaline-induced MI in mice have confirmed that scutellarin, 3-CQA, A-7-O-G and 4,5-diCQA were the main anti-MI substances. Besides, the quantitative analysis method of 13 components in rat plasma by LC-ESI-MS/MS was established and applied to multicomponent pharmacokinetic study of EBI in rats, and the systematic exposure level of scutellarin, erigoster B, 3,4-diCDOA (or 4,9-diCDOA), A-7-O-G, and 4,5-diCQA is relatively high. Considering the anti-MI effect and PK characteristics, pharmacokinetic markers were selected and the whole in vivo process of EBI was characterized by integrating pharmacokinetic parameters. This study could improve the safety and rationality of the clinical use of EBI, and provide ideas and references for the integrated PK study on anti-MI TCM injections by combination of multicomponent PK and anti-MI effects.
Conflicts of interest
There are no conflicts to declare.
Supplementary Material
Acknowledgments
The authors gratefully acknowledge the financial supports of the National Nature Science Foundation of China (81303298), the Natural Science Foundation of Fujian Province (2018J01596), Social Development Guiding Programs of Fujian Province of China (2017Y0042), Joint Funds for the Innovation of Science and Technology, Fujian Province (grant number: 2017Y9123), and the Program for New Century Excellent Talents in Fujian Province University (2018).
Electronic supplementary information (ESI) available. See DOI: 10.1039/c9ra03917a
References
- Luo J. Shang Q. Han M. Chen K. Xu H. Am. J. Chin. Med. 2014;42:37–59. doi: 10.1142/S0192415X14500037. [DOI] [PubMed] [Google Scholar]
- Han W. He E. Cao J. Zhongguo Zhongyao Zazhi. 2012;37:2498–2500. [PubMed] [Google Scholar]
- Annual Reports of China's National Adverse Reaction Monitoring (2015), 2016, http://samr.cfda.gov.cn/WS01/CL0844/158940.html, accessed 23 May 2019
- Shi P. Lin X. Yao H. Drug Metab. Rev. 2018;50:161–192. doi: 10.1080/03602532.2017.1417424. [DOI] [PubMed] [Google Scholar]
- Li X. Y. Hao H. P. Wang G. J. Sun J. G. Liang Y. Xie L. Zheng Y. T. Yan B. Chin. J. Nat. Med. 2008;6:377–381. doi: 10.3724/SP.J.1009.2008.00377. [DOI] [Google Scholar]
- Yao H. Shi P. Y. Huang X. M. Shen Z. H. Su Y. Yang C. L. Zhu M. L. Huang L. Y. Liu A. L. Lin X. H. RSC Adv. 2017;7:13570–13583. doi: 10.1039/C7RA00001D. [DOI] [Google Scholar]
- Dong L. C. Zhang X. H. Ma J. Luo N. Song W. Li P. Li H. J. J. Ethnopharmacol. 2014;157:69–78. doi: 10.1016/j.jep.2014.09.021. [DOI] [PubMed] [Google Scholar]
- Xiong F. Wang H. Jiang Z. Z. Huo M. R. Yan C. Y. Zheng C. L. Gu N. J. Ethnopharmacol. 2015;163:290–296. doi: 10.1016/j.jep.2014.12.067. [DOI] [PubMed] [Google Scholar]
- Qian P. Zhang Y. B. Yang Y. F. Xu W. Yang X. W. Molecules. 2017;22:214. doi: 10.3390/molecules22020214. [DOI] [PMC free article] [PubMed] [Google Scholar]
- Mao L. Pan T. Chin. J. Integr. Med. 2010;8:1492–1493. [Google Scholar]
- Wang L. Li S. Chin. J. Integr. Med. 2009;7:52–54. [Google Scholar]
- Shang Y. H. Tian J. F. Hou M. Xu X. Y. Chin. J. Nat. Med. 2013;11:588–595. doi: 10.3724/SP.J.1009.2013.00588. [DOI] [PubMed] [Google Scholar]
- Wang J. Zhang L. Liu B. Wang Q. Chen Y. Wang Z. Zhou J. Xiao W. Zheng C. Wang Y. J. Ethnopharmacol. 2018;224:429–440. doi: 10.1016/j.jep.2018.05.022. [DOI] [PubMed] [Google Scholar]
- Liao S. G. Zhang L. J. Li C. B. Lan Y. Y. Wang A. M. Huang Y. Zhen L. Fu X. Z. Zhou W. Qi X. L. Guan Z. Z. Wang Y. L. Rapid Commun. Mass Spectrom. 2010;24:2533–2541. doi: 10.1002/rcm.4662. [DOI] [PubMed] [Google Scholar]
- Zhang Y. F. Shi P. Y. Qu H. B. Cheng Y. Y. Rapid Commun. Mass Spectrom. 2007;21:2971–2984. doi: 10.1002/rcm.3166. [DOI] [PubMed] [Google Scholar]
- Wang L. W. Li H. J. Li P. Wei Y. J. Tang D. Yi L. Qian Z. M. Chromatographia. 2007;66:395–399. doi: 10.1365/s10337-007-0320-9. [DOI] [Google Scholar]
- Wang Y. F. Hu L. M. Liu Y. N. Pan X. P. Pan G. X. Chang Y. X. Gao X. M. Chromatographia. 2010;71:845–853. doi: 10.1365/s10337-010-1540-y. [DOI] [Google Scholar]
- Zhang Y. F. Zhao Q. Q. Ma J. F. Wu B. Zeng X. Chromatographia. 2010;72:651–658. doi: 10.1365/s10337-010-1703-x. [DOI] [Google Scholar]
- Zhou L. Ju W. Z. Li C. Y. Xie L. Y. Xu J. Liu S. J. Tan H. S. Instrum. Sci. Technol. 2012;40:316–326. doi: 10.1080/10739149.2012.673195. [DOI] [Google Scholar]
- Huang K. W. Guo J. W. Chen J. M. Qiu G. Q. Deng Z. J. Li L. M. Fu Y. H. Zhongyaocai. 2010;33:1592–1595. [PubMed] [Google Scholar]
- Wang F. J. Xie Y. M. Liao X. Jia M. Zhongguo Zhongyao Zazhi. 2015;40:3298–3307. [PubMed] [Google Scholar]
- Wang J. Xie Y. M. Zhao S. T. Zhang J. S. Chai Y. Li Y. Y. Liao X. Medicine. 2017;96:32. doi: 10.1097/MD.0000000000007674. [DOI] [PMC free article] [PubMed] [Google Scholar]
- Li J. G. Wang L. Q. Yang X. Y. Chen Z. Lai L. Y. W. Xu H. Liu J. P. Complement. Ther. Med. 2017;34:74–85. doi: 10.1016/j.ctim.2017.08.004. [DOI] [PubMed] [Google Scholar]
- Tian Y. Li Q. Zhou X. Pang Q. Xu Y. J. Chromatogr. B: Anal. Technol. Biomed. Life Sci. 2017;1046:1–12. doi: 10.1016/j.jchromb.2017.01.020. [DOI] [PubMed] [Google Scholar]
- Dai G. L. Ma S. T. Sun B. T. Gong T. Liu S. J. Li C. Y. Ju W. Z. Anal. Methods. 2015;7:3587–3592. doi: 10.1039/C4AY02968B. [DOI] [Google Scholar]
- Levis J. T. Perm. J. 2015;19:79. doi: 10.7812/TPP/14-243. [DOI] [PMC free article] [PubMed] [Google Scholar]
- Akila P. Asaikumar L. Vennila L. Biomed. Pharmacother. 2017;85:582–591. doi: 10.1016/j.biopha.2016.11.067. [DOI] [PubMed] [Google Scholar]
- Akila P. Vennila L. Biomed. Pharmacother. 2016;84:208–214. doi: 10.1016/j.biopha.2016.09.028. [DOI] [PubMed] [Google Scholar]
- Huang H. Geng Q. Yao H. Shen Z. Wu Z. Miao X. Shi P. Iran. J. Basic Med. Sci. 2018;21:267–276. doi: 10.22038/ijbms.2018.26110.6415. [DOI] [PMC free article] [PubMed] [Google Scholar]
- Gao J. Chen G. He H. Liu C. Xiong X. Li J. Wang J. Front. Pharmacol. 2017;8:289. doi: 10.3389/fphar.2017.00289. [DOI] [PMC free article] [PubMed] [Google Scholar]
- Tang Y. N. He X. C. Ye M. Huang H. Chen H. L. Peng W. L. Zhao Z. Z. Yi T. Chen H. B. J. Ethnopharmacol. 2015;175:451–455. doi: 10.1016/j.jep.2015.10.004. [DOI] [PubMed] [Google Scholar]
Associated Data
This section collects any data citations, data availability statements, or supplementary materials included in this article.


