Abstract
The eukaryotic plasma membrane (PM) exhibits lipid mixing heterogeneities known as lipid rafts. These lipid rafts, the result of liquid-liquid phase separation, can be modeled by coexisting liquid ordered (Lo) and liquid disordered (Ld) domains. Four-lipid component systems with a high-melting lipid, a nanodomain-inducing low-melting lipid, a macrodomain-inducing low-melting lipid, and cholesterol (chol) can give rise to domains of different sizes. These four-component systems have been characterized in experiments, yet there are few studies that model the asymmetric distribution of lipids actually found in the PM. We used molecular dynamics (MD) simulations to analyze the transition from nanoscopic to macroscopic domains in symmetric and in asymmetric model membranes. Using coarse-grained MD simulations, we found that asymmetry promotes macroscopic domain growth in a case where symmetric systems exhibit nanoscopic domains. Also, macroscopic domain formation in symmetric systems is highly dependent on registration of like phases in the cytoplasmic and exoplasmic leaflets. Using united-atom MD simulations, we found that symmetric Lo domains are only slightly more ordered than asymmetric Lo domains. We also found that large Lo domains in our asymmetric systems induce a slight chain ordering in the apposed cytoplasmic regions. The chol fractions of phase-separated Lo and Ld domains of the exoplasmic leaflet were unchanged whether the system was symmetric or asymmetric.
Keywords: Raft, Asymmetry, Lipid domain, Phase separation, Coarse grained, United atom
1. Introduction
The eukaryotic plasma membrane (PM) is a heterogeneous, two-dimensional liquid that exhibits complex organization. (Simons and Vaz, 2004) Lipid rafts (Brown and London, 1998; Lingwood and Simons, 2010; Simons and Ikonen, 1997) are nanoscopic mixing heterogeneities that are thought to play an important role in cellular signaling (Simons and Ikonen, 1997; Simons and Gerl, 2010), protein sequestration (Simons and Ikonen, 1997; Simons and Gerl, 2010), virus budding (Simons and Vaz, 2004; Aude de Gassart et al., 2003), immune signaling (Simons and Gerl, 2010; Goh et al., 2013), membrane trafficking (Simons and Ikonen, 1997; Simons and Gerl, 2010), and endocytosis (Goh et al., 2013). Rafts, envisioned as areas with distinct physical properties compared to their surroundings, are thought to be enriched in cholesterol (chol) and saturated, high-melting temperature (high-Tm) lipids. (Lingwood and Simons, 2010; Simons and Ikonen, 1997; Goh et al., 2013; Brown and Rose, 1992) In model membranes, rafts can be represented by a liquid ordered (Lo) phase, a liquid phase with a high degree of order akin to that of a solid. If the raft is the discontinuous phase, then the continuous phase can be modeled by a liquid disordered (Ld) phase, which has the physical characteristics of a liquid and is enriched in unsaturated, low-melting temperature (low-Tm) lipids. Model membranes composed of just three lipid components - a high-Tm lipid, a low-Tm lipid, and chol - can give rise to a membrane with coexisting Lo and Ld phases.
These three-component model membranes can exhibit nanoscopic Lo and Ld domains (nanodomains, found to be ~15–30 nm diameter from neutron scattering data (Heberle et al., 2013)) or macroscopic Lo and Ld domains (macrodomains, visible diameter > ~200 nm). (Goh et al., 2013; Van Meer et al., 2009; Ackerman and Feigenson, 2015; Hakobyan and Heuer, 2013). For example, a mixture (termed Type I) (Van Meer et al., 2009) of high-Tm lipid distearoylphosphatidylcholine (DSPC, 18:0,18:0-phosphatidylcholine), low-Tm lipid palmitoyl-oleoylpho sphatidylcholine (POPC, 16:0,18:1-PC), and chol can form nanodomains. Likewise, a mixture (termed Type II) (Van Meer et al., 2009) of high-Tm lipid dipalmitoylphosphatidylcholine (DPPC, 16:0, 16:0-PC), low-Tm lipid dioleoylphosphatidylcholine (DOPC, 18:1, 18:1-PC), and chol can form macrodomains. The low-Tm lipid strongly affects whether nano or macro domains are formed. (Ackerman and Feigenson, 2015) A transition between nanodomains and macrodomains can be modeled, as we do here, by a four-component system in which the low-Tm lipids are systematically varied (Ackerman and Feigenson, 2015).
Beginning with a Type I mixture composed of DBPC (20:0,20:0-PC)/PIPC (16:0,18:2-PC)/chol and systematically replacing PIPC with DIPC (18:2,18:2-PC), a Type II mixture forms when the DIPC fraction is sufficient. This replacement of low-Tm lipid thereby produces a transition from nanodomains to macrodomains. In these four-component systems, a replacement ratio, ρ, may be defined as [DIPC]/[DIPC + PIPC]. With a system composed of DBPC/DIPC + POPC/chol and incrementally varying ρ values from 0 (only PIPC) to 1 (only DIPC), the system begins as a Type I mixture and ends as a Type II mixture. Such studies with four-component systems have successfully modeled the transition from nanodomains to macrodomains for many mixtures. (Goh et al., 2013; Ackerman and Feigenson, 2015; Konyakhina et al., 2013; Usery et al., 2017; Ackerman and Feigenson, 2016) To date, all such studies were performed on symmetric bilayers, i.e. lacking the asymmetry of eukaryotic plasma membranes.
It has long been known that the PM exhibits transmembrane phospholipid compositional asymmetry. (Van Meer et al., 2009; Kiessling et al., 2009; Ackerman and Feigenson, 2016; Kiessling et al., 2009; Quinn, 2002; Devaux and Morris, 2004; Op den Kamp, 1979) The exoplasmic leaflet is enriched in high melting sphingomyelin and low-melting glycerophospholipids, such has phosphatidylcholine, whereas the cytoplasmic leaflet is enriched in phosphatidylethanolamines and phosphatidylserines having multiply unsaturated chains (Van Meer et al., 2009; Kiessling et al., 2009; Quinn, 2002; Devaux and Morris, 2004). Asymmetry is maintained by active translocation of amine-containing phospholipids across the PM, together with the slow unfacilitated movement of phospholipids across the bilayer (Quinn, 2002). The existence of lipid asymmetry across the PM could have many effects on cellular function. Asymmetry is connected to roles of membrane bound proteins, wherein the cytoplasmic leaflet contains proteins involved in intracellular events while the exoplasmic leaflet contains proteins involved in cellular signaling and defense mechanisms. Op den Kamp, 1979)A loss of asymmetry is related to cellular aging (Schroeder, 1984) and cell apoptosis (Quinn, 2002; Harayama and Riezman, 2018; Fadeel and Xue, 2009). Ultimately, a more faithful model of the PM must include an asymmetric distribution of lipid types across the membrane, as well as any coupling between the leaflets.
Preparation of asymmetric lipid bilayers has been reported in vitro using oil-water inverted emulsion (Pautot et al., 2003a, b), cyclodextrin-mediated exchange (Visco et al., 2014; Lin and London, 2014; Huang and London, 2013; Szente and Fenyvesi, 2017; Zidovetzki and Levitan, 2007), and hemifusion (Enoki and Feigenson, 2019) of a supported bilayer with a GUV. Some of these preparations pose problems that should be noted. Inverted emulsions lead to some oil trapped within the bilayer (Gross et al., 2011). In addition, the popular cyclodextrin-mediated exchange has challenges. Exchange is highly dependent upon the cavity size of the cyclodextrin (Szente and Fenyvesi, 2017) and fluorescent-labeled lipids can be poorly solubilized by MβCD, a commonly used type of cyclodextrin. (Lin and London, 2014) MβCD and other types of cyclodextrin can change the natural levels of cholesterol in the PM, ultimately affecting all intracellular membranes. Zidovetzki and Levitan, 2007) And final exchange levels are typically in the range 50–70 %, not so close to the desired 100 %.(Doktorova et al., 2018)
In silico studies provide an opportunity to study asymmetric lipid bilayers and compare results with those found by wet lab study of asymmetric GUVs. The effectiveness of in silico studies is well documented. (Goh et al., 2013; Ackerman and Feigenson, 2015; Hakobyan and Heuer, 2013; Ingólfsson et al., 2014; Feller, 2000) Stable, asymmetric bilayers are far easier to prepare in silico than with in vitro techniques. Molecular Dynamics (MD) simulations are particularly useful for modeling asymmetric, multi-component bilayer mixtures. Unfortunately, MD systems have a trade-off between molecular high-resolution and long computational run time. United Atom (UA) force fields, in which every atom except for nonpolar hydrogens is represented, have a high degree of accuracy, but lateral separation and the creation of phases will almost never be seen due to the long run time required. Coarse Grained (CG) force fields, in which a bead represents about 4 heavy (non-hydrogen) atoms, are computationally quicker to run but have lower accuracy. Combination of the two forcefields solves some of these problems. By beginning with a CG system, running until natural phase separation occurs, and then converting the output to a UA system, separate phases can be naturally created and then analyzed under high-resolution conditions.
In this study, we combined CG and UA to study a transition from nano to macro domains in symmetric and asymmetric bilayers. To our knowledge, this study is the first of its kind. We separately created four-component symmetric bilayers and six-component asymmetric bilayers. Symmetric four-component bilayers were composed of the high-Tm lipid DBPC, the low-Tm lipids DIPC and PIPC, and chol. PIPC was chosen because it promotes nanoscopic phase domains when mixed with DBPC and chol. DIPC was chosen because it promotes the larger macroscopic phase-separated domains when mixed with DBPC and chol. The asymmetric bilayer’s exoplasmic leaflet was exactly the same as that of the symmetric bilayers. The symmetric bilayers and asymmetric exoplasmic leaflets were made with [DBPC]/[PIPC + DIPC]/[chol] = .4/.4/.2. We define a replacement ratio as ρ = [DIPC]/[PIPC + DIPC]. The asymmetric bilayer’s cytoplasmic leaflet was composed of POPE (16:0,18:1-PE), POPS (16:0,18:1-PS), and chol, with [POPE]/[POPS]/[chol] = .4/.4/.2. ρ was increased incrementally in steps of 0.1 starting at 0 (nanodomains) and ending at 1 (macrodomains). Bilayers were run using CG forcefield parameters until lateral phase separation occurred. Then all bilayers were converted into UA force field parameters and further run until equilibrated.
2. Materials and methods
The following sections describe the methods used for bilayer creation, production, and data analysis.
2.1. Symmetric bilayer creation
Symmetric bilayers were fully solvated four-lipid component systems of DBPC, PIPC, DIPC, and chol. Bilayer cross sections were square patches approximately 36 nm × 36 nm, with ~4200 total lipids. This box size was sufficient to capture without distortion the properties of nanodomains of size scale ~ 25 nm diameter, as we showed using a 74 nm × 74 nm simulation box (Usery et al., 2017). Bilayers were solvated at ~60 water molecules per lipid and with no ions. Lipid compositions were [DBPC]/[PIPC + DIPC]/[chol] = .4/.4/.2 with eleven different ρ conditions, ranging from ρ = 0 to ρ = 1 in increments of 0.1. Chol concentration was kept at 20 mol % in order to compare these systems with others (Ackerman and Feigenson, 2015), despite evidence that PM chol concentration is 30–40 mol % (Devaux and Morris, 2004; Mondal et al., 2008).All symmetric bilayers were created in CHARMMGUI (Sunhwan et al., 2008; Qi et al., 2015).
2.2. Asymmetric bilayer creation
Our asymmetric bilayers were six-component systems of DBPC, PIPC, DIPC, POPE, POPS, and chol. The exoplasmic leaflet was that of the symmetric bilayers, with a lipid composition of DBPC/[PIPC + DIPC]/chol = .4/.4/.2. Bilayers were solvated with ~60 water molecules per lipid and ~900 neutralizing sodium ions. The cytoplasmic leaflet had a uniform composition of POPE/POPS/chol = .4/.4/.2. POPE and POPS were chosen for future comparison with wet-lab experiments, despite evidence that the cytoplasmic PM leaflet is enriched in polyunsaturated phosphatidylethanolamine (PE) and phosphatidylserine (PS) (Verkleij et al., 1973). Cytoplasmic and exoplasmic leaflets were given the same chol concentration because the distribution of chol between leaflet is not well understood (Devaux and Morris, 2004; Mondal et al., 2008) Eleven different ρ conditions were made, ranging from ρ = 0 to ρ = 1 in increments of 0.1.
Each ρ condition was constructed such that the equilibrated area of the exoplasmic leaflet equaled that of the cytoplasmic leaflet. To do this, a symmetric CG POPE/POPS/chol bilayer was created with the same 0.4/.4/.2 lipid composition and run until equilibrated. Then area per lipid of this POPE/POPS/chol system was calculated. Independently, the area per lipid was also calculated for each ρ condition of the symmetric bilayers after equilibration. Then, each asymmetric bilayer condition was created by using the area per lipid to calculate the number of lipids needed in exoplasmic and cytoplasmic leaflets to achieve a square patch of 36 nm × 36 nm. The number of lipids needed for each leaflet was entered into CHARMMGUI to create the bilayers. Additional criteria for creating MD models of asymmetric bilayers, such as ensuring the tension in each leaflet is zero, have been proposed. (Doktorova and Weinstein, 2018)
2.3. Force field and molecule parameters
All of our MD simulations used GROMACS 5.1.3. (Abraham et al., 2015) CG simulations used the Martini force field with all beads having equivalent masses (Marrink et al., 2004, 2007; Melo et al., 2015). Lipid, chol, and water parameters were from Martini version 2.0 (Marrink et al., 2007), while ions were from Martini version 2.2 (De Jong et al., 2013).
UA simulations used GROMOS 53a6 (Oostenbrink et al., 2004) force field with added Berger Lipid Parameters (Berger et al., 1997). DIPC (Hakobyan and Heuer, 2013), PIPC (Ackerman and Feigenson, 2015), POPE (Tieleman and Berendsen, 1996), POPS (Mukhopadhyay et al., 2004), and chol (Hakobyan and Heuer, 2013) were taken from existing topologies. DBPC lipid topology was created by extending the sn-1 and sn-2 chains of an already existing DPPC topology. (Berger et al., 1997; Tieleman and Berendsen, 1996) The SPC model for water was used (Berendsen et al., 1981).
2.4. Simulation conditions
All CG simulations were energy minimized and then subsequently equilibrated for 4.75 ns, over multiple stages with a gradually increasing time step parameter, using the provided CHARMM-GUI equilibration template. The CHARMM-GUI equilibration template begins with an NVT ensemble and transitions to NPT. Following the CHARMM-GUI equilibration, all CG simulations were run in an NPT ensemble with a timestep of 20 fs. A V-rescale temperature thermostat was used with a time constant of 1 ps to ensure a reference temperature of 295 K. (Bussi et al. (2007)) The lipids and the solute were separately coupled to temperature baths. A Parrinello-Rahman semi-isotropic barostat was used with a time constant of 1 ps to maintain a pressure of 1 atm (Parrinello and Rahman, 1981). Electrostatic and van der Waals potentials both used a potential shift with a 1.2 nm cutoff distance. All simulations were run past equilibrium for a total production time of 12 μs.
After completion of CG simulations, bilayers were converted to UA representation using Backward. (Wassenaar et al., 2014) The conversion process involved energy minimization steps along with an equilibration of 1.75 ps at increasing time steps. Equilibration steps occurred in an NVT ensemble at 295 K with position restraints on the phosphorous of each lipid.
After conversion to UA representation, bilayers ran in an NPT ensemble with a 1 fs time step. A V-rescale temperature thermostat was used with a time constant of 0.5 ps to maintain a temperature of 300 K following Ackerman and Feigenson in 2016 and Kiessling, et al. in 2009. (Ackerman and Feigenson, 2015; Hakobyan and Heuer, 2013) Lipids and solute were separately coupled to temperature baths. A Parrinello-Rahman semi-isotropic barostat with a time constant of 2 ps was used to maintain a pressure of 1 atm. Electrostatic and van der Waals interactions both used a potential shift with a 1.2 nm cutoff distance. A Particle Mesh Ewald method was used for electrostatics with a Fourier grid spacing of 0.16 and a cubic interpolation order of 4 (Darden et al., 1993; Essmann et al., 1995). The first 50 ns of simulation were run with position restraints on the phosphorus of each lipid, and then position restraints were subsequently removed for the last ~30 ns of the simulations. All simulations were run past equilibration for a total production time of 30–33 ns. LINCS algorithm was used for bond constraints, and XYZ periodic boundary conditions were enforced (Hess et al., 1997, 2008).
2.5. United atom backwards mapping
In the conversion from CG to UA using Backward, membranes were first separated from the water solvent. The solvent-free membranes were then converted using the Backward program. Occasionally, lipid penetration of the cholesterol rings or steric overlap would appear during the conversion process. If the latter, molecular positions were manually altered to avoid steric overlap. If cholesterol ring penetration by lipids occurred, either the penetrated cholesterol or the penetrating lipid was deleted. To preserve equal area of upper and lower leaflets, a randomly chosen lipid, in the opposite leaflet from where the deletion occurred, was removed. In symmetric bilayers, this meant randomly deleting the same lipid type in the opposite bilayer. In the asymmetric bilayers, sometimes multiple lipids had to be deleted to preserve equal area. Ultimately, deletions and/or manual alterations of position occurred rarely, in ~ 0.1 % of all lipids. UA simulations were run substantially past equilibration to nullify potential effects of deletions and/or manual alterations.
After conversion of membrane from CG to UA, bilayers were resolvated using the SPC model for water. The necessary number of ions was added to converted systems.
2.6. Phase determination algorithm
Simulations were analyzed using self-made Python scripts which employ the MDTraj (McGibbon et al., 2015) Library found here https://github.com/nav610/Asymmetric-Membrane-Code. The script divides the exoplasmic leaflet into Voronoi cells, with each lipid being represented as the center of the cell. The phosphate bead for phospholipids and the hydroxyl bead for cholesterol were used to represent each lipid. Then each lipid is categorized as Lo or Ld based upon the lipid types in the bordering Voronoi cells. If a patch of lipids has an above average make-up of high-Tm lipid and cholesterol it is designated Lo. If not, it is designated Ld. The script iterates three times to remove small, artificial clusters. Boundary lipids are thus determined as lipids of one phase type that border a lipid of another phase type. The number of boundary lipids is summed and divided by the total number of lipids, producing the percentage of lipids which reside on an interface between two phases.
The phase determination algorithm was based on local composition, rather than physical properties such as area per lipid or order parameter. Our composition-based method inherently includes a local averaging component due to inclusion of a lipid’s nearest neighbors, recognizing that domains are not completely homogeneous at the scale of an individual lipid. As shown in Supplemental Figs. 6 and 7, the distribution of area per lipid for Lo-identified and Ld-identified lipids overlaps significantly in both symmetric and asymmetric systems, even while it is clear that the phases have mean areas that differ by over 0.2 nm2. Identifying phases by area per lipid directly is challenging, due to this overlap, heterogeneity within a single phase, and the fact that different lipid types have different areas in the same phase, due to varying head groups and the size of cholesterol molecules. Thus, area per lipid was not used for Lo and Ld phase determination algorithm. Likewise, order parameter of the acyl chains was not used, as order parameter and area per lipid are directly correlated.
2.7. Registration determination algorithm
Registration is a measurement of the fraction of lipids of one phase having neighbors of the same phase in the opposite leaflet. We measure registration as the percentage of lipids which have like-phase neighbors in the opposite leaflet. This percentage was calculated using the phase-determination algorithm described in 2.6. Once each exoplasmic lipid was assigned a phase, its phase was compared to the phase of the all the lipids within a 1 nm radius residing in the cytoplasmic leaflet. If the phases do not match, the lipid was marked anti-registered. If the phases were the same, the lipid was marked registered. The number of registered exoplasmic leaflet lipids was divided by the total number of exoplasmic leaflet lipids to produce a percentage.
2.8. Equilibration and data analysis
CG systems were determined to be equilibrated when the percentage of exoplasmic lipids on the interface displayed asymptotic behavior, which was after roughly 7 μs of production. Data were taken after 10 μs. UA systems were determined to be sufficiently equilibrated when the order parameter of DBPC and POPE displayed asymptotic behavior, which was after roughly 12 ns of production. Figure S8 shows that DBPC carbons 6 and 9 order parameters hardly change throughout the initial 15 ns of the simulation. Data were taken after 15 ns.
Standard error was calculated by finding time autocorrelation lengths for each CG and UA property. Since each property and ρ condition exhibited different time-autocorrelation lengths, each property’s and ρ condition’s own time autocorrelation length was used to calculate error.
3. Results and discussion
The following sections describe the CG and then UA results.
3.1. Percentage of lipids on the interface
We used the phase determination algorithm detailed in section 2.6 to calculate the percentage of lipids on the interface. Fig. 1 shows the percentage of lipids on the interface versus the ρ value for both symmetric and asymmetric systems. For both systems, as ρ increases from 0 to 1 the percentage of interface lipids decreases. As ρ increases, PIPC (18:0,18:2) is being replaced by DIPC (18:2,18:2) and thus more unsaturation is being added to the system. This leads to more differentiated Lo and Ld phases forming larger domains. This transition in domain size is seen in Fig. 1 as the decreasing percentage of lipids on the interface. As domains become larger, the number of lipids on the boundary between phases decreases. The growth of phase domains is visualized in Fig. 2, which shows snapshots of some symmetric and asymmetric bilayers at different ρ values.
Fig. 1.
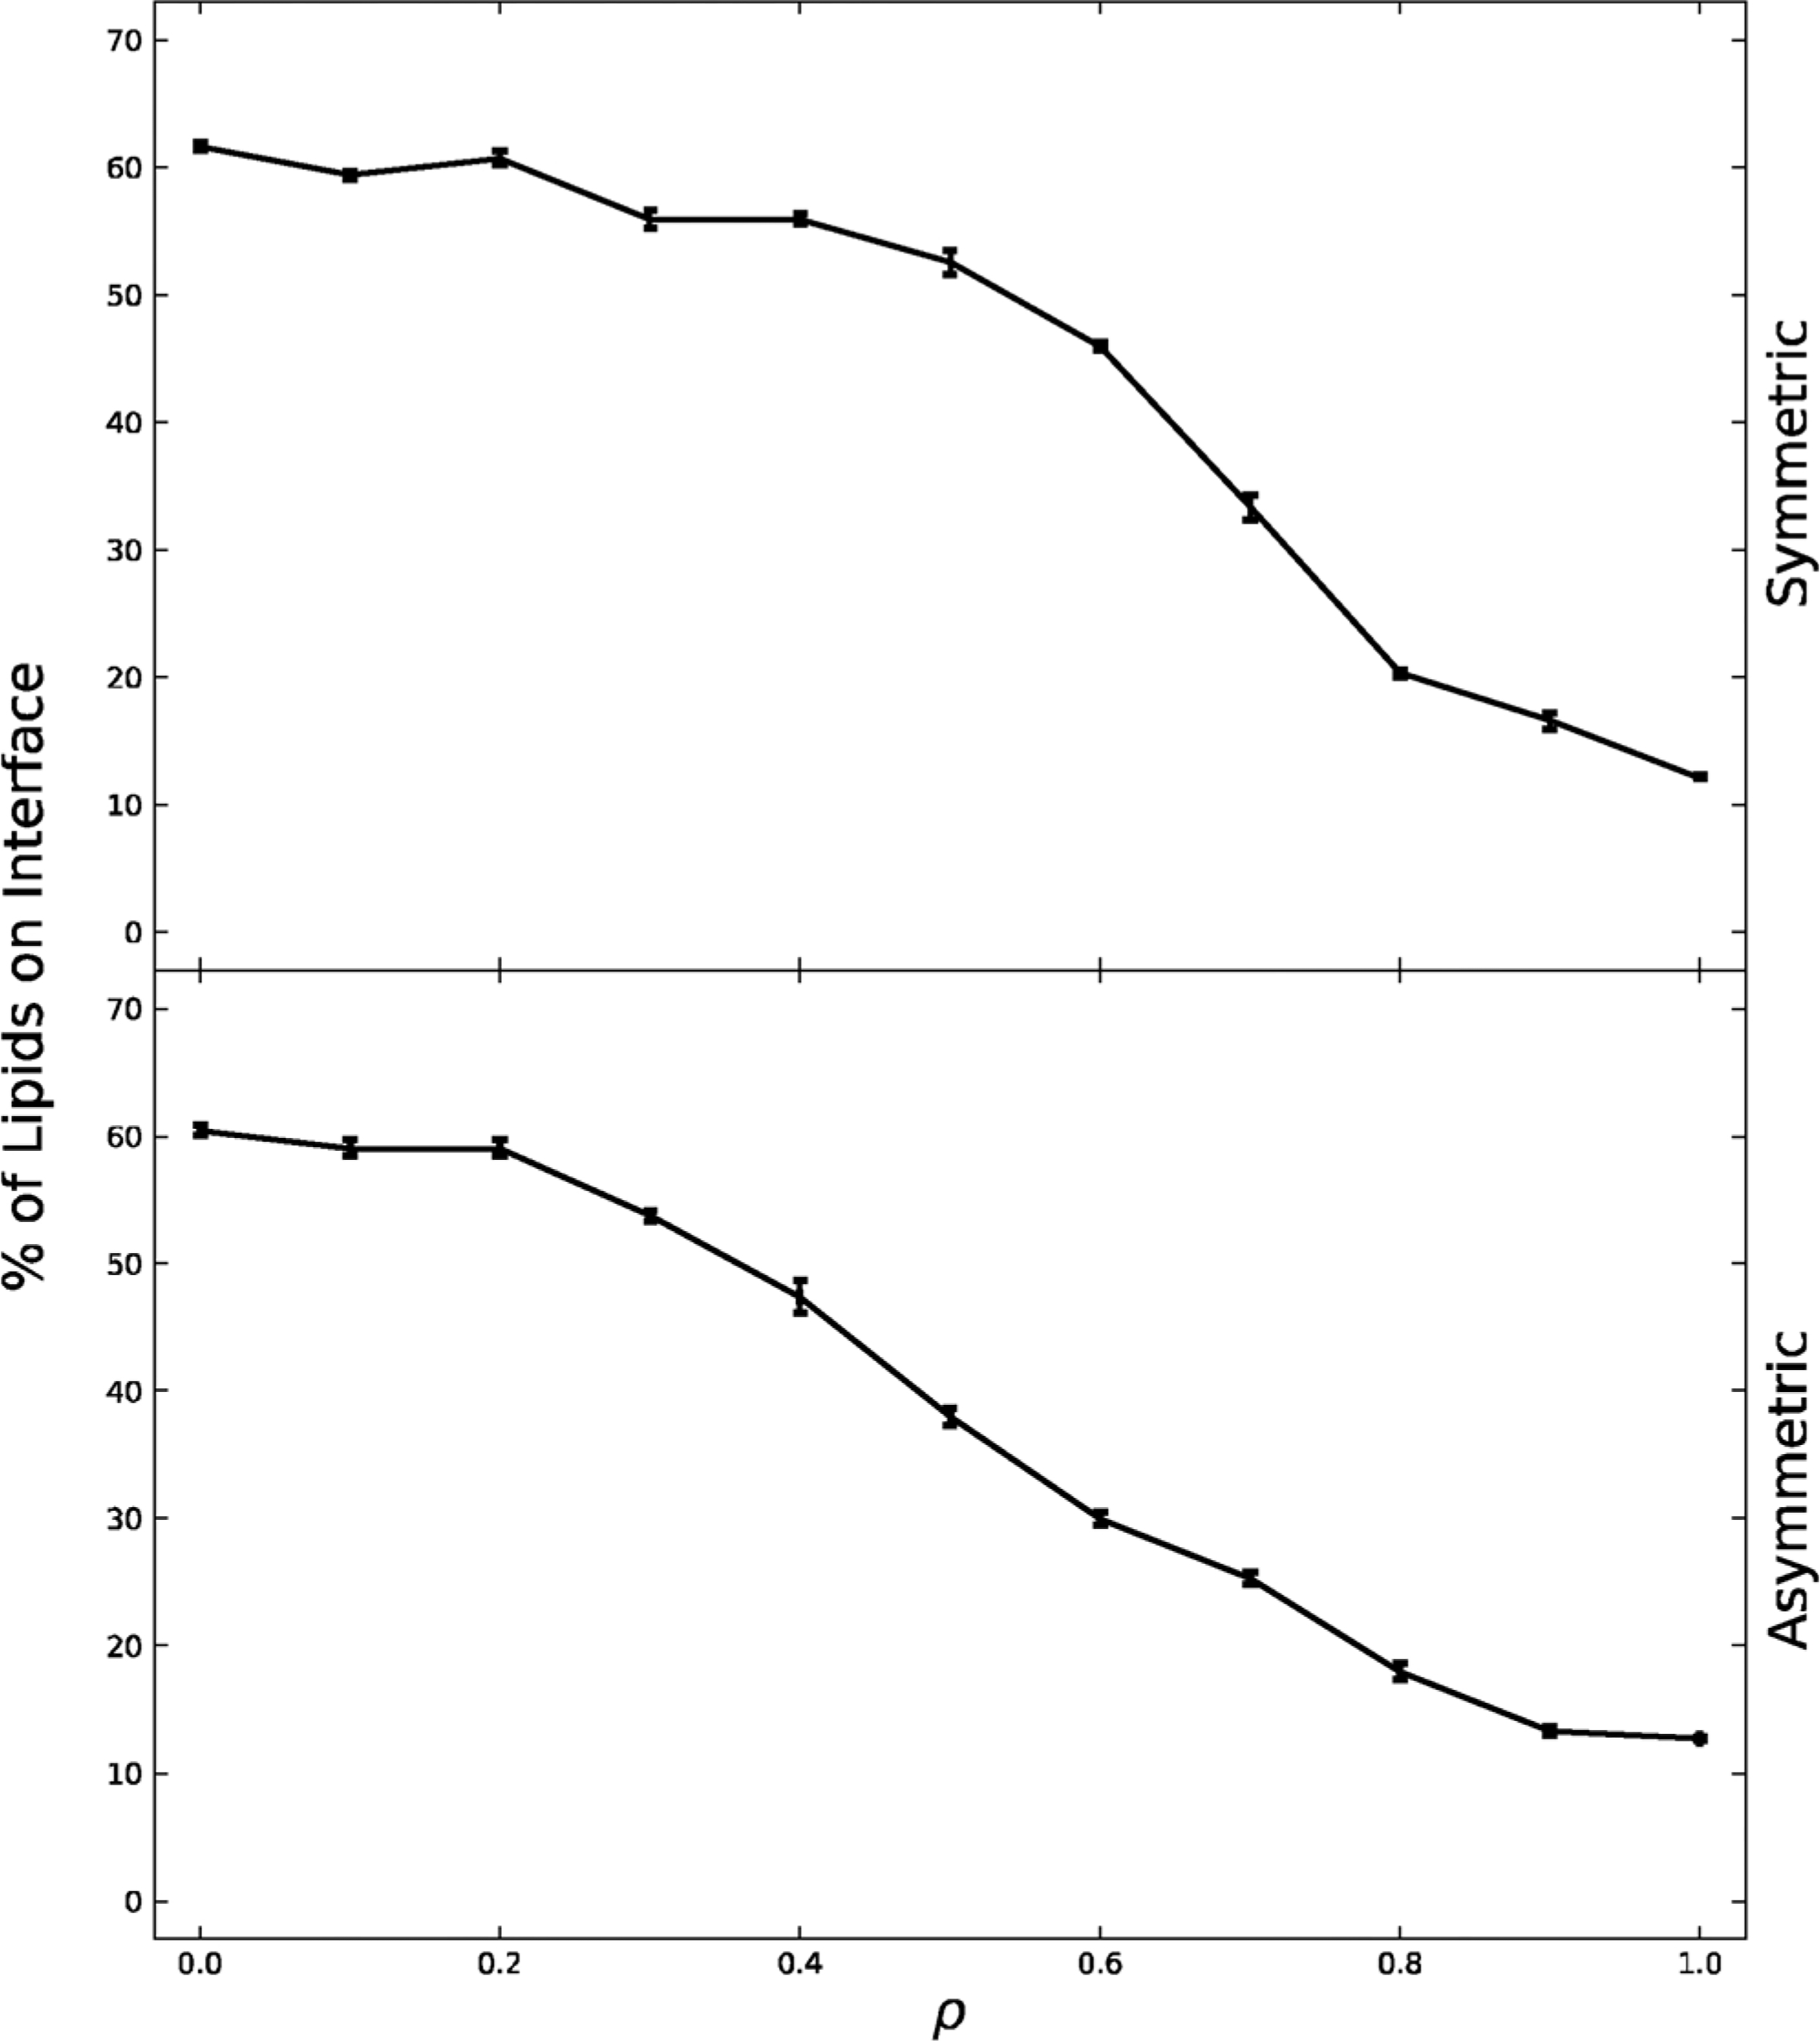
Percentage of lipids on the interface graphed for the exoplasmic symmetric and asymmetric leaflets across the ρ trajectory. Percentage of lipids on the interface decreases as ρ increases, indicating a transition from nanodomains to macrodomains. The symmetric system decreases more sharply at ρ ≈ 0.7, leading ρ ≈ .7 to be characterized as the critical ρ value (ρ*). The asymmetric system goes through no such steep transition. Standard error is shown.
Fig. 2.
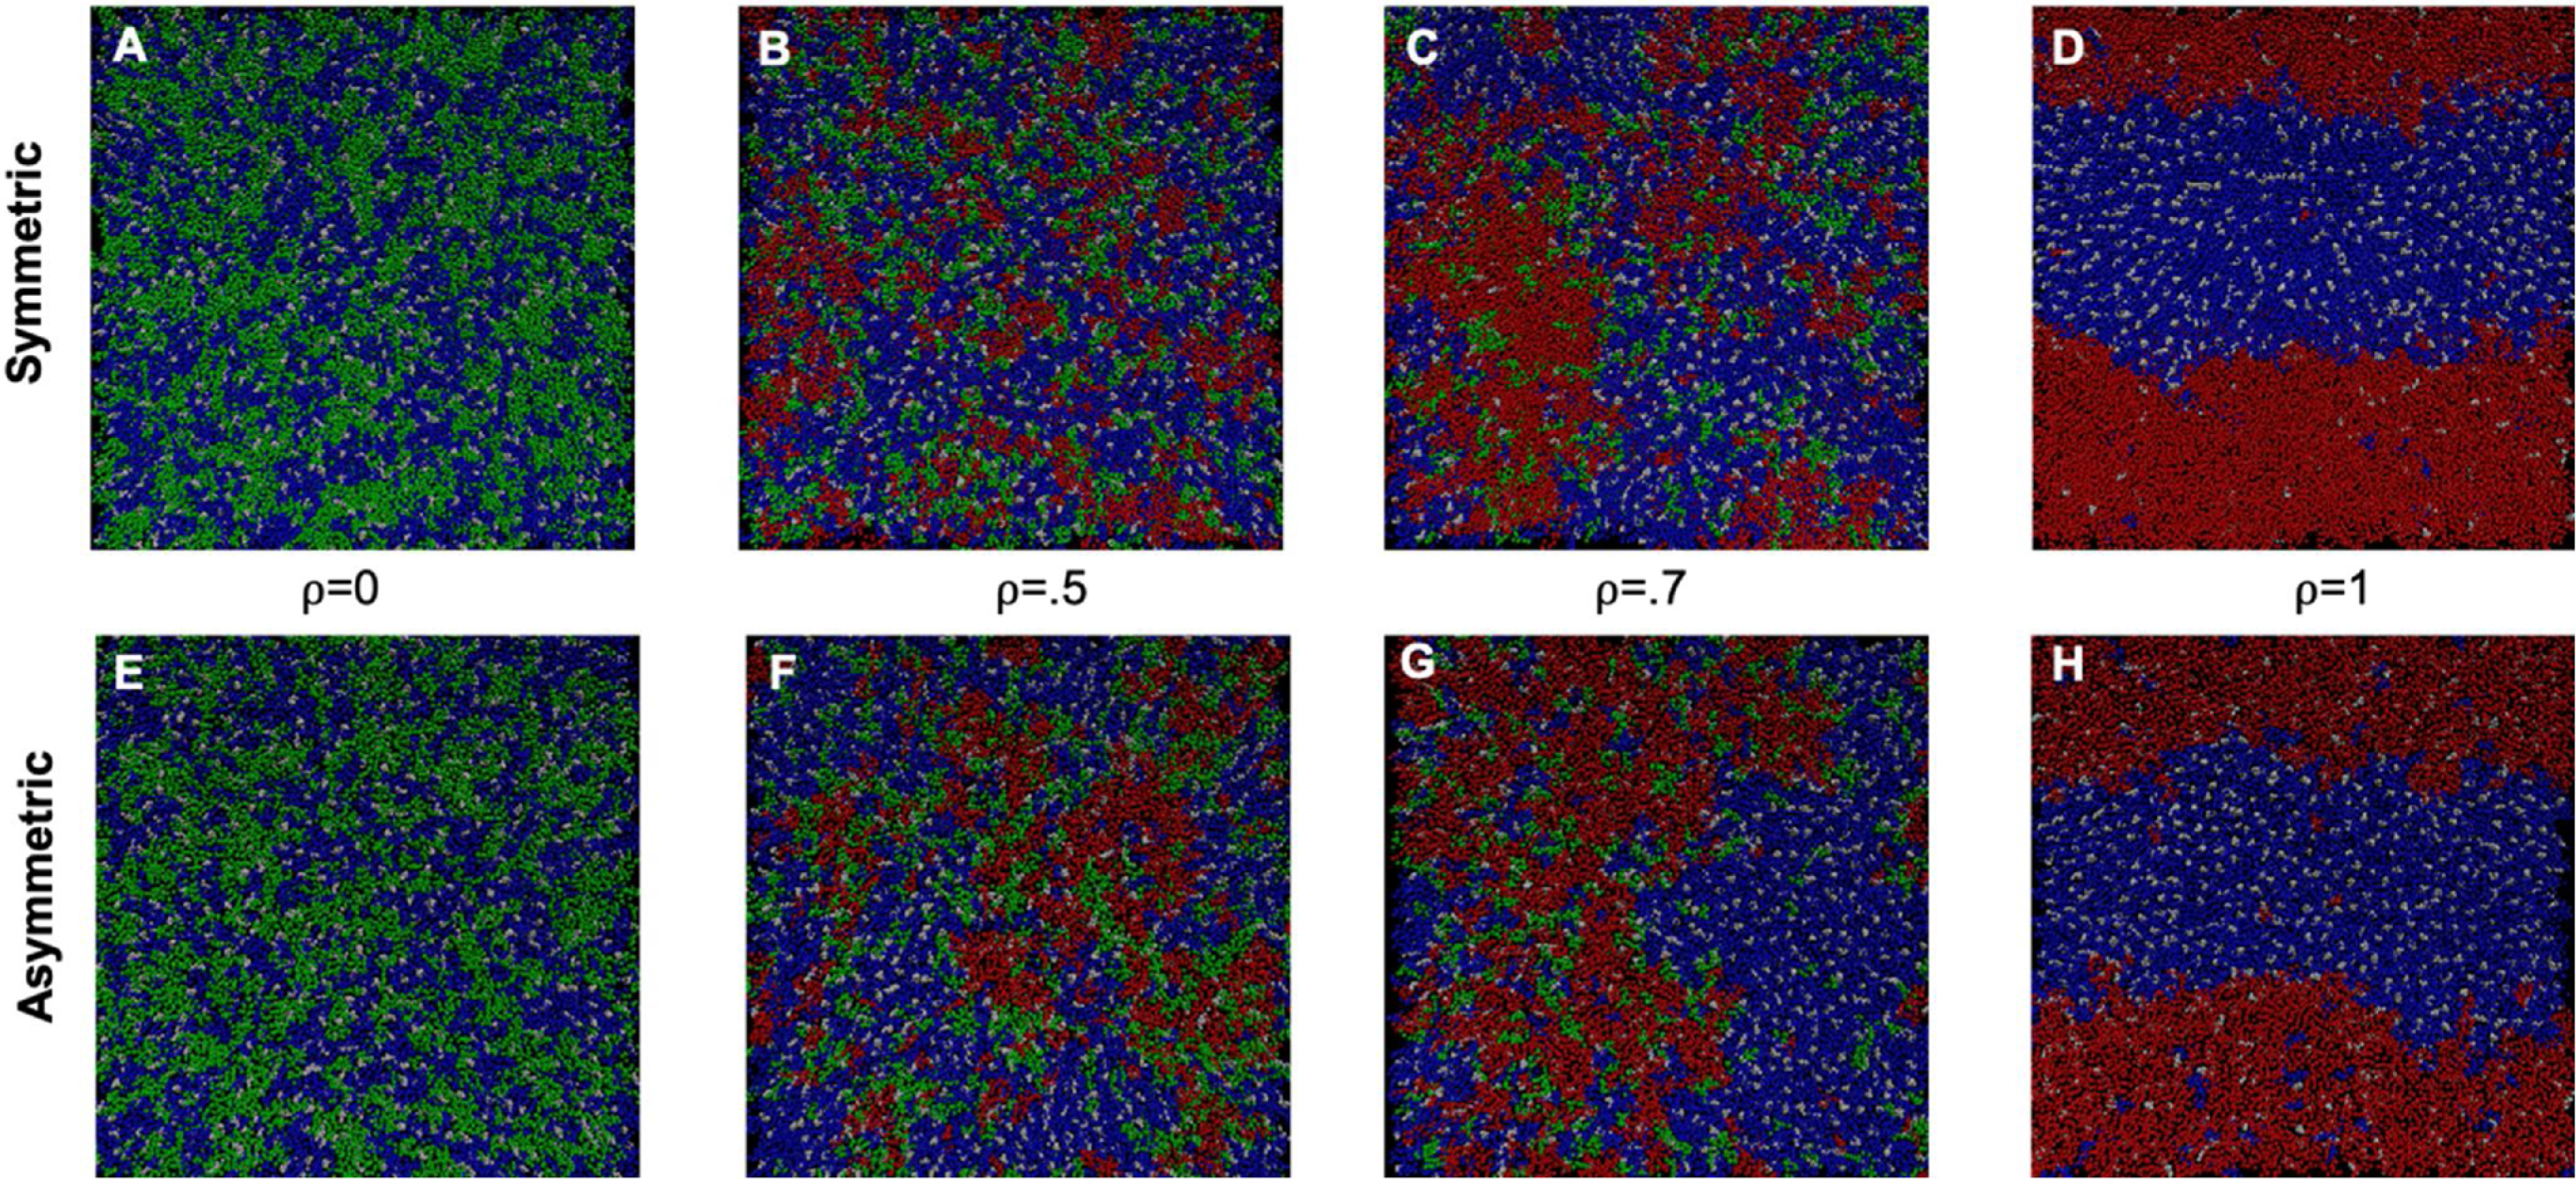
Snapshots of equilibrated exoplasmic leaflets of symmetric and asymmetric bilayers at different ρ values. Symmetric bilayers are (A) ρ = 0 (B) ρ = .5 (C) ρ = .7 (D). ρ = 1. Asymmetric bilayers are (E) ρ = 0 (F) ρ = .5 (G) ρ = .7 (H) ρ = 1. DBPC is blue, DIPC is red, PIPC is green, and chol is white. Bilayers were visualized with VMD version 1.9.4. (Humphrey et al., 1996).
The symmetric and asymmetric systems both exhibit a domain size transition as ρ increases. Notably, comparing Fig. 2B and 2 F at ρ = 0.5, the asymmetric system forms macrodomains at lower ρ values than does the symmetric system. This contrasts with published reports of higher ρ values when the different cytosolic model leaflet of DOPC/chol is used to make asymmetric vesicles. (Enoki and Feigenson, 2019; Wang and London, 2018) See Section 3.4 for additional discussion.
Looking more closely at the nano to macro transition, the symmetric system undergoes a somewhat sharper phase transition between ρ ≈.6–.8. This transition is the change from a system composed of nanodomains to one of macrodomains. The midpoint ρ value at which this transition occurs, denoted ρ*, is at ~ 0.7. The asymmetric system undergoes a broader transition. Starting at ρ ~ 0.2 it exhibits a relatively constant decrease in percentage of lipids on the interface, signifying a rather monotonic shift from nanodomains to macrodomains.
The value of ρ* is controlled by Lo/Ld line tension, as established in prior wet lab experimental studies. (Ackerman and Feigenson, 2015; Usery et al., 2017) Our observed ρ* transition is relatively sharp for the symmetric system, involving communication between phases in the exoplasmic and cytoplasmic leaflets as observed when GUVs were first used for such studies. (Korlach et al., 1999) Our asymmetric system inherently has no separation of phases in the cytoplasmic leaflet, and thus macroscopic domain formation in the exoplasmic leaflet might involve a loss of cooperativity between leaflets.
We have proposed an interpretation of interface length data shown in Fig. 1, or equivalently, domain size, as a competition between the line tension that penalizes interface, i.e. small domain size, and dipole-dipole repulsions originating near the lipid glyceryl backbone. (Usery et al., 2017) Line tension promotes domain growth by minimizing the energy penalty, decreasing the number of lipids at the aqueous interface. Dipole-dipole repulsions originating from permanent dipoles including tightly bound waters, perhaps at the carbonyl-glycerol backbone, disfavor larger domains by creating an energy penalty for larger domains. A possible explanation for the creation of macrodomains at lower ρ values in our asymmetric systems is that dipole-dipole repulsions could be decreased in the asymmetric bilayers: Asymmetry might decrease dipole-dipole cancellation from apposing leaflets, leading to increased repulsion. (Usery et al., 2017) But such an increase in repulsion could be offset through an overall decrease in dipole-dipole repulsion difference between Lo and Ld phases created by the asymmetry; this has not been measured. We suggest that a decrease in dipole-dipole repulsion that would lead to a higher measured line tension is an alternative to a decrease in cooperativity to explain why the nano-to-macro transition is both less sharp and at lower ρ* value for our asymmetric system.
Note that nanodomains and macrodomains in the simulation exist on a different scale from those on a vesicle in vitro, due to the limited size of the simulation box (approximately 36 nm × 36 nm). On this simulation scale, macrodomains are represented as infinite in one dimension due to periodic boundary conditions, while nanodomains are smaller and of irregular shape (Fig. 2). However, we have previously conducted MD simulations of symmetric four-component phase-separating systems and found the size of nanodomains and the transition from nanodomains to macrodomains to match in a system of this size (36 nm × 36 nm) and in a system four times as large (74 nm × 74 nm). (Ackerman and Feigenson, 2015; Usery et al., 2017)
3.2. Symmetric registration
Fig. 3 shows the percent of registration for the symmetric system. Registration is a measure of lipids in the exoplasmic leaflet whose phase matches that of its nearest neighbors in the apposed leaflet. That is, registration means Lo lipids reside across from Lo lipids or Ld lipids reside across from Ld lipids; anti-registration means that opposite phases reside across from each other.
Fig. 3.
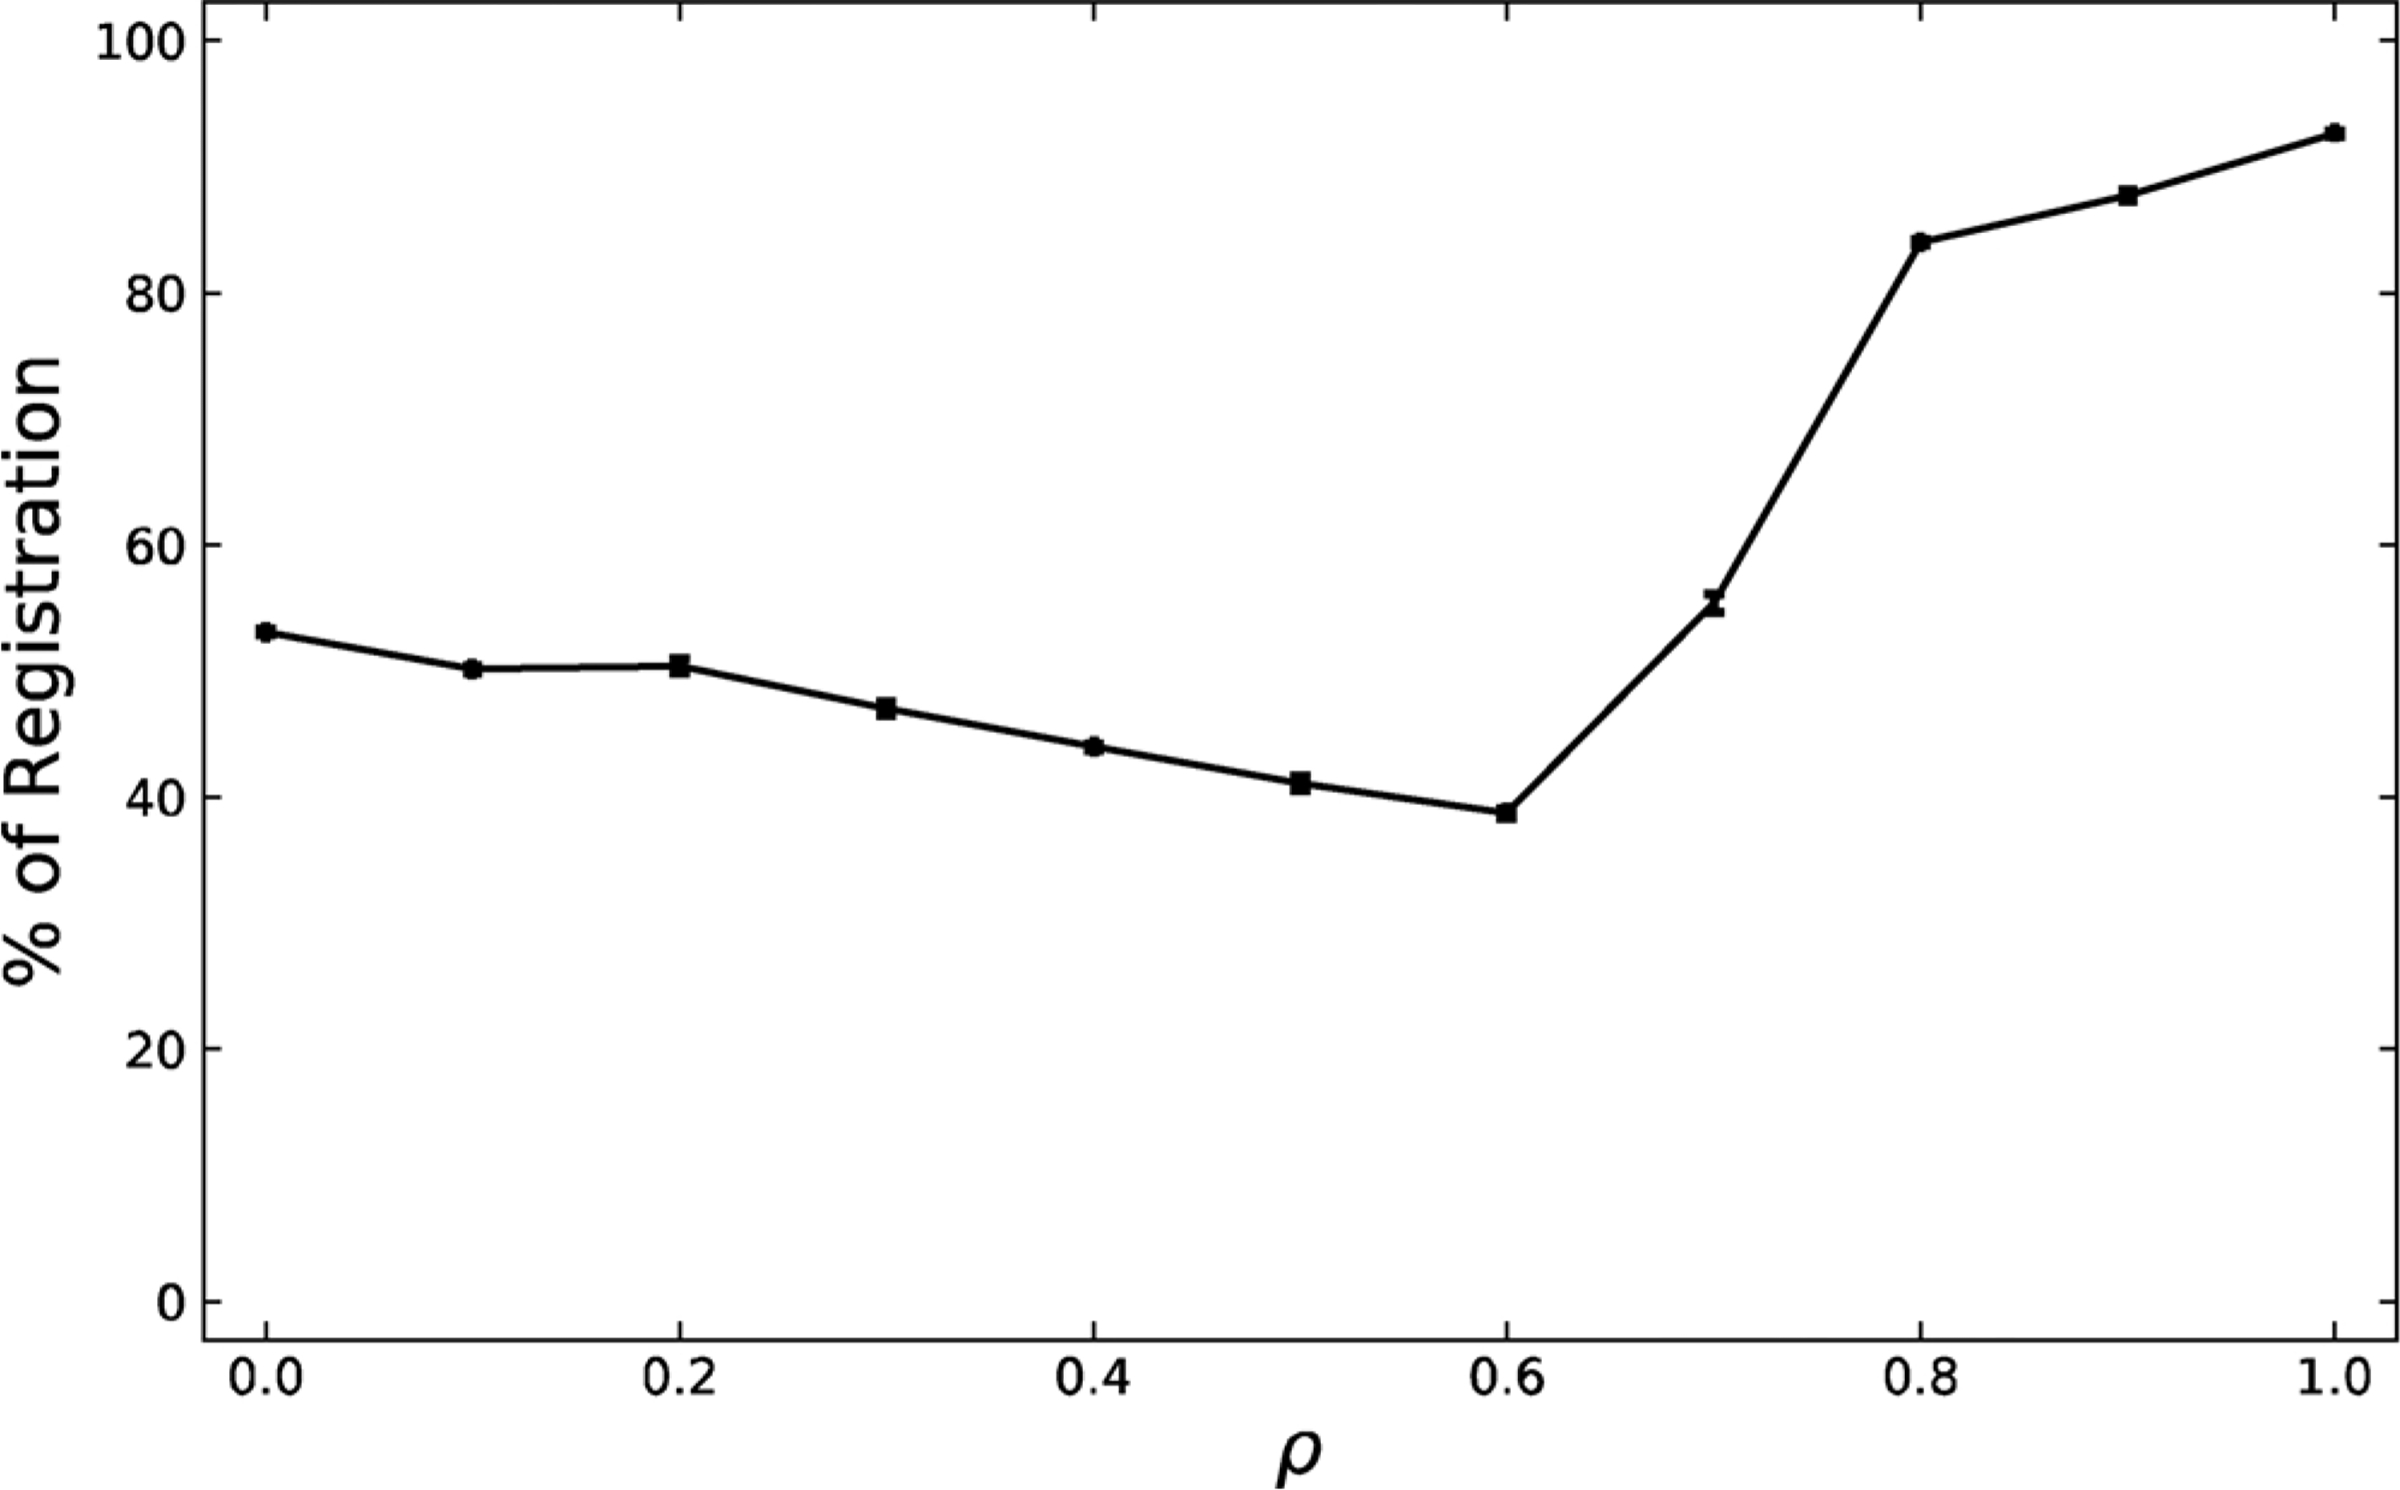
The percentage of registration for the exoplasmic symmetric leaflet across the ρ trajectory. Registration decreases slightly as ρ is increased, and then sharply increases at ρ ≈ 0.7, ρ*. High levels of registration do not occur until the system is in the macrodomain regime, ρ > .7. Standard error is shown.
Registration data were found for only the symmetric system, because the asymmetric system inherently has no registration, since phases do not form in the asymmetric cytoplasmic leaflet. A registration percentage of >50 % corresponds to registration while a value <50 % corresponds to anti-registration. A value of exactly 50 % denotes a lipid whose apposed neighbors are equally likely to belong to Lo or Ld phases.
Fig. 3 shows that at ρ ≈ 0, the registration percentage is ~50 %. As ρ increases the registration percentage decreases slightly until ρ ≈ 0.6. The system sharply increases its registration to reach ~90 % at ρ ≈ .8–1. This sharp change in registration occurs around ρ*, meaning that registration occurs only upon the creation of sufficiently large macrodomains. In the regime of nanodomains where symmetric ρ < 0.6–0.7, domains are slightly anti-registered as predicted by Olmsted and Williamson (Fowler et al., 2016), and found in our previous MD study (Weiner and Feigenson, 2018), because nanodomains are not large enough to align across the bilayer.
3.3. Cholesterol location
The chol composition of exoplasmic Lo and Ld phases for the symmetric and asymmetric system was tracked across the ρ trajectory in Fig. 4. These data indicate that in both the symmetric and asymmetric system, as ρ increases the Ld phase becomes increasingly depleted of chol while the Lo domain becomes increasingly enriched in chol. At ρ = 1, the symmetric and asymmetric Lo domains are composed of ~30 % chol. Likewise at p = 1, the symmetric and asymmetric Ld domains are composed of ~5 % chol. It is interesting that at the highest ρ values there are almost no differences in chol composition between symmetric and asymmetric bilayers. The depletion of chol in the asymmetric Ld phases and the enrichment in the asymmetric Lo phase follows a more monotonic change, indicative of the monotonic transformation from nanodomains to macrodomains shown in Fig. 1.
Fig. 4.
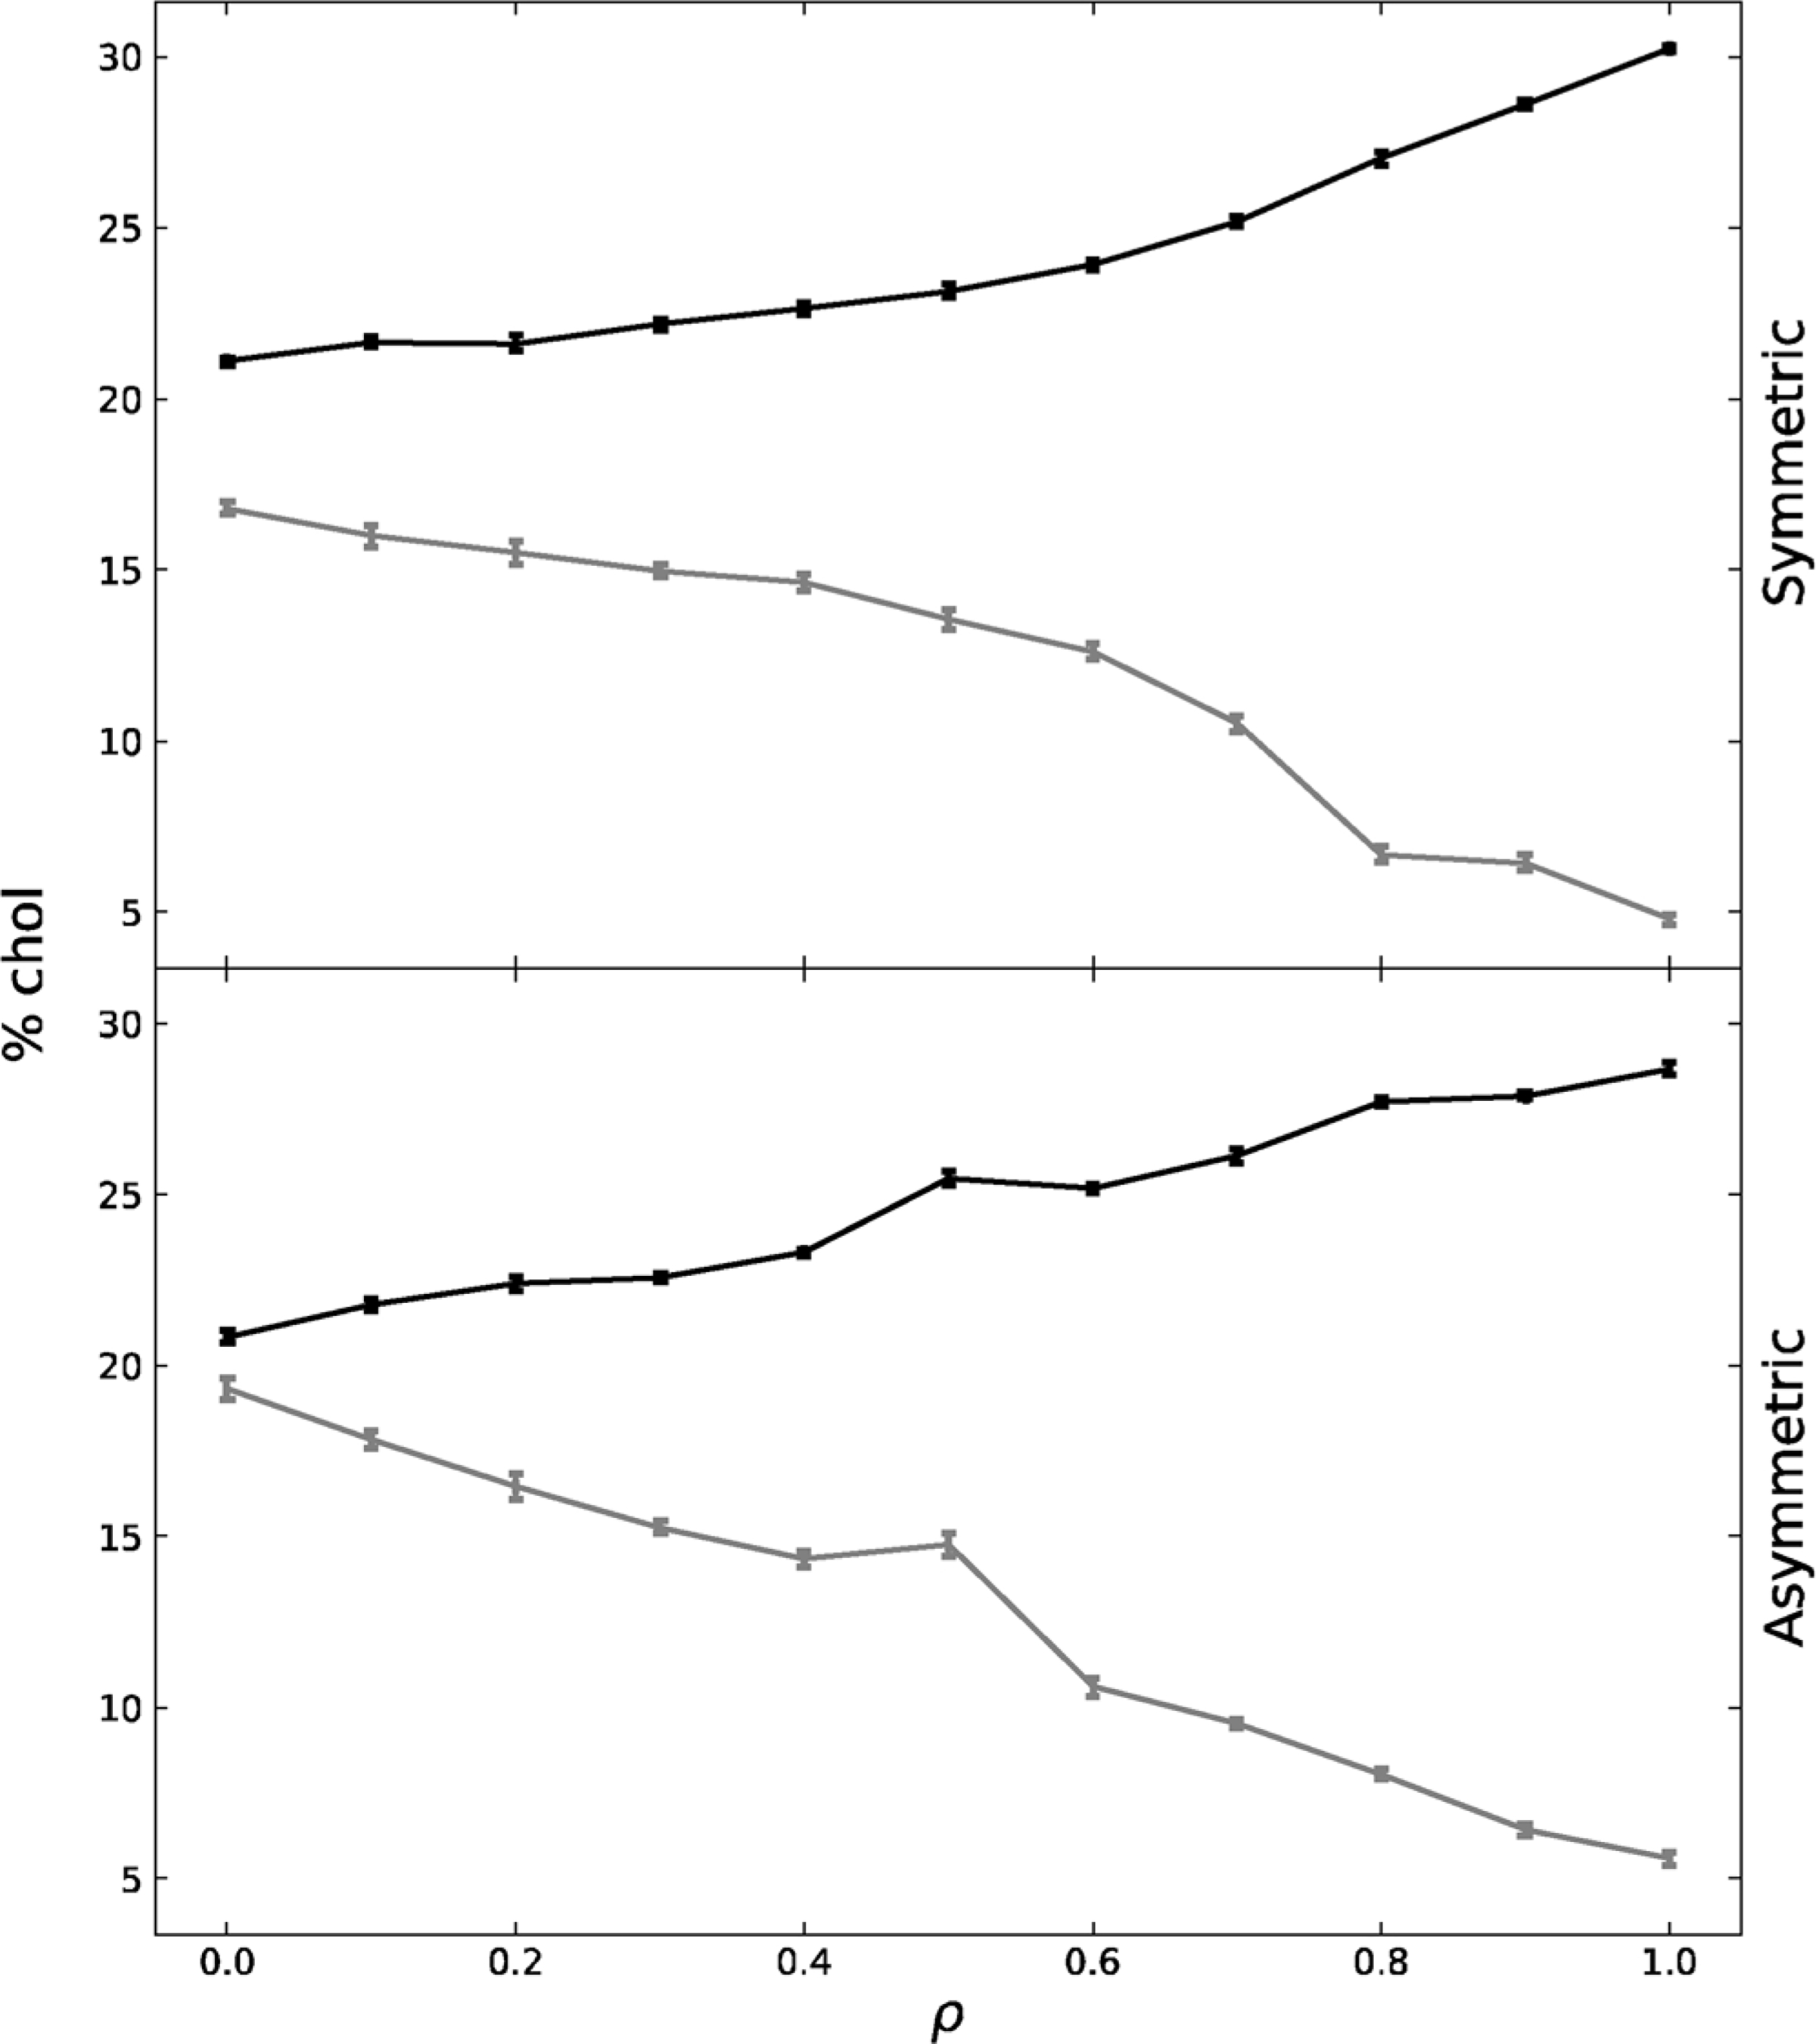
Chol makeup of the Lo (black) and Ld (grey) phases for the exoplasmic, symmetric and asymmetric leaflets across the ρ trajectory. Standard error is shown.
Fig. 5 displays the chol composition for the asymmetric cytoplasmic leaflet; areas were determined to be across from exoplasmic Lo or Ld phases and were marked accordingly, and their cholesterol percentage shown. Across the ρ trajectory, the chol in regions across from Lo and Ld remain almost equivalent. It is not surprising to see almost equivalent chol makeup at low ρ because the systems are still in the nanodomain regime. Since nanodomains are small, they are unable to create a distinct environment in the apposed leaflet, as previously shown by Usery, et al. in 2017. (Usery et al., 2017) Even at high ρ values, wherein the systems are firmly in the macrodomain regime, the chol composition remains equivalent, but this is consistent with our previous MD result. Because macrodomains are large, they are able to create distinct environments in the regions across from them. However, our data indicate that a distinct Lo domain does not sequester nor release chol in the region across from it.
Fig. 5.
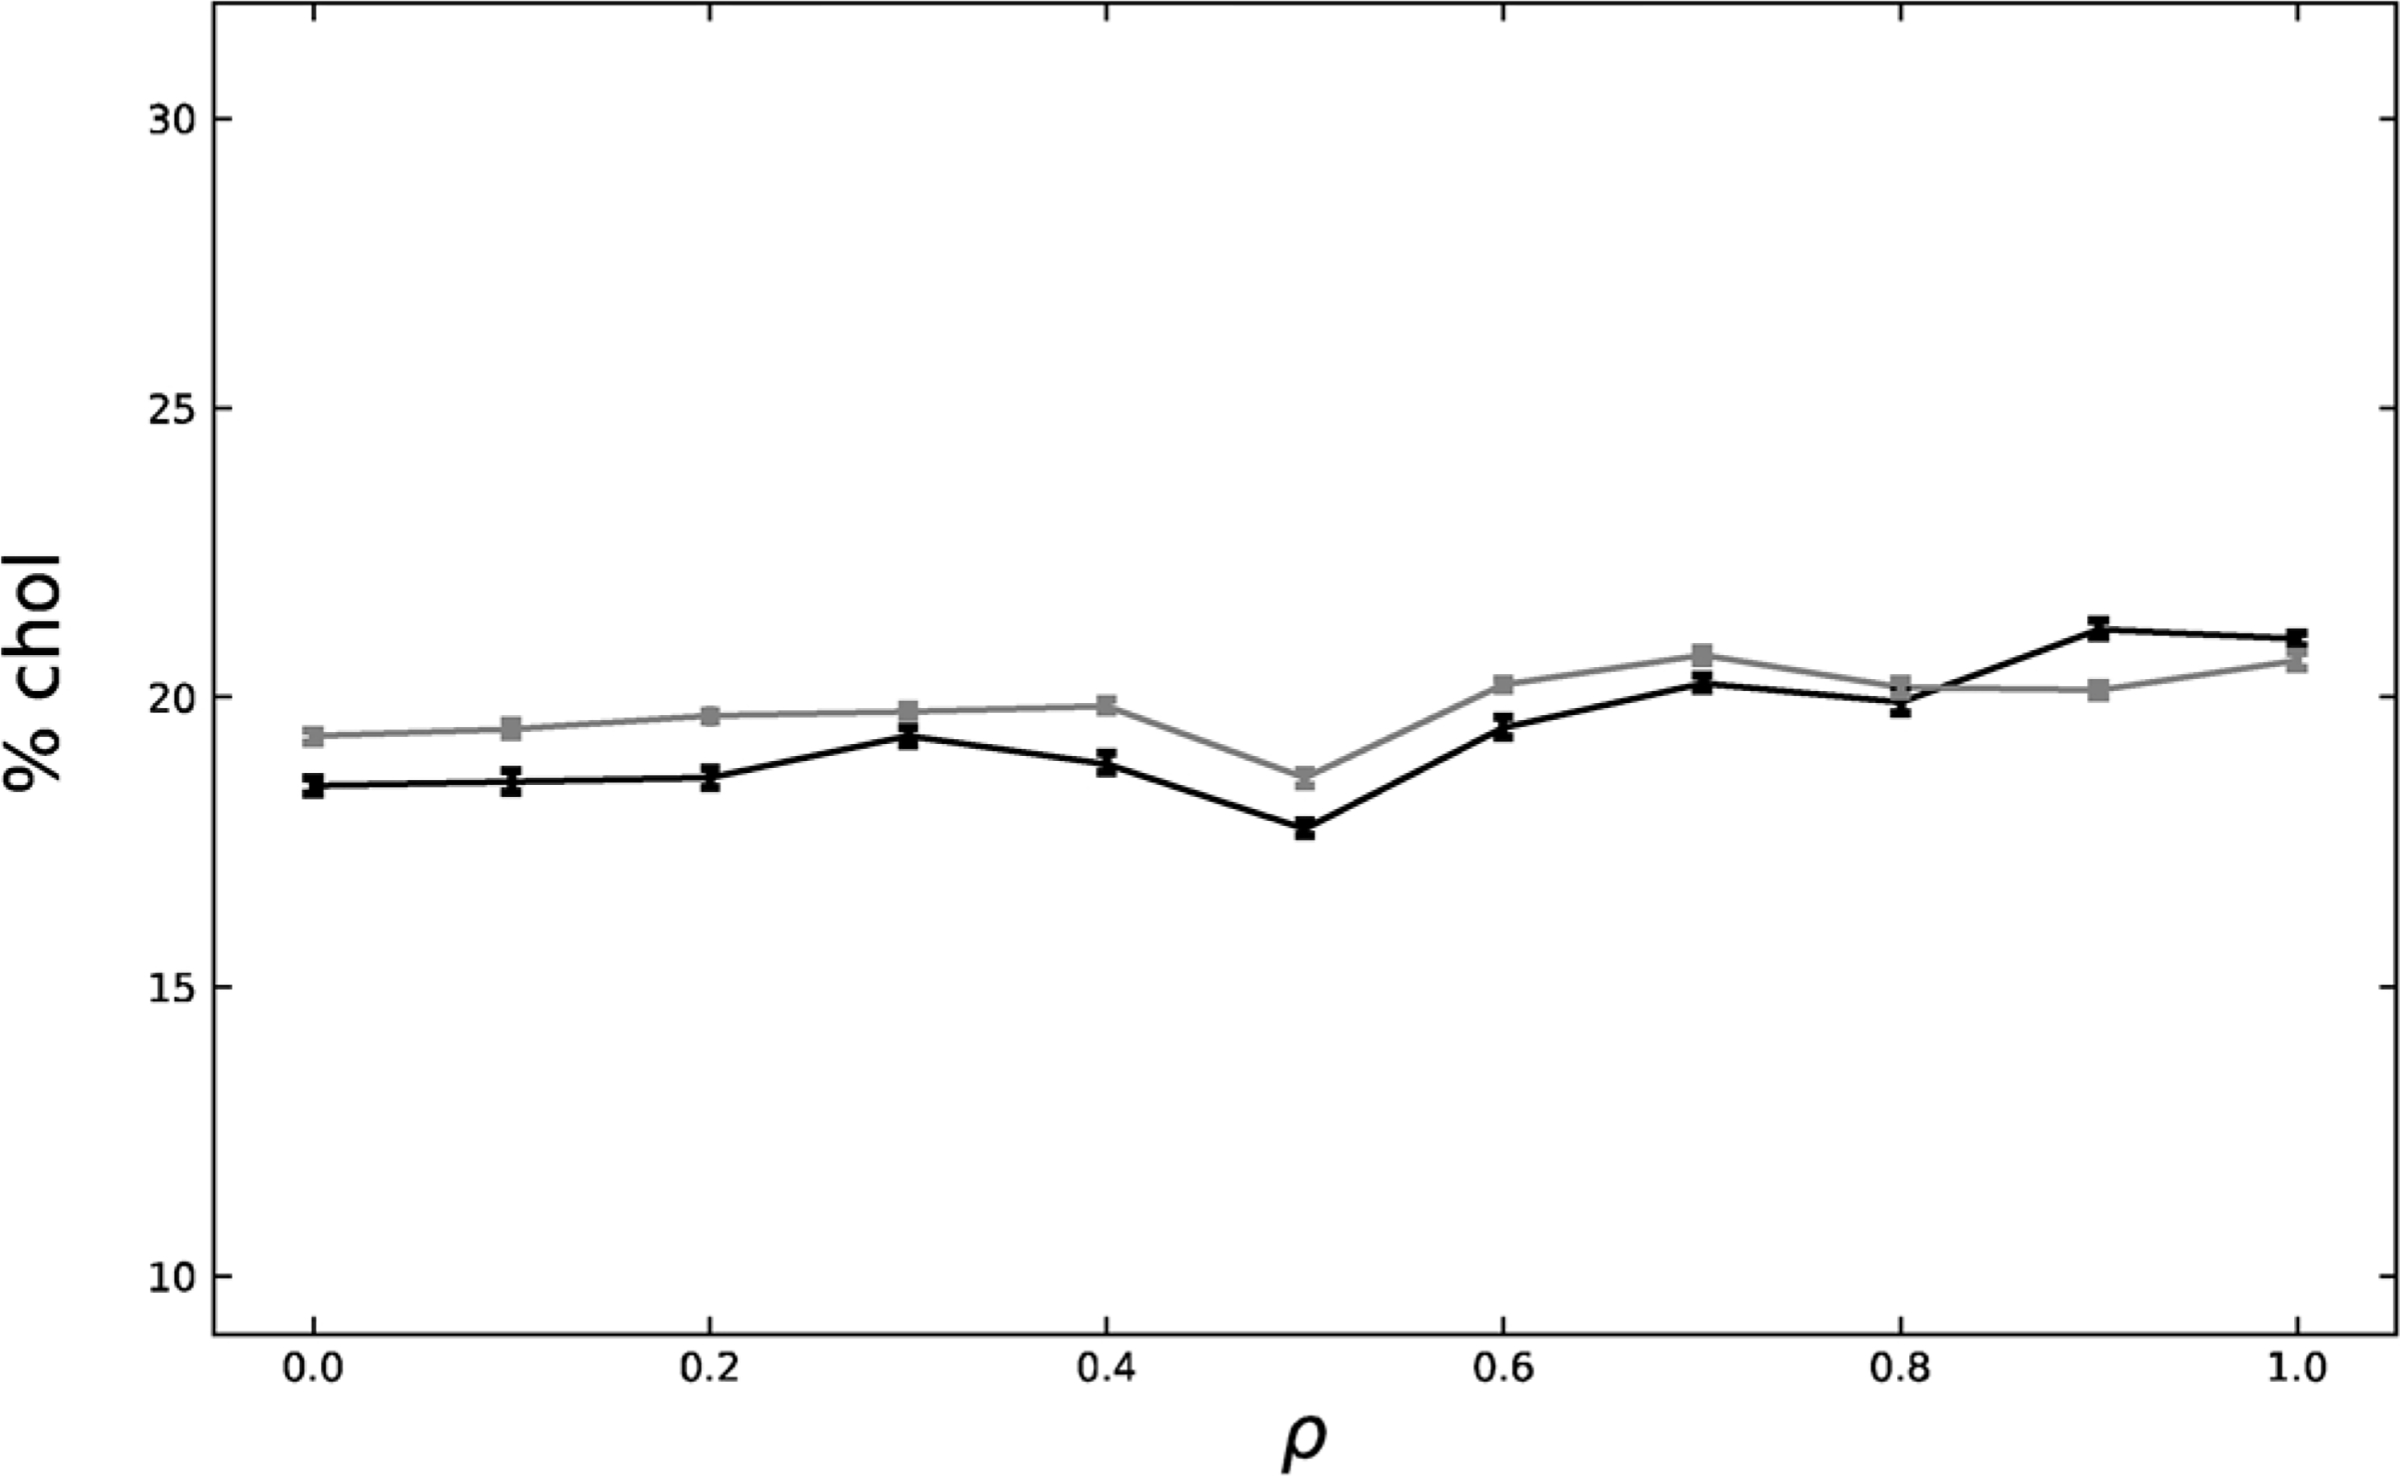
Chol makeup of areas across from Lo (black) and across from Ld (grey) for the asymmetric, cytoplasmic leaflet. Standard error is shown.
Supplemental Fig. 5 shows that there is no chol movement between leaflets for the symmetric bilayers. There is a slight movement of chol from the exoplasmic leaflet to the cytoplasmic leaflet in the asymmetric system across the ρ trajectory. This movement is most likely due to the imperfect method of matching exoplasmic and cytoplasmic leaflet areas in asymmetric bilayer creation. At higher ρ values, area matching may have led to slight excesses of cytoplasmic chol which subsequently redistributed itself during the simulation.
3.4. UA sn-1 DBPC order parameter
After equilibrating the UA simulations, order parameter was calculated for the sn-1 chain of the DBPC lipids using the carbon deuterium order parameter SCD = <3cos2α -1 > /2 (Brown and London, 1998) where α is defined as the angle between the predicted CH bond angle and bilayer normal. Because UA does not represent nonpolar hydrogens, the CH bond angle was predicted from the carbon-carbon bonds along the chain. A custom script used to evaluate the order parameter calculated the local bilayer normal for each DBPC lipid, because some bilayers were curved. Prediction of the CH bond angle was made using standard UA order parameter analysis methods. (Piggot et al., 2017)
-Scd for each methylene in the hydrocarbon sn-1 chain of DBPC was individually calculated and averaged, then displayed in Fig. 6. The order parameters for the symmetric and asymmetric system DBPCs are shown at ρ = 0 and ρ = 1. Evidently, DBPC order parameter at ρ = 1 for both the symmetric and asymmetric systems is significantly higher than at ρ = 0. This finding shows the increasing differentiation of Ld domains from the DBPC-rich Lo domains. As ρ increases, the DBPCs pack together with higher fractions of chol in an ordered Lo domain. Surprisingly, at ρ = 1 the symmetric DBPC order parameter is only marginally higher than the asymmetric DBPC order parameter. This is unexpected because at ρ = 1, the symmetric system is highly registered and thus Lo resides across from Lo. However, this finding indicates that despite the increased unsaturation in the POPE/POPS/chol cytoplasmic leaflet compared to the Lo composition, the DBPC order parameter is hardly increased. Thus the POPE/POPS/chol mixture is rather ordered.
Fig. 6.
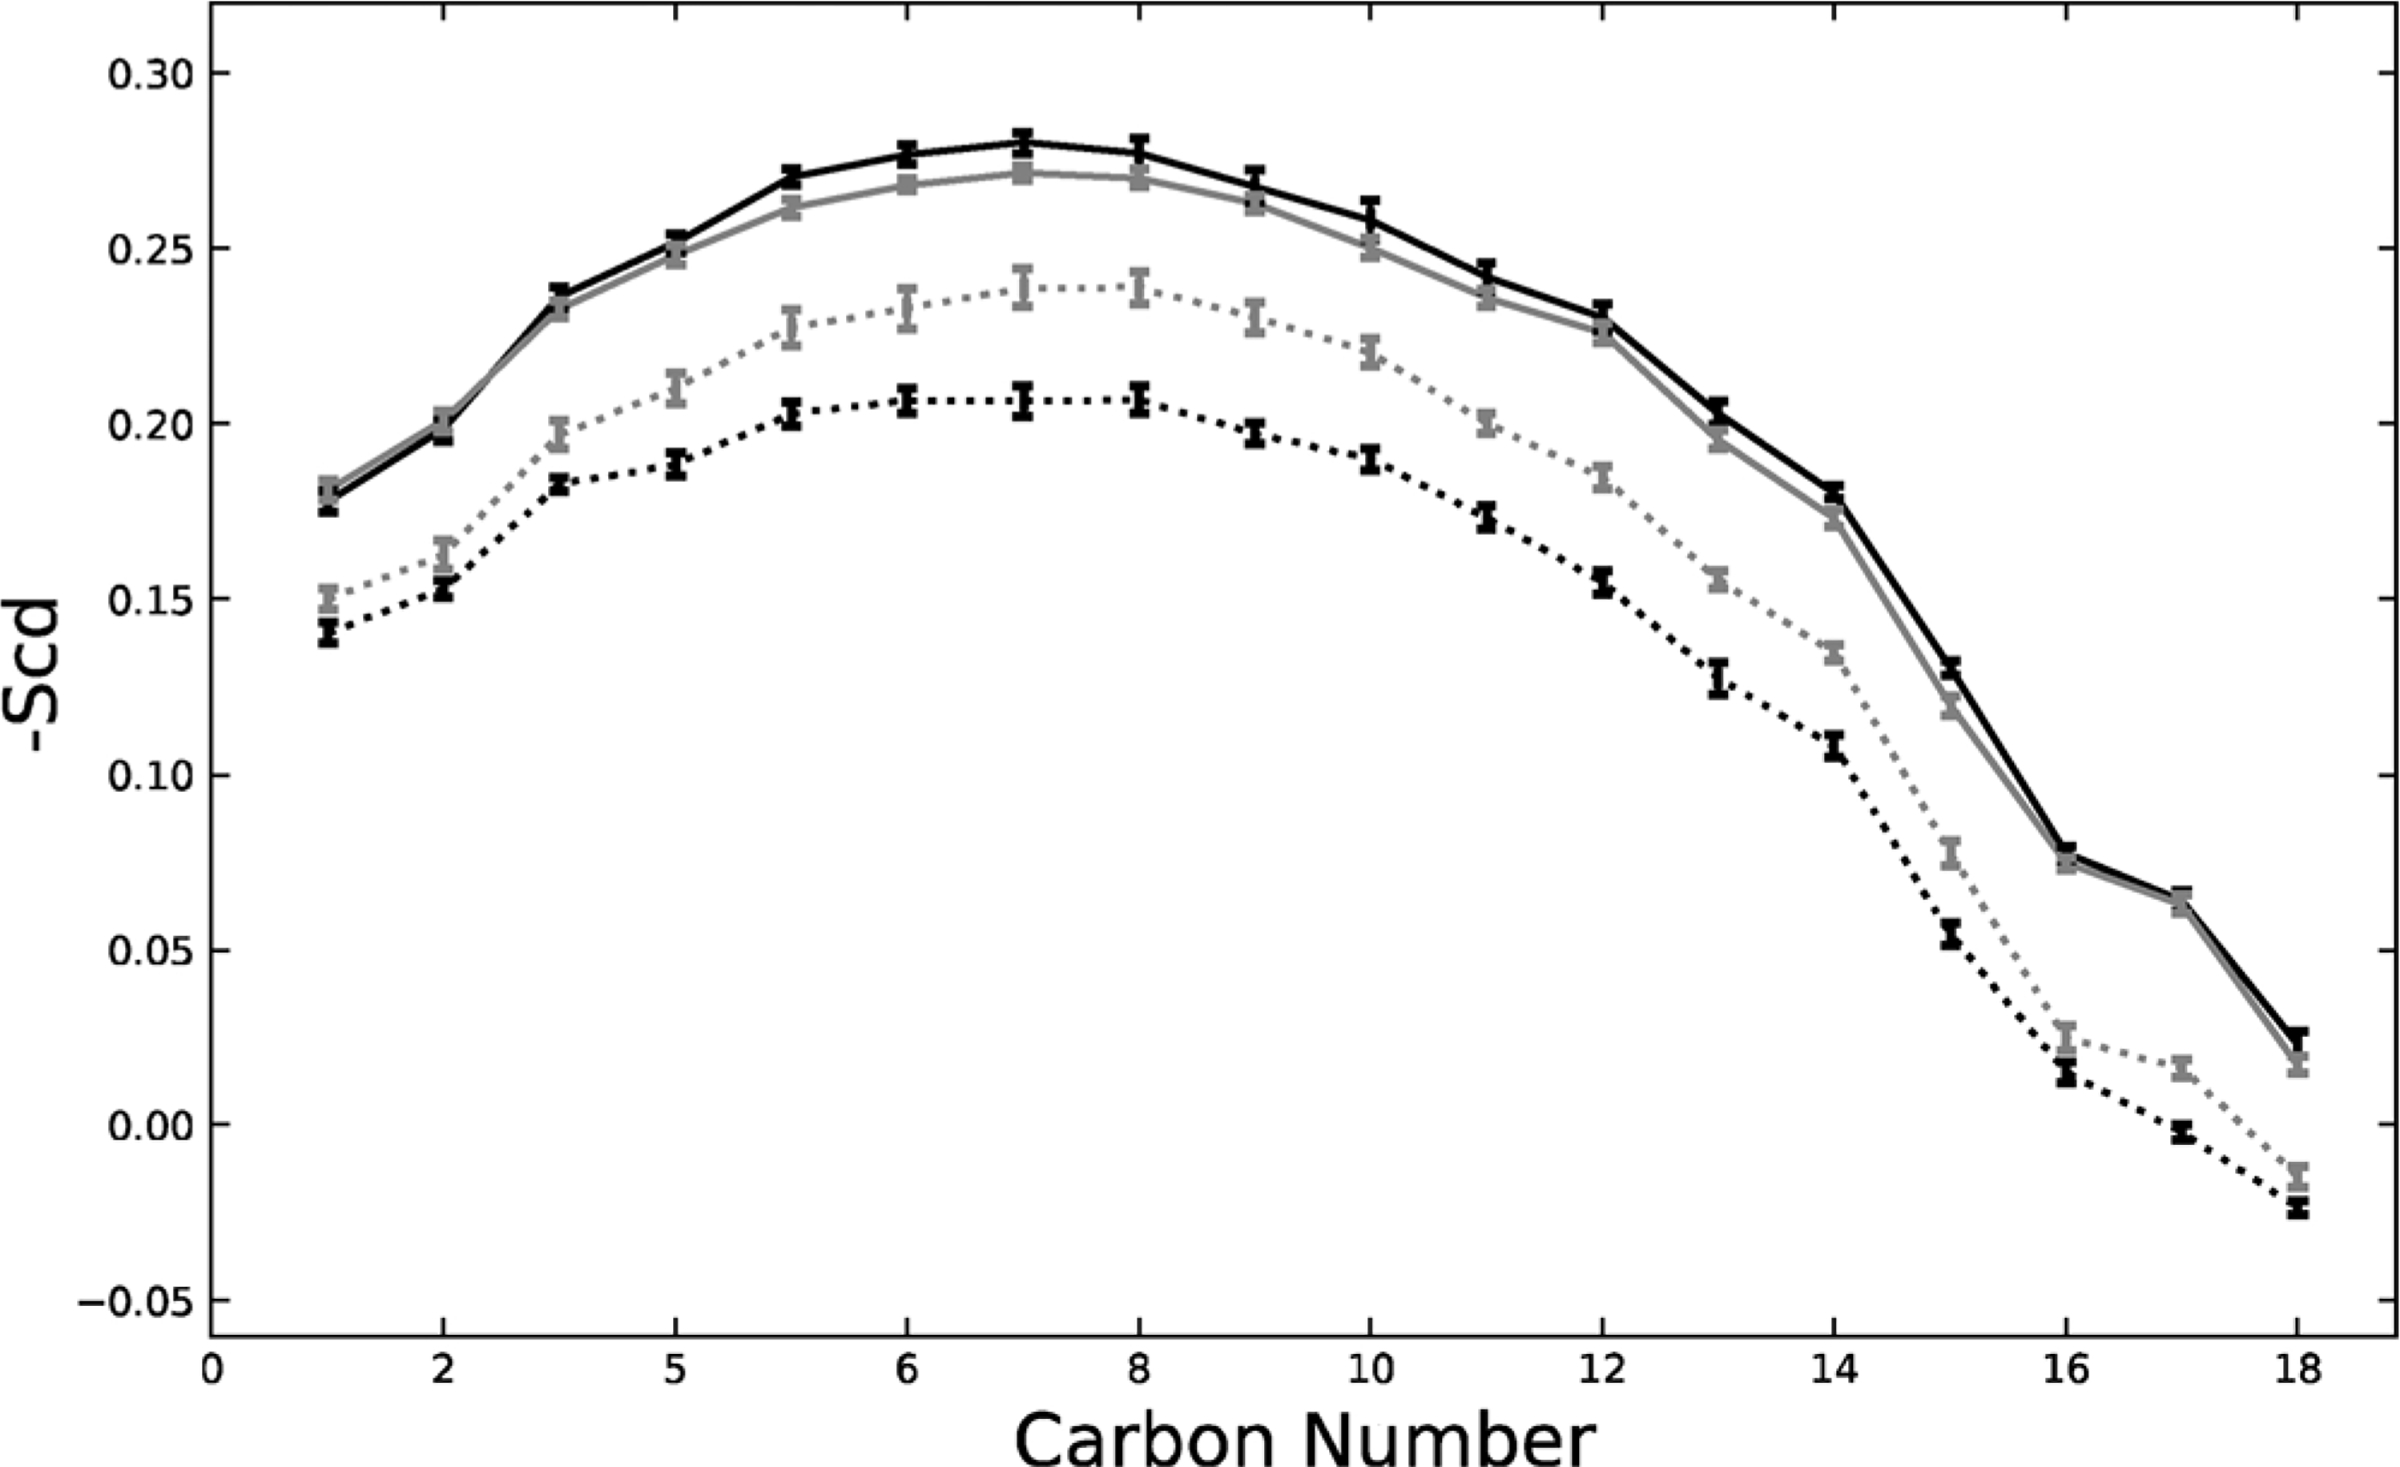
sn-1 chain DBPC order parameter shown for the symmetric system (black) and the asymmetric system (grey). Dashed lines corresponds to ρ = 0 and solid lines to ρ = 1. Both symmetric and asymmetric systems show an increase in order parameter from ρ = 0 to ρ = 1, indicating the creation of a DBPC rich Lo phase at high ρ values. Standard error is shown.
Fig. 7 shows the -Scd for carbon 6 of the DBPC sn-1 chain across the ρ trajectory for both the symmetric and asymmetric systems. The asymmetric -Scd shows an increasing monotonic shift in order parameter across the trajectory, further validating the monotonic creation of Lo and Ld macrodomains shown in Fig. 1.
Fig. 7.
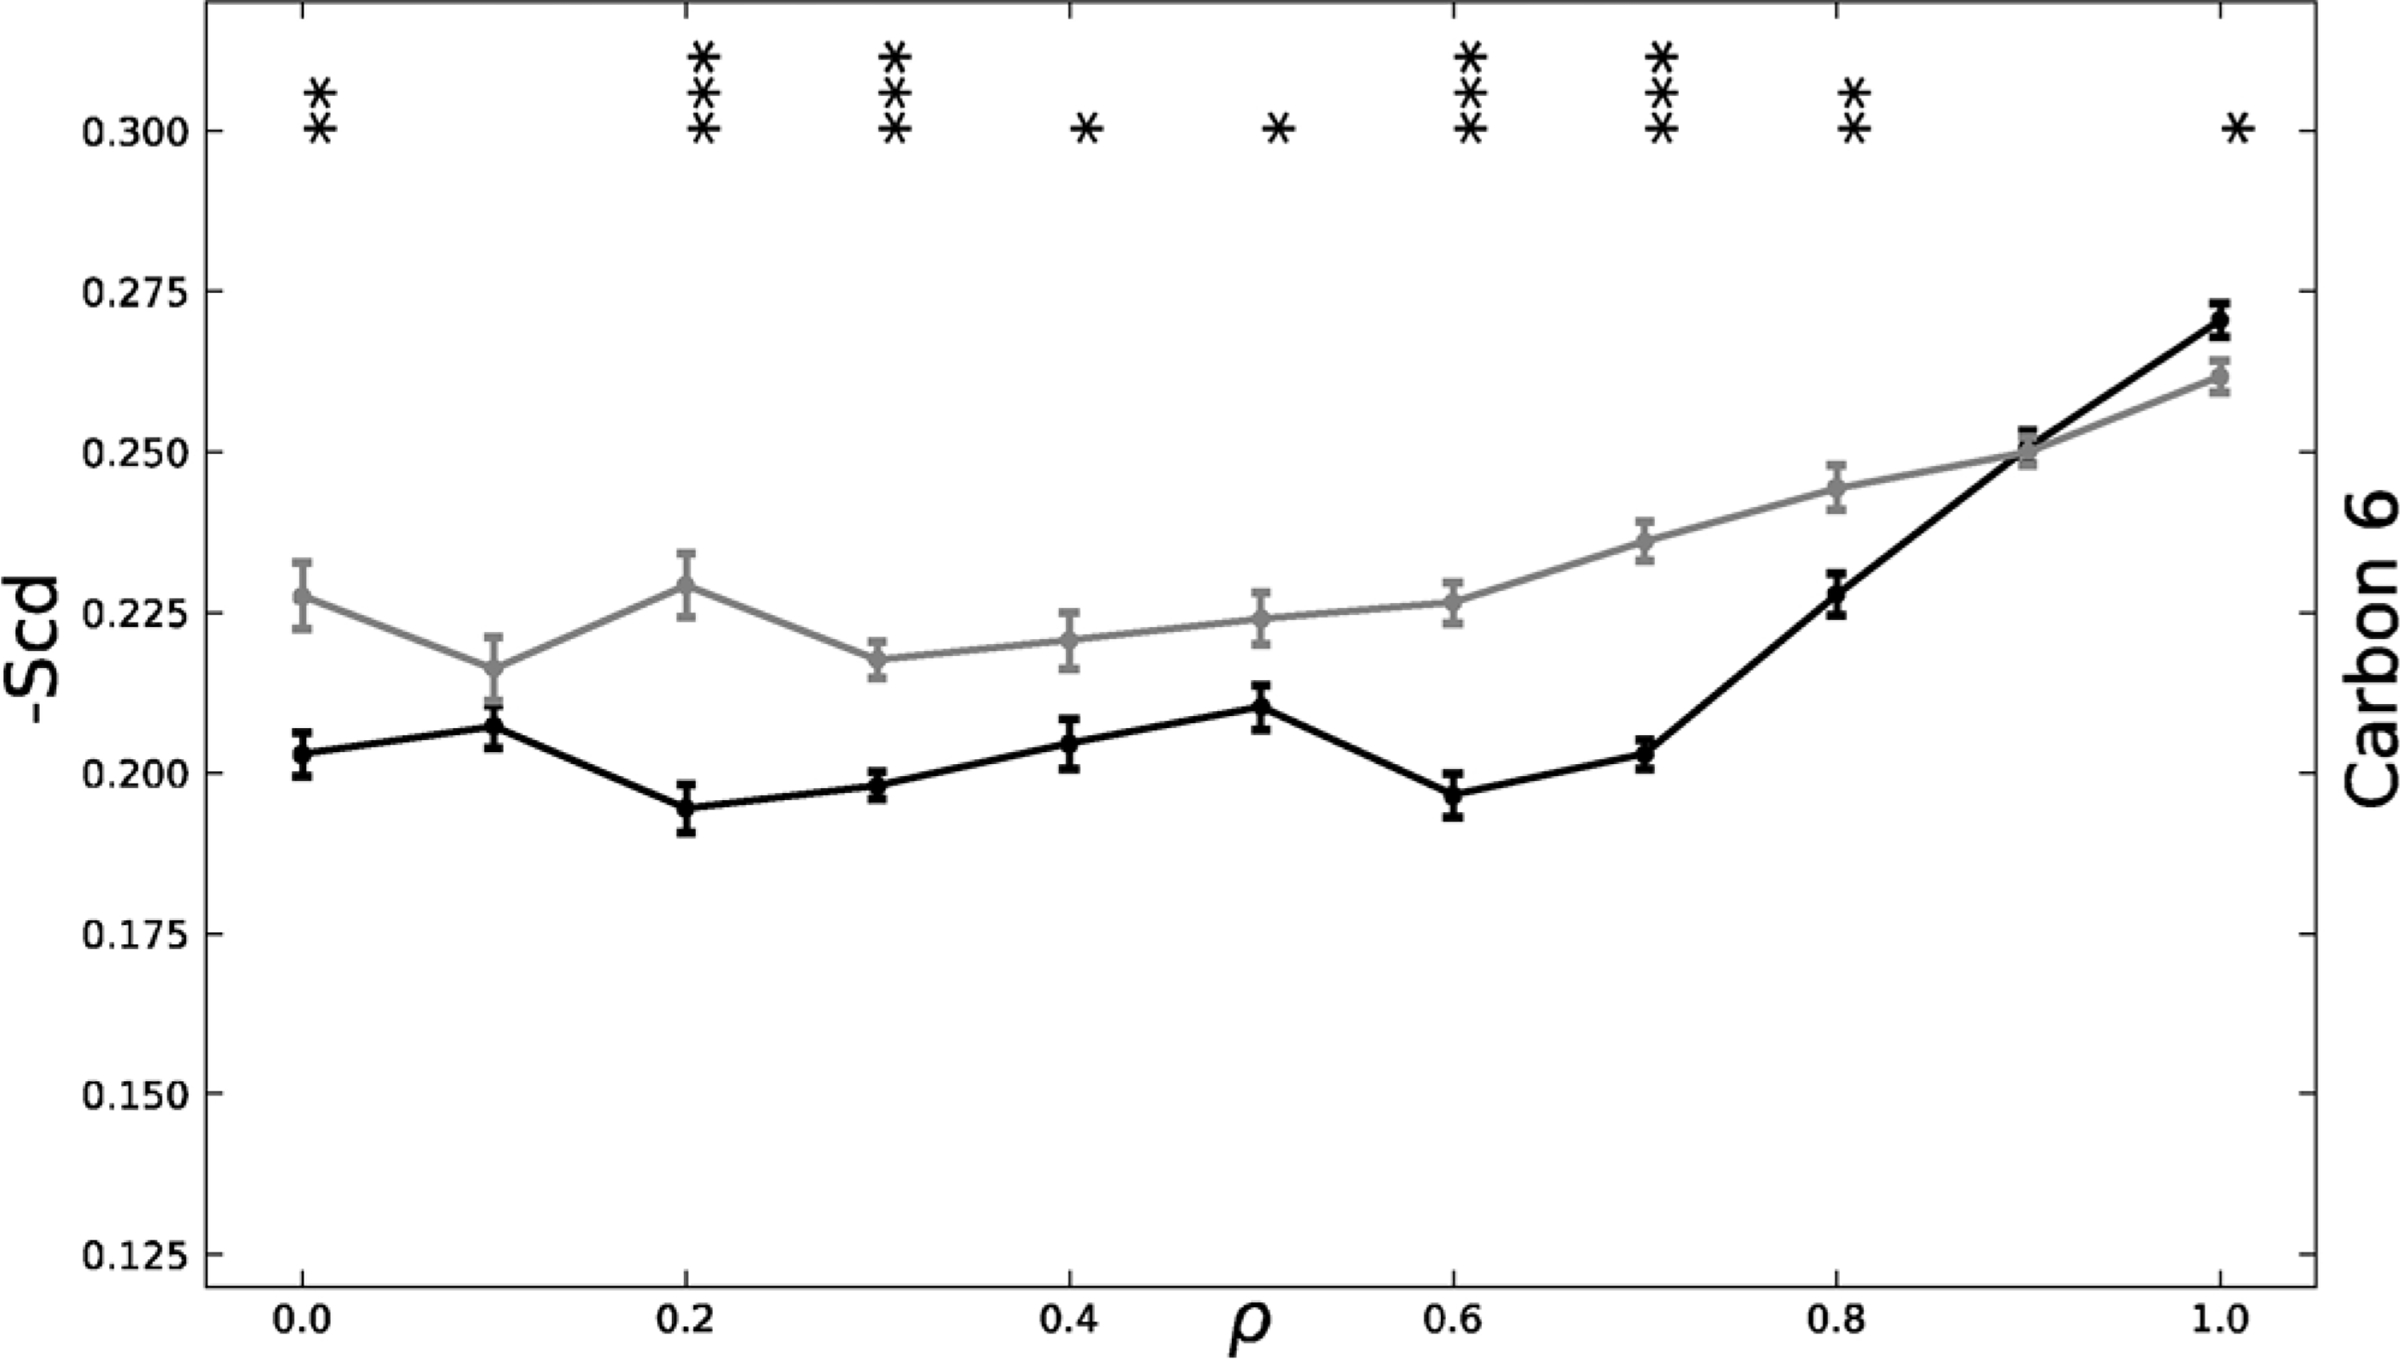
Carbon 6 of sn-1 DBPC -Scd chain graphed across the? trajectory for the symmetric (black) and asymmetric (grey) systems. The asymmetric system shows a more monotonic shift in increasing -Scd, indicating a more monotonic shift in DBPC ordering. The symmetric system -Scd remains relatively constant until, ρ*, at which it more sharply increases. *p < .05, **p < .01, ***p < .001. p-values were calculated using a two-tailed z-test. Standard error is shown.
In contrast, the symmetric -Scd remains constant until approximately ρ* = 0.7. Then the order parameter sharply increases. These symmetric order parameter findings further validate the sharp shift from nanodomains to macrodomains at ρ* as shown in Fig. 1. This shift in order parameter is correlated with the registration data in Fig. 3. Once there is high registration, which occurs after ρ*, exoplasmic DBPC is more likely to reside across from cytoplasmic DBPC in an Lo domain, leading to increased ordering of the hydrocarbon chains of the DBPCs.
The sharp shift in the symmetric DBPC order parameter caused by registration indicates that DIPC and PIPC have large disordering effects compared to the ordering effect of DBPC upon itself. Yet, POPE/POPS/chol creates little disordering when compared to the ordering of DBPC in an Lo phase. This shows that cytoplasmic leaflet DIPC and PIPC induce much more disordering than does POPE/POPS/chol, indicating the latter mixture’s relatively high order. A cytosolic model leaflet using the relatively disordered DOPC/chol shifts the transition of nano to macro domains to higher ρ value (Enoki and Feigenson, 2019), perhaps by making less favorable the formation of ordered Lo domains.
The sharp shift in symmetric DBPC order parameter can also be seen in Supplemental Fig. 1, with the monotonic shift in asymmetric DBPC order parameter is displayed in Supplemental Fig. 2.
3.5. UA POPE order parameter
Order parameter was also calculated for the sn-1 chain of the cytoplasmic POPE lipids of the asymmetric system. This calculation used the carbon-deuterium order parameter, as in Section 3.3. However, the POPE lipids were first determined to be across from either an Lo or Ld exoplasmic phase. Subsequently the order parameter was calculated.
Fig. 8 displays the POPE cytoplasmic leaflet order parameter for POPE across from Lo and across from Ld. At ρ = 1, the POPE across from Lo exhibit a slightly higher order parameter than those across from Ld. This difference in order parameter is most evident between carbon 4 to carbon 9. This difference can also be seen in Fig. 9, where carbon 6 for the sn-1 POPE chain is graphed across the ρ trajectory. However, for the majority of the ρ trajectory, POPE across from Lo or Ld exhibit roughly the same order. Only at ρ = 1, is there any indication of order difference between POPE across from Lo or Ld as seen by Weiner and Feigenson in 2019. (Weiner and Feigenson, 2019) This difference at high ρ values can be attributed to the need for very large domains in exoplasmic leaflets to induce POPE ordering.
Fig. 8.
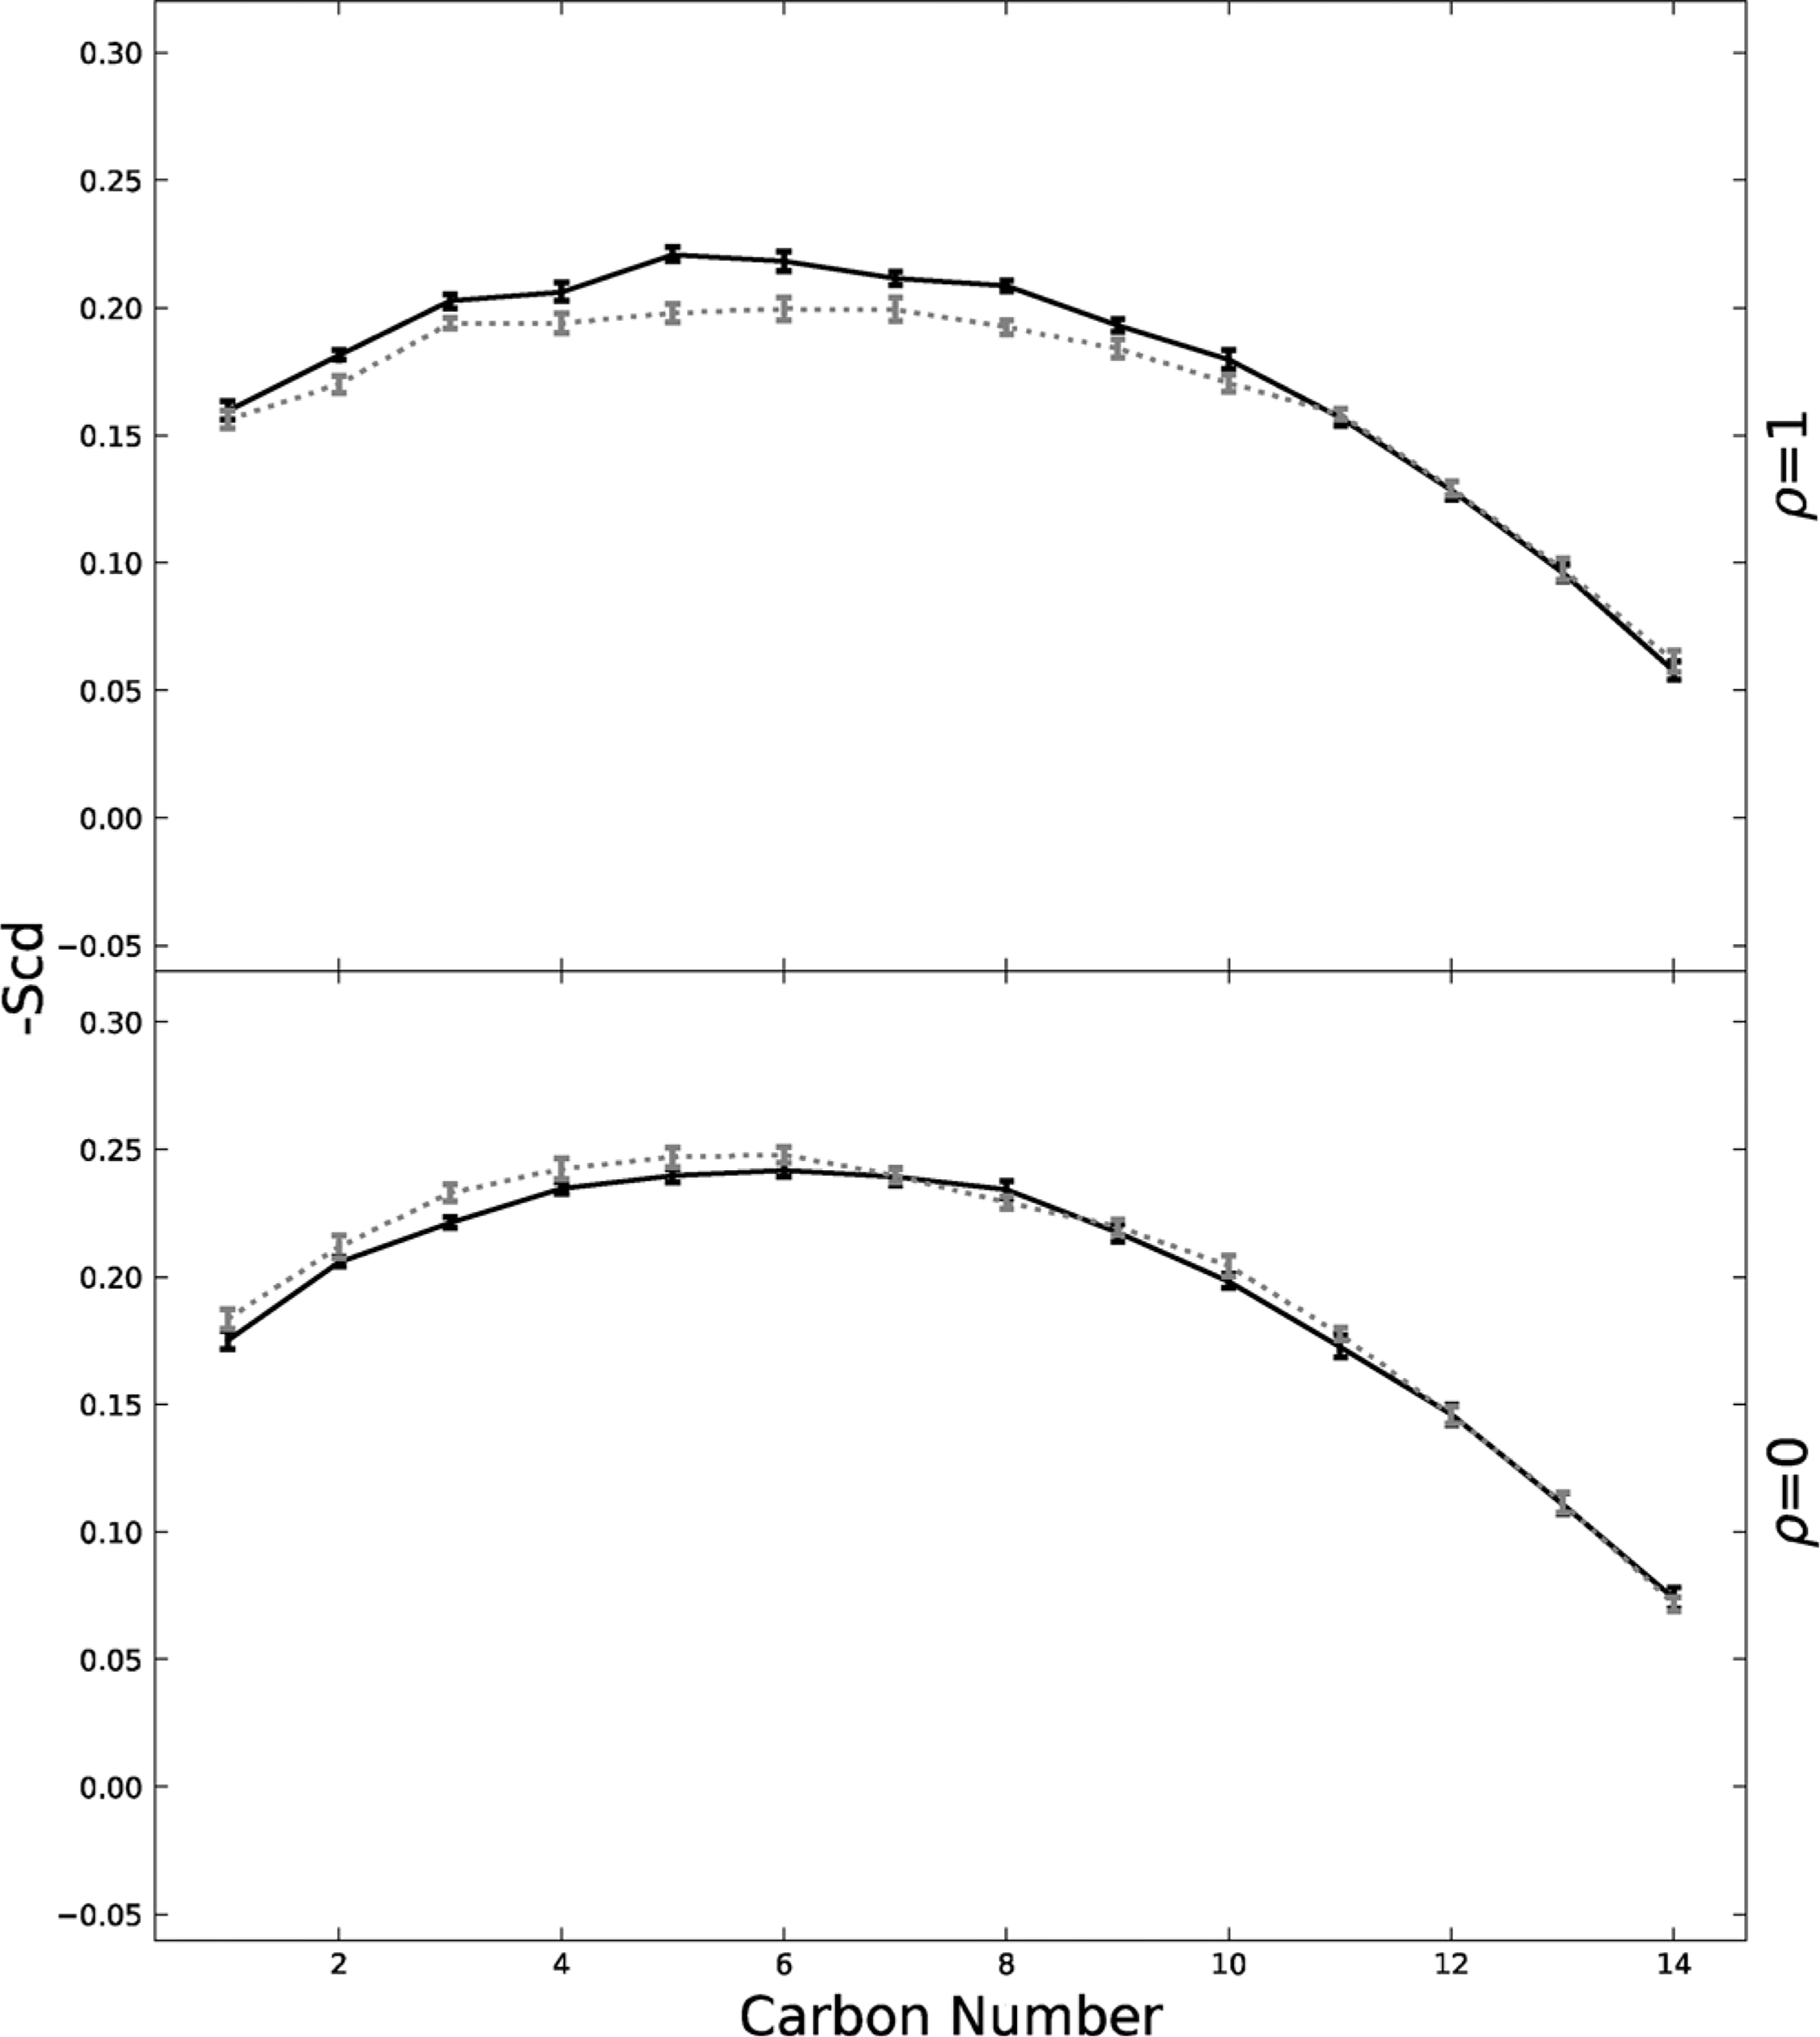
Order parameter for sn-1 chain asymmetric, cytoplasmic POPE lipids graphed for ρ = 0 and ρ = 1. POPE lipids across from exoplasmic Lo phases are graphed in black. POPE lipids across from exoplasmic Ld phases are grey and dashed. Standard error is shown.
Fig. 9.
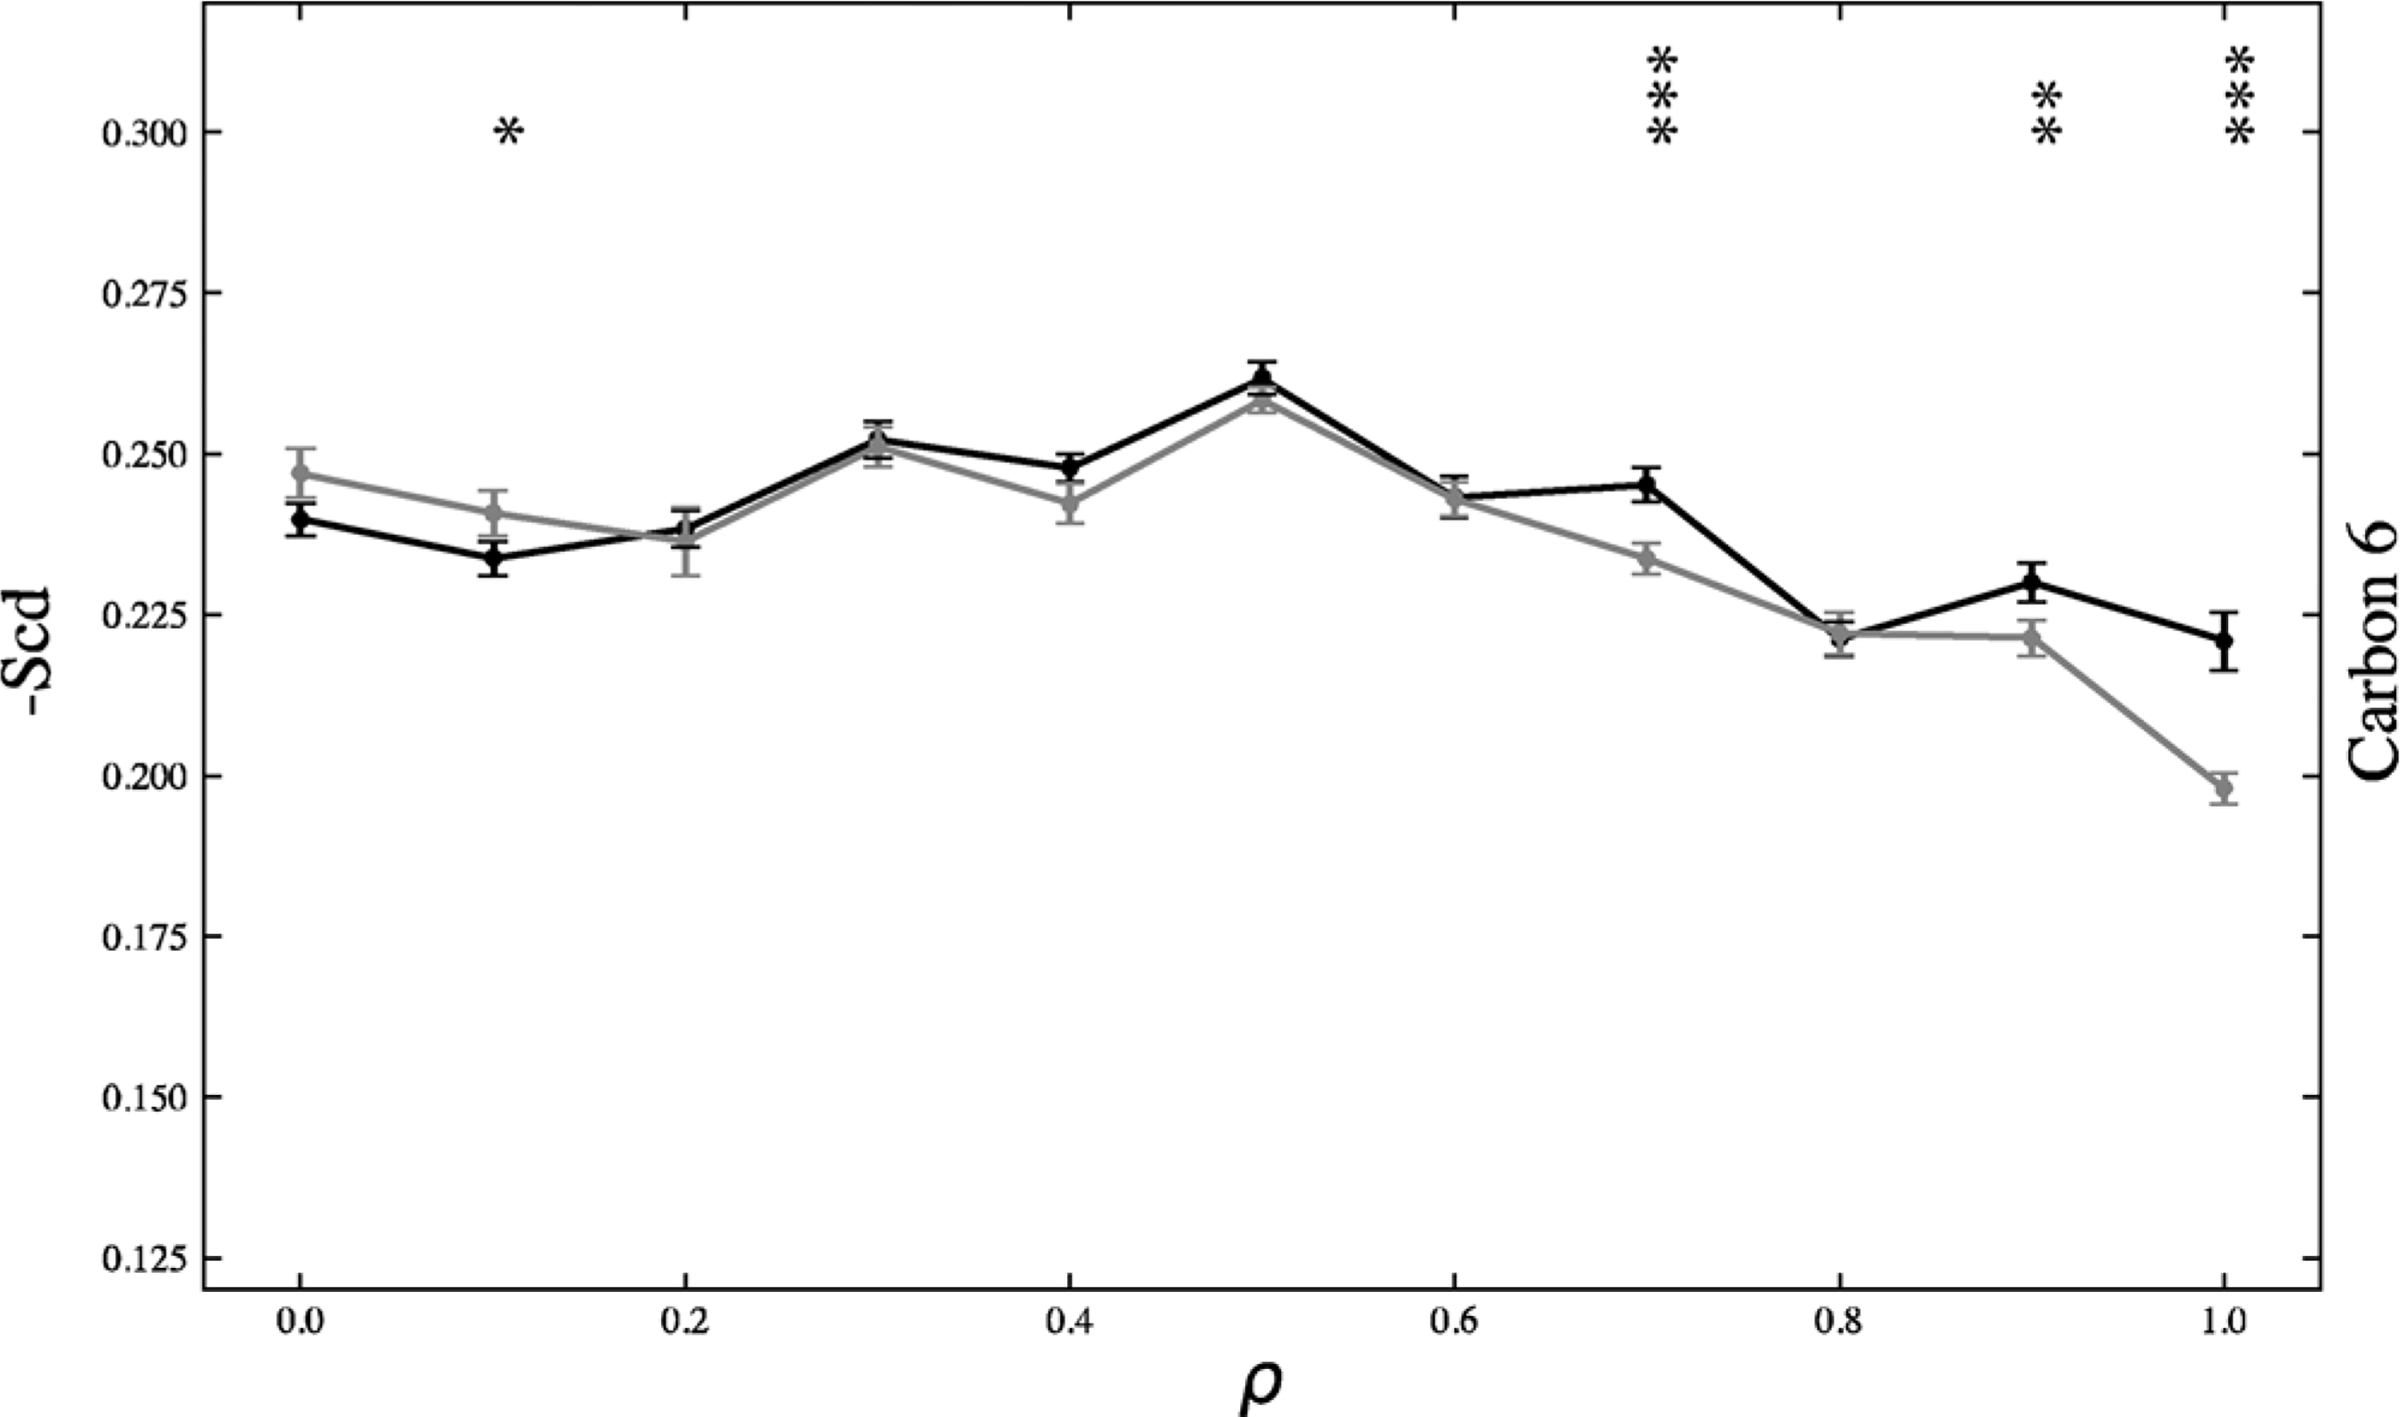
Carbon 6 -Scd for sn-1 chain asymmetric, cytoplasmic POPE lipids graphed across the ρ trajectory. POPE across from exoplasmic Lo phases are black and POPE across from exoplasmic Ld phases are grey. *p < .05, **p < .01, ***p < .001. p-values were calculated using a two-tailed z-test. Standard error is shown.
Fig. 8 also shows that at ρ = 0, POPE across from Lo and Ld have very similar order parameters. This is likely due to the exoplasmic nanodomains in which these lipids reside across from being so small that they hardly affect the POPE order parameter.
The order parameter for the sn-1 chain of POPE across from Lo over the ρ trajectory is displayed in Supplemental Fig. 3. Likewise, the sn-1 chain of POPE across from Ld over the ρ trajectory is shown in Supplemental Fig. 4.
4. Conclusions
We found that compositionally asymmetric bilayers with a single-phase POPE/POPS/chol model cytoplasmic leaflet and a phase-separating DBPC/PIPC + DIPC/chol model exoplasmic leaflet form macrodomains in the exoplasmic leaflet at lower ρ values than found in the symmetric DBPC/PIPC + DIPC/chol. While registration is a crucial requirement for macrodomain formation in symmetric systems, asymmetric systems inherently have no registration, and macrodomains form at lower ρ values for the cytoplasmic leaflet POPE/POPS/chol. However, natural plasma membranes have extensive polyunsaturation in the cytoplasmic leaflet. The model leaflet we studied, POPE/POPS/chol, is relatively ordered, and the change in ρ* value might depend on properties of the particular leaflets, and perhaps especially on the order of that cytosolic leaflet model.
There is little difference in chol distribution between symmetric and asymmetric systems. Symmetric Lo and asymmetric Lo domains have roughly equivalent chol composition. Symmetric Ld and asymmetric Ld domains also have roughly equivalent chol composition. Though, Lo and Ld domains have very different chol compositions. Also, being across from Lo or Ld has only a small effect on local chol concentration in the asymmetric cytoplasmic leaflet. Measurements of chol concentration per leaflet indicate there is little chol redistribution between leaflets in both symmetric and asymmetric systems.
Order parameter data for the sn-1 chain of DBPC show that symmetric macrodomain formation occurs sharply with increasing ρ once registration is achieved, whereas asymmetric macrodomain formation is more gradual. Likewise, DBPC order parameter shows that symmetric and asymmetric macro Lo domains are similarly ordered. Order parameter data for the sn-1 chain of POPE indicates that POPE has similar order across from Lo and from Ld. Once exoplasmic domains are big enough, there is a slight order difference in which POPE across from Lo is more ordered than POPE across from Ld.
We chose to build model systems with 20 mol % chol in order to facilitate comparison with the many other studies examining this composition, which produces maximally distinct Lo and Ld phases. Future studies could build upon this one by increasing the chol composition to a more physiologically relevant 35–0 mol % and by using an asymmetric model cytoplasmic leaflet which contains polyunsaturated PE and PS lipids. Previous work has shown that increasing cholesterol concentration changes registration behavior in symmetric systems (Weiner and Feigenson, 2018), which may affect the domain size transition in asymmetric compositions. A prior MD study has shown only a small effect for polyunsaturated lipids (Weiner and Feigenson, 2019), but their role in the domain size transition has not yet been explored.
Our study utilizes MD to elucidate the effects of asymmetry on macroscopic domain formation, order parameter, and chol concentrations. By adopting the more physiologically relevant asymmetric membrane as a model, we have found that asymmetry plays a significant role in membrane structure and is a crucial requirement to better understand membrane rafts and how a cell may control their presence on its surface.
Transparency document
The Transparency document associated with this article can be found in the online version.
Supplementary Material
Acknowledgements
This work was supported by funding from the U.S. National Science Foundation (MCB-1410926) and the U.S. National Institutes of Health (GM105684) to G.W.F. This work also used the Extreme Science and Engineering Discovery Environment (XSEDE), (Towns et al., 2014) which is supported by National Science Foundation grant number ACI-1548562, on Bridges at the Pittsburgh Supercomputing Center (TG-MCB130010 to G.W.F.). M.D.W. was supported in part by NIH Training <GN4>T</GN4>32-GM08267. The authors thank S.J. Marrink for useful conversations.
Footnotes
Appendix A. Supplementary data
Supplementary material related to this article can be found, in the online version, at doi:https://doi.org/10.1016/j.chemphyslip.2020.104972.
References
- Abraham MJ, et al. , 2015. Gromacs: high performance molecular simulations through multi-level parallelism from laptops to supercomputers. SoftwareX 1–2, 19–25. [Google Scholar]
- Ackerman DG, Feigenson GW, 2015. Multiscale modeling of four-component lipid mixtures: domain composition, size, alignment, and properties of the phase interface. J. Phys. Chem. B 119, 4240–4250. [DOI] [PMC free article] [PubMed] [Google Scholar]
- Ackerman DG, Feigenson GW, 2016. Effects of transmembrane α-helix length and concentration on phase behavior in four-component lipid mixtures: a molecular dynamics study. J. Phys. Chem. B 120, 4064–4077. [DOI] [PubMed] [Google Scholar]
- Aude de Gassart Charles Géminard, Benoit Féevrier Graça Raposo, Exosomes MV, 2003. Lipid raft–associated protein sorting in exosomes. Blood 102, 4336–4343. [DOI] [PubMed] [Google Scholar]
- Berendsen HJC, Postma JPM, Gunsteren W, van F, Hermans J, 1981. Interaction Models for Water in Relation to Protein Hydration, pp. 331–342. 10.1007/978-94-015-7658-1_21. [DOI]
- Berger O, Edholm O, Jähnig F, 1997. Molecular dynamics simulations of a fluid bilayer of dipalmitoylphosphatidylcholine at full hydration, constant pressure, and constant temperature. Biophys. J 72, 2002–2013. [DOI] [PMC free article] [PubMed] [Google Scholar]
- Brown DA, London E, 1998. Functions of lipid rafts in biological membranes. Annu. Rev. Cell Dev. Biol 14, 111–136. [DOI] [PubMed] [Google Scholar]
- Brown DA, Rose JK, 1992. Sorting of GPI-anchored proteins to glycolipid-enriched membrane subdomains during transport to the apical cell surface. Cell 68, 533–544. [DOI] [PubMed] [Google Scholar]
- Bussi G, Donadio D, Parrinello M, 2007. Canonical sampling through velocity rescaling. J. Chem. Phys 126. [DOI] [PubMed] [Google Scholar]
- Darden T, York D, Pedersen L, 1993. Particle mesh Ewald: an N·log(N) method for Ewald sums in large systems. J. Chem. Phys 98, 10089–10092. [Google Scholar]
- De Jong DH, et al. , 2013. Improved parameters for the martini coarse-grained protein force field. J. Chem. Theory Comput 9, 687–697. [DOI] [PubMed] [Google Scholar]
- Doktorova M, Weinstein H, 2018. Accurate in silico modeling of asymmetric bilayers based on biophysical principles. Biophys. J 115, 1638–1643. [DOI] [PMC free article] [PubMed] [Google Scholar]
- Devaux Philippe F., Morris R, 2004. Transmembrane asymmetry and lateral domains in biological membranes. Traffic 241–246. 10.1111/j.1600-0854.2004.00170.x. [DOI] [PubMed] [Google Scholar]
- Doktorova M, et al. , 2018. Preparation of asymmetric phospholipid vesicles for use as cell membrane models. Nat. Protoc 13, 2086–2101. [DOI] [PMC free article] [PubMed] [Google Scholar]
- Enoki TA, Feigenson GW, 2019. Asymmetric Bilayers by Hemifusion: Method and Leaflet Behaviors, 14 10.1016/j.bpj.2019.07.054. [DOI] [PMC free article] [PubMed] [Google Scholar]
- Essmann U, et al. , 1995. A smooth particle mesh Ewald method. J. Chem. Phys 103, 8577–8593. [Google Scholar]
- Fadeel B, Xue D, 2009. The ins and outs of phospholipid asymmetry in the plasma membrane: roles in health and disease. Crit. Rev. Biochem. Mol. Biol 44, 264–277. [DOI] [PMC free article] [PubMed] [Google Scholar]
- Feller SE, 2000. Molecular dynamics simulations of lipid bilayers. Curr. Opin. Colloid Interface Sci 5, 217–223. [Google Scholar]
- Fowler PW, Williamson JJ, Sansom MSP, Olmsted PD, 2016. Roles of Interleaflet Coupling and Hydrophobic Mismatch in Lipid Membrane Phase-Separation Kinetics. 10.1021/jacs.6b04880. [DOI] [PMC free article] [PubMed]
- Goh SL, Amazon JJ, Feigenson GW, 2013. Toward a better raft model: modulated phases in the four-component bilayer, DSPC/DOPC/POPC/CHOL. Biophys. J 104, 853–862. [DOI] [PMC free article] [PubMed] [Google Scholar]
- Gross LCM, Heron AJ, Baca SC, Wallace MI, 2011. Determining membrane capacitance by dynamic control of droplet interface bilayer area. Langmuir 27, 14335–14342. [DOI] [PubMed] [Google Scholar]
- Hakobyan D, Heuer A, 2013. Phase separation in a lipid/cholesterol system: comparison of coarse-grained and united-atom simulations. J. Phys. Chem. B 117, 3841–3851. [DOI] [PubMed] [Google Scholar]
- Harayama T, Riezman H, 2018. Of membrane lipid composition. Nat. Publ. Gr 19, 281–296. [DOI] [PubMed] [Google Scholar]
- Heberle FA, et al. , 2013. Hybrid and nonhybrid lipids exert common effects on membrane raft size and morphology. J. Am. Chem. Soc 135, 14932–14935. [DOI] [PubMed] [Google Scholar]
- Hess B, Bekker H, Berendsen HJC, Fraaije JGEM, 1997. LINCS: a linear constraint solver for molecular simulations. Journal of Computational Chemistry. J. Comput. Chem 18, 1463–1472. [Google Scholar]
- Hess B, Kutzner C, Van Der Spoel D, Lindahl E, 2008. GRGMACS 4: algorithms for highly efficient, load-balanced, and scalable molecular simulation. J. Chem. Theory Comput 4, 435–447. [DOI] [PubMed] [Google Scholar]
- Huang Z, London E, 2013. Effect of cyclodextrin and membrane lipid structure upon cyclodextrin-lipid interaction. Langmuir 29, 14631–14638. [DOI] [PubMed] [Google Scholar]
- Humphrey W, Dalke A, Schulten K, 1996. Sartorius products. J. Mol. Graph 14, 33–38. [DOI] [PubMed] [Google Scholar]
- Ingólfsson HI, et al. , 2014. The power of coarse graining in biomolecular simulations. Wiley Interdiscip. Rev. Comput. Mol. Sci 4, 225–248. [DOI] [PMC free article] [PubMed] [Google Scholar]
- Kiessling V, Wan C, Tamm LK, 2009. Domain coupling in asymmetric lipid bilayers. Biochim. Biophys. Acta Biomembr 1788, 64–71. [DOI] [PMC free article] [PubMed] [Google Scholar]
- Konyakhina TM, Wu J, Mastroianni JD, Heberle FA, Feigenson GW, 2013. Phase diagram of a 4-component lipid mixture: DSPC/DOPC/POPC/chol. Biochim. Biophys. Acta Biomembr 1828, 2204–2214. [DOI] [PMC free article] [PubMed] [Google Scholar]
- Korlach J, Schwille P, Webb WW, Feigenson GW, 1999. Characterization of lipid bilayer phases by confocal microscopy and fluorescence correlation spectroscopy. Proc. Natl. Acad. Sci. U. S. A 96, 8461–8466. [DOI] [PMC free article] [PubMed] [Google Scholar]
- Lin Q, London E, 2014. Preparation of artificial plasma membrane mimicking vesicles with lipid asymmetry. PLoS One 9. [DOI] [PMC free article] [PubMed] [Google Scholar]
- Lingwood D, Simons K, 2010. Lipid rafts As a membrane-. Science 327 (80), 46–50. [DOI] [PubMed] [Google Scholar]
- Marrink SJ, de Vries AH, Mark AE, 2004. Coarse grained model for semiquantitative lipid simulations. J. Phys. Chem. B 108, 750–760. [Google Scholar]
- Marrink SJ, Risselada HJ, Yefimov S, Tieleman DP, De Vries AH, 2007. The MARTINI force field: coarse grained model for biomolecular simulations. J. Phys. Chem. B 111, 7812–7824. [DOI] [PubMed] [Google Scholar]
- McGibbon RT, et al. , 2015. MDTraj: A Modern Open Library for the Analysis of Molecular Dynamics Trajectories. Biophys. J 109, 1528–1532. [DOI] [PMC free article] [PubMed] [Google Scholar]
- Melo MN, Ingólfsson HI, Marrink SJ, 2015. Parameters for Martini sterols and hopanoids based on a virtual-site description. J. Chem. Phys 143. [DOI] [PubMed] [Google Scholar]
- Mondal M, Mesmin B, Mukherjee S, Maxfield F, 2008. Uncoupling stress granule assembly and translation initiation inhibition. Mol. Biol. Cell 20, 2673–2683. [DOI] [PMC free article] [PubMed] [Google Scholar]
- Mukhopadhyay P, Monticelli L, Tieleman DP, 2004. Molecular dynamics simulation of a palmitoyl-oleoyl phosphatidylserine bilayer with Na+ counterions and NaCl. Biophys. J 86, 1601–1609. [DOI] [PMC free article] [PubMed] [Google Scholar]
- Oostenbrink C, Villa A, Mark AE, Van Gunsteren WF, 2004. A biomolecular force field based on the free enthalpy of hydration and solvation: the GROMOS force-field parameter sets 53A5 and 53A6. J. Comput. Chem 25, 1656–1676. [DOI] [PubMed] [Google Scholar]
- Op den Kamp JA, 1979. Lipid asymmetry. Annu. Rev. Biophys 48, 47–71. [DOI] [PubMed] [Google Scholar]
- Parrinello M, Rahman A, 1981. Polymorphic transitions in single crystals: a new molecular dynamics method. J. Appl. Phys 52, 7182–7190. [Google Scholar]
- Pautot S, Frisken BJ, Weitz DA, 2003a. Giant Vesicle] Engineering Asymmetric vesicles.pDf. 100. [DOI] [PMC free article] [PubMed]
- Pautot S, Frisken BJ, Weitz DA, 2003b. Production of unilamellar vesicles using an inverted emulsion. Langmuir 19, 2870–2879. [Google Scholar]
- Piggot TJ, Allison JR, Sessions RB, Essex JW, 2017. On the Calculation of Acyl Chain Order Parameters From Lipid Simulations. 10.1021/acs.jctc.7b00643. [DOI] [PubMed]
- Qi Y, et al. , 2015. CHARMM-GUI martini maker for coarse-grained simulations with the martini force field. J. Chem. Theory Comput 11, 4486–4494. [DOI] [PubMed] [Google Scholar]
- Quinn PJ, 2002. Plasma membrane phospholipid asymmetry. Subcell. Biochem 36, 39–60. [DOI] [PubMed] [Google Scholar]
- Schroeder F, 1984. Role of membrane lipid asymmetry in aging. Neurobiol. Aging 5, 323–333. [DOI] [PubMed] [Google Scholar]
- Simons K, Gerl MJ, 2010. Revitalizing membrane rafts: new tools and insights. Nat. Rev. Mol. Cell Biol 11, 688–699. [DOI] [PubMed] [Google Scholar]
- Simons K, Ikonen E, 1997. Functional rafts in cell membranes. Nature 387, 569–572. [DOI] [PubMed] [Google Scholar]
- Simons K, Vaz WLC, 2004. Model systems, lipid rafts, and cell membranes. Annu. Rev. Biophys. Biomol. Struct 33, 269–295. [DOI] [PubMed] [Google Scholar]
- Sunhwan JO, Taehoon KIM, I.yer Vidyashankara G, Charmm-gui WI, 2008. A web-based graphical user interface for CHARMM SUNHWAN. J. Comput. Chem 29, 1859–1865. [DOI] [PubMed] [Google Scholar]
- Szente L, Fenyvesi É, 2017. Cyclodextrin-lipid complexes: cavity size matters. Struct. Chem 28, 479–492. [Google Scholar]
- Tieleman DP, Berendsen HJC, 1996. Molecular dynamics simulations of a fully hydrated dipalmitoylphosphatidylcholine bilayer with different macroscopic boundary conditions and parameters. J. Chem. Phys 105, 4871–4880. [Google Scholar]
- Towns J, et al. , 2014. XSEDE: accelerating scientific discovery. Comput. Sci. Eng 16, 62–74. [Google Scholar]
- Usery RD, et al. , 2017. Line tension controls liquid-disordered + liquid-ordered domain size transition in lipid bilayers. Biophys. J 112, 1431–1443. [DOI] [PMC free article] [PubMed] [Google Scholar]
- Van Meer G, Voelker DR, Feigenson GW, 2009. Membrane lipids: where they are. Nat. Rev. Mol. Cell Biol 101, 1–4. [DOI] [PMC free article] [PubMed] [Google Scholar]
- Verkleij AJ, et al. , 1973. The asymmetric distribution of phospholipids in the human red cell membrane. Bba 21, 1154–1157. [DOI] [PubMed] [Google Scholar]
- Visco I, Chiantia S, Schwille P, 2014. Asymmetric supported lipid bilayer formation via methyl-β-cyclodextrin mediated lipid exchange: Influence of asymmetry on lipid dynamics and phase behavior. Langmuir 30, 7475–7484. [DOI] [PubMed] [Google Scholar]
- Wang Q, London E, 2018. Lipid structure and composition control consequences of interleaflet coupling in asymmetric vesicles. Biophys. J 115, 664–678. [DOI] [PMC free article] [PubMed] [Google Scholar]
- Wassenaar TA, Pluhackova K, Böckmann RA, Marrink SJ, Tieleman DP, 2014. Going backward: a flexible geometric approach to reverse transformation from coarse grained to atomistic models. J. Chem. Theory Comput 10, 676–690. [DOI] [PubMed] [Google Scholar]
- Weiner MD, Feigenson GW, 2018. Presence and role of midplane cholesterol in lipid bilayers containing registered or antiregistered phase domains. J. Phys. Chem. B 122, 8193–8200. [DOI] [PubMed] [Google Scholar]
- Weiner MD, Feigenson GW, 2019. Molecular Dynamics Simulations Reveal Leaflet Coupling in Compositionally Asymmetric Phase-Separated Lipid Membranes. J. Phys. Chem. B 123, 3968–3975. [DOI] [PubMed] [Google Scholar]
- Zidovetzki R, Levitan I, 2007. Use of cyclodextrins to manipulate plasma membrane cholesterol content: evidence, misconceptions and control strategies. Biochim. Biophys. Acta Biomembr 1768, 1311–1324. [DOI] [PMC free article] [PubMed] [Google Scholar]
Associated Data
This section collects any data citations, data availability statements, or supplementary materials included in this article.


