Abstract
Transition metal oxides are known as the active materials for capacitors. As a class of transition metal oxide, Magnéli phase TiOx is particularly attractive because of its excellent conductivity. This work investigated the electrochemical characteristics of TiOx and its composite with reduced graphene oxide (rGO). Two types of TiOx, i.e. low and high reduction extent, were employed in this research. Electrochemical impedance spectroscopy revealed that TiOx with lower reduction extent delivered higher electro-activity and charge transfer resistance at the same time. However, combining 10% of low-reduction state TiOx and rGO using a simple mixing process delivered a high specific capacitance (98.8 F g−1), which was higher than that of standalone rGO (49.5 F g−1). A further improvement in the specific capacitance (102.6 F g−1) was given by adding PEDOT:PSS conductive polymer. Results of this research gave a basic understanding in the electrochemical behavior of Magnéli phase TiOx for the utilization of this material as supercapacitor in the future.
This work investigated the electrochemical characteristics of TiOx and its composite with reduced graphene oxide.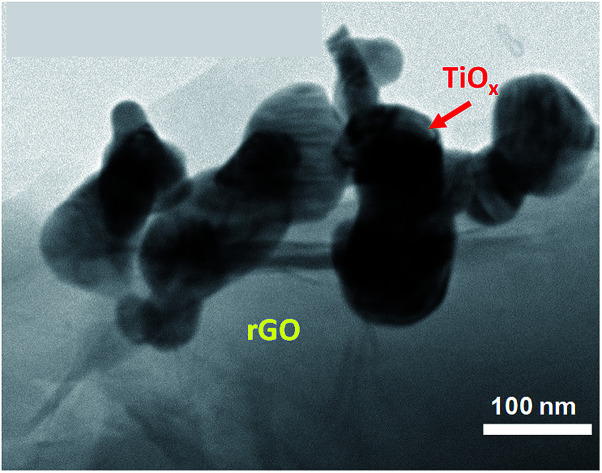
Introduction
Supercapacitors have recently been considered as a new candidate for energy storage. They have a long cycle life with high power density due to a fast charge–discharge process, and simple operating principle. A supercapacitor is expected to deliver an acceptable energy density (>10 W h kg−1), excellent cyclability (>100 cycles), fast charge–discharge time, low self-discharging, safe operation, and low cost.1
Based on energy storage mechanism, capacitor is divided into two types, i.e. electrical double layer capacitor (EDLC) and pseudocapacitor. In EDLC, the capacitance is generated from the electrostatic charge accumulated at the electrode–electrolyte interface (non-faradaic process).2 Pseudocapacitors involve the faradaic process, such as redox reactions, for energy storage due to the presence of electro-active species. Pseudocapacitance can be higher than EDL capacitance, but it suffers from the drawback of a low power density and short cycle life. Combination of pseudocapacitive materials and carbon supports leads to a high capacitance value, high rate capability, and good cyclability.1,3
Carbon-based materials, e.g. activated carbons (AC), carbon nanotubes (CNT), are common EDLC electrode materials because of low cost, relatively inert electrochemistry, controllable porosity, high surface area, and high conductivity.1,4,5 Graphene, a class of two-dimensional carbon nanostructure, attracts more attention to be applied as the SC electrode, recently, due to its large specific surface area (2630 m2 g−1), excellent electrical conductivity (∼2000 S cm−1) and fast electronic mobility (∼2 × 105 cm2 V−1 s−1).1,6–9 Reduction of graphene oxide is one promising approach to produce graphene in a large scale.10 As the number of oxygen species in the reduced graphene oxide (rGO) is insignificant, it is reported to have excellent electron conductivity and a large specific surface area. These characteristics render rGO effective as electrode active material of many devices,11,12 including the energy storage devices.11,13–16 Both graphene and rGO, however, often re-stack even after exfoliation process, which furthermore decrease the capacitance value. Compositing graphene or reduced graphene oxide (rGO) with transition metal oxide or conductive polymer is a strategy to minimize the effect of re-stacking, so that it is applicable for supercapacitor applications.17–19
Adding metal oxides, e.g. Fe2O3, Fe3O4, V2O3, V2O5, MnO2, Cu2O, RuO2, NiO, into graphite structure as a composite is reported to increase the energy density, as they act as pseudocapacitive materials.11,13,20–23 In their work, Tomiyasu et al. reported an increase in the energy density from 0.45 W h kg−1 to 28.7 W h kg−1 through the addition of Fe2O3 in the graphite as both negative and positive electrodes could increase the energy density of capacitor from 0.45 W h kg−1 to 28.7 W h kg−1. The addition of Fe3O4 in the negative graphite electrode and MnO2 in the positive graphite electrode increased the energy density of the capacitor up to 27.8 W h kg−1, at the operation voltage of 3.2 V. Metal oxide in the negative electrode adsorbs the electrons during the charging process, while MnO2 in positive electrode is known to effectively emit the electrons.21,22 However, most of the metal oxides face some drawbacks, such as limited reserve, costly raw materials, low electrical conductivity, and poor rate capability during charge–discharge process.
Among the transition metal oxides, titanium oxide is considered to be promising electrode materials for supercapacitor applications due to its pseudocapacitive behavior, chemical stability, eco-friendly, low production cost, and abundant reserve.14,24 However, titanium oxide, just like any other metal oxide, has poor electronic conductivity which limits its use in some applications. Therefore, incorporating of titanium oxide into rGO would overcome the shortcomings in the conductivity and cycling stability of the electrode materials.14,18,19
Some works have been done to improve the capacitance of rGO by incorporating anatase phase of TiO2.14,18,19,24 Xiang and his coworker stated that surface ion adsorption/penetration mainly affected the specific capacitance of TiO2. Nanobelts TiO2 (∼10 nm diameter) had a better contact with the rGO surface and a better exposure to the electrolyte compared to nanoparticles TiO2 (∼138 nm diameter). Moreover, larger contact area between nanobelts TiO2–rGO resulting in better charge carrier (∼4.7 Ω).18 Hybrid composite of graphene–TiO2 by Ramadoss et al. could deliver the specific capacitance up to 113 F g−1.24 Zhang et al. have produced a 3D TiO2–graphene hydrogel and obtained 175 F g−1 at 1 A g−1.25 Kim et al. could produce the rGO/TiOx electrode with specific capacitance of 286 F g−1 at 1 A g−1. However, the electrode material needs to be heat-treated at 600 °C and the capacitance dropped to 93% after 1000 cycles.14 Recently, the work of our group has been focused on the synthesis of electrically conductive Magnéli phase titanium oxide nanoparticles and the observation of their electrochemical properties. The results showed that the TiOx nanoparticle-based electrode had a good cyclability and a stable performance after 1000 cycles during cyclic voltammetry and hence potential to be applied in supercapacitor.26 The electrochemical conductivity of TiOx nanoparticles was reported to be depending on the composition of the Magnéli phase which constitutes the TiOx. The effect of Magnéli phase composition on the overall rGO/TiOx electrochemical properties is yet to be investigated.
In the present work, we investigate the effect of Magnéli phases composition in the titanium oxide (TiOx) and the TiOx particle morphology on the electrochemical properties of rGO/TiOx composite. We used a simple mixing process to produce the composite. Performance of a composite which included conducting polymer PEDOT:PSS27–30 was also evaluated for comparison. This study is expected to complement the current understanding on the rGO/TiOx composite towards the future application of this material in supercapacitor.
Experimental
Materials and methods
Reduced graphene oxide (rGO) powder was synthesized using modified Hummers' method as described in our previous report.12 Two different types of TiOx powder (Table 1) were obtained from Sakai Chemical Industry, Co., Ltd., Osaka, Japan. PEDOT:PSS (1 wt%) was obtained from Sigma Aldrich, USA. Carbon black Super-P and PVDF powder were purchased from MTI, USA. Active material was synthesized by mixing rGO and TiOx using certain rGO/TiOx mass ratios in ethanol solution. The mixture was then dried in an oven at 60 °C for 3 hours. The resulting composite was named A-xx : yy or B-xx : yy where the first letter indicates the TiOx sample used for making the composite, xx and yy represents the rGO and TiOx composition, respectively. Active materials of rGO/TiOx/PEDOT:PSS was prepared by adding PEDOT:PSS into the mixture solution (0.1 µL mL−1).
Characteristic of TiOx.
| Parameters | Sample A | Sample B |
|---|---|---|
| Resistivity | 1.0 × 10⁻¹ | 5.0 × 10⁻¹ |
| BET-SSA | 14 m2 g−1 | 14 m2 g−1 |
| Particle size | 110 nm | 250 nm |
Characterization
The Fourier transform infrared (FTIR) spectroscopy analysis was performed using Bruker Alpha Fourier Transform Infrared (FTIR) Spectrometer, (Bruker Optics, Ltd., Massachusetts, USA) in ATR mode. The X-ray Diffractometer (XRD) patterns were analyzed on a D2 Phaser X-ray diffractometer (Bruker AXS GmbH, Karlsruhe, USA) using Cu Kα radiation (0.154056 nm) and scanning rate at 0.01° s−1. The morphology and crystal structures were observed by SU3500 Scanning Electron Microscope (Hitachi High-Tech. Corp., Tokyo, Japan) and JEM-3000F Transmission Electron Microscope (JEOL, Tokyo, Japan).
Electrochemical characterization
The working electrode was prepared by mixing the 80 wt% of electrode materials with 10 wt% of Super-P carbon black and 10 wt% of PVDF binder in an NMP solution (Sigma Aldrich, USA) to form a slurry. The obtaining slurry was casted on the Al foil current collector cut into a square (1 × 1 cm) dimension and dried at 60 °C for 3 hours in an oven. The electrochemical measurements were performed using a three-electrode system in a 3 M LiOH aqueous solution using a Gamry Reference 1000 potentiostat/galvanostat (Gamry Instruments, Pennsylvania, USA). A platinum wire and Ag/AgCl were used as counter and reference electrode, respectively. All electrochemical tests in this study were conducted at ambient temperature. The electrochemical impedance spectroscopy (EIS) measurements were done by applying an AC voltage of 10 mV amplitude and a frequency range from 10 kHz to 0.1 Hz at open circuit potential. The Nyquist plots obtained from EIS characterization was then analyzed using the equivalent circuit in a Gamry Echem Analyst software. The cyclic voltammetry (CV) tests were done using the same set-up condition, with the scan rate varied from 10–1000 mV s−1. The specific capacitance was obtained by integrating the CV curve area using the same software.
Results and discussion
rGO formation
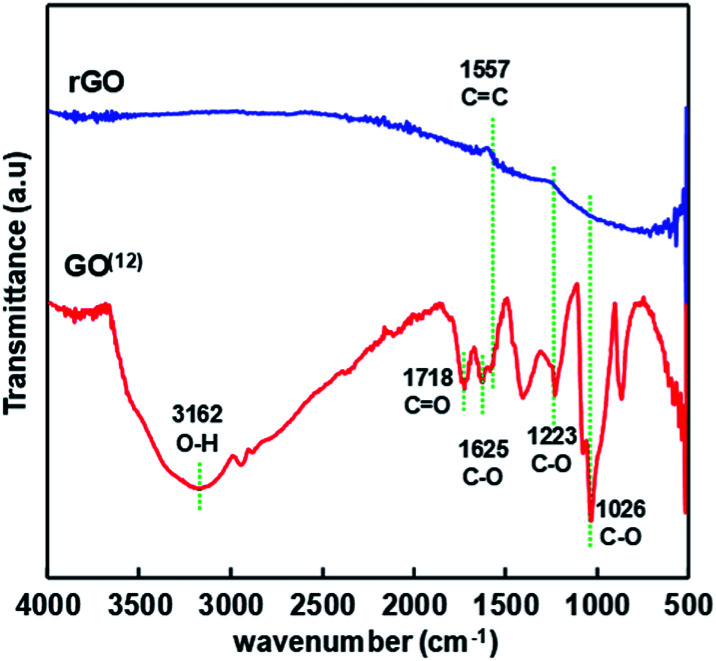
rGO was synthesized by reducing graphene oxide (GO) as described in the other report.12 Hydrazine was employed as an GO reducing agent with the yield of 53%. FTIR spectra depicted in Fig. 1 shows that GO were well reduced. It is indicated by the disappearance of absorbance peaks of O–H group (3162 cm−1), C O (1718 cm−1), and C–O (1625 cm−1, 1223 cm−1, and 1026 cm−1).
Fig. 1. FTIR spectra of GO and rGO.
rGO/TiOx formation
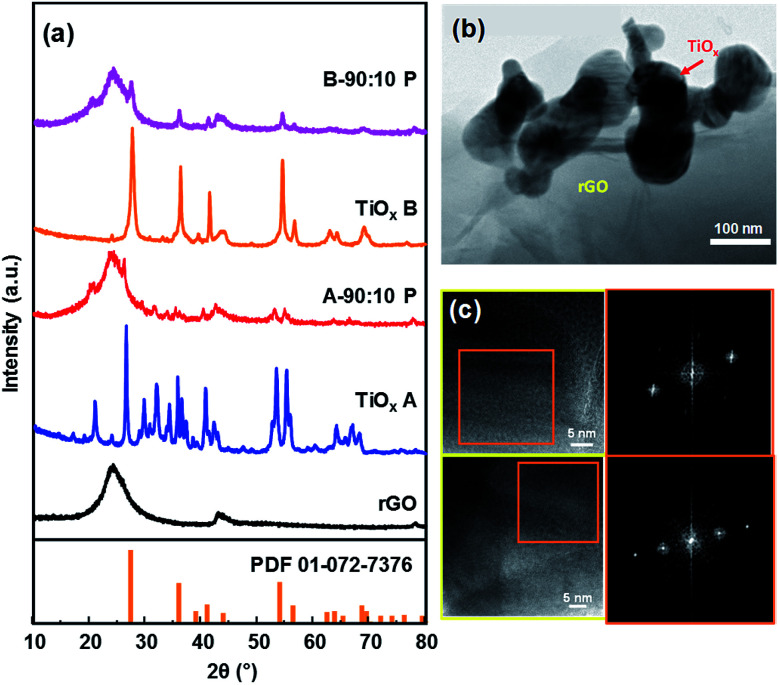
XRD characterization was conducted to further confirm the formation of rGO. The diffraction patterns of rGO is depicted in Fig. 2a, which matched with rGO diffraction.11Fig. 2a also shows the diffraction pattern of TiOx A and TiOx B which are dominated by Magnéli phase of Ti4O7 (ref. 26) and rutile phase of TiO2 (JCPDS card number 00-001-1292), respectively. After impregnation, rGO dominated the diffraction pattern of the samples due to its higher amount. TiOx B showed good stability after heat treatment in oven at 80 °C as the diffraction pattern remained the same (Fig. S1†).
Fig. 2. X-ray diffraction patterns of rGO, TiOx and the composite before and after impregnation (a), TEM image (b) and HR-TEM images and FFT analysis of sample A 90 : 10 (c).
The typical morphology of rGO after impregnation with TiOx particles is shown by TEM image in Fig. 2b. According to this data, the TiOx A particles were successfully attached on the thin layer of rGO with a rGO : TiOx ratio of 90 : 10. It is worth noting that the zeta potentials value of rGO, TiOx A, and TiOx B are −26.2 mV, +1.39 mV, and −4.92 mV, respectively, in ethanol solvent. Therefore, the electrostatically interaction of rGO–TiOx A is expected to be stronger than that in rGO–TiOx B.
To further identify the exist phase of TiOx A in the composite, High-Resolution Transmission Electron Microscope (HR-TEM) observation was conducted. The images are shown in Fig. 2c. Fast Fourier Transform (FFT) analysis of the images show that the detected lattice spacing corresponds to the lattice spacing of TiOx A or Ti4O7 crystal with Magnéli phase at diffraction angles of 16.95°, 31.82°, and 34.14°.
Electrochemical properties
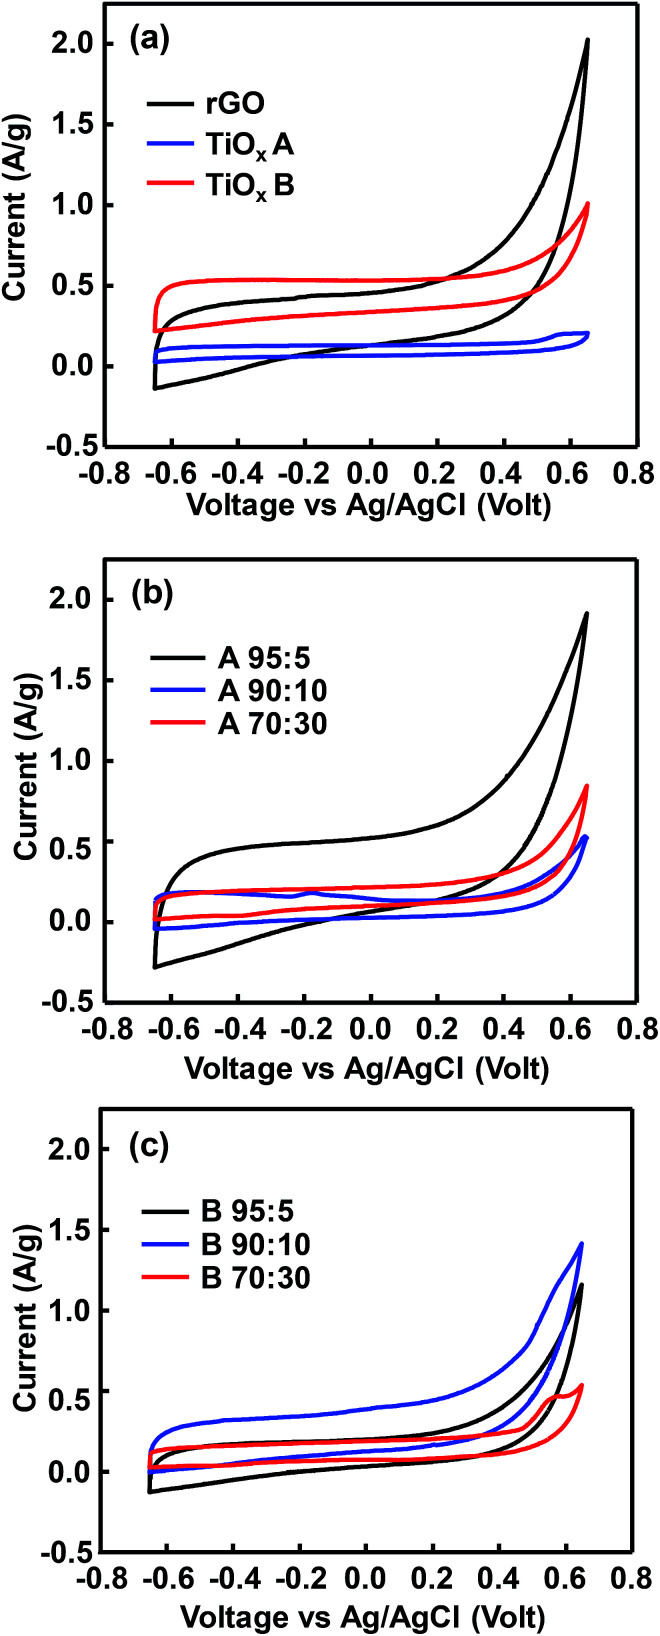
CV curves in Fig. 3a show rectangular shape, which indicates the electric double layer capacitance,32 with a rounded corner which is associated to a pseudocapacitive properties. The observed shoulders in each sample were related to the oxygen-containing group remained in rGO and TiOx. The area under CV curve indicates the amount of electroactive species contained in the electrode.9 Hence, TiOx A contained less electro-active species than TiOx B and rGO. In other words, rutile phase-dominated TiOx exhibited a better electro-active species activity than Magnéli TiOx. However, the significant increase of current at the potentials >0.5 V in rGO sample indicated that the materials were no longer capacitive due to the changes in the electrolyte and/or electrode interface.33
Fig. 3. CV curves of rGO, TiOx A, and TiOx B before impregnation (a), after impregnation of TiOx A (b) and TiOx B (c) to rGO in a variation composition at scan rate of 10 mV s−1.
The CV curve area of rGO after TiOx A addition increased with rGO/TiOx ratio of 95/5 (Fig. 3b). However, after addition of more TiOx (70/30), the curve area was significantly decreased. This phenomenon was also observed in rGO/TiOx B (Fig. 3c). This trend implies that too much addition of TiOx would inhibit the movement of electroactive species because of the lower conductivity.14,18,19,33 The weak anodic–cathodic peaks indicated a weak pseudocapacitive. The small cathodic peaks of sample B were observed at around −0.45 V. The anodic peak was only observed at sample B-90 : 10 at around −0.18 V.
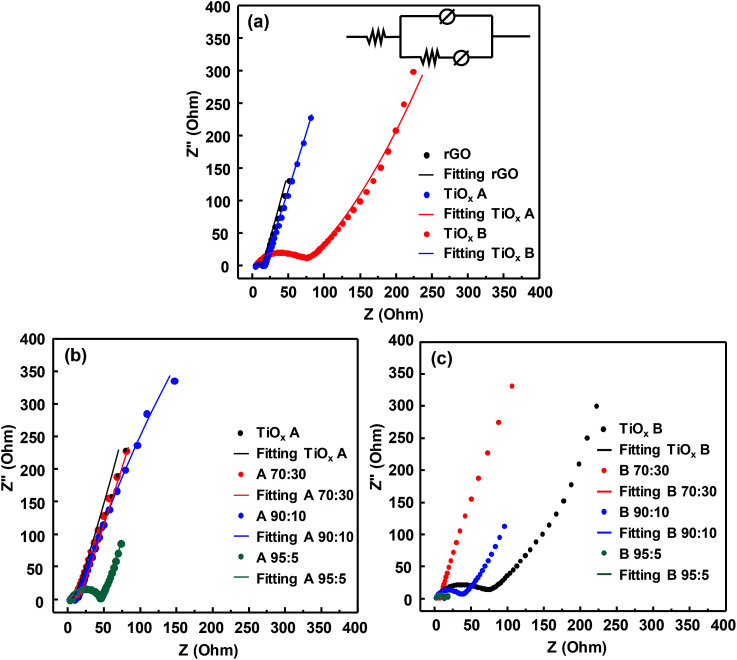
The charge transfers and ion diffusion in the system were investigated using EIS, of which results are shown in the Nyquist plots (Fig. 4). After fitting with an equivalent circuit, the intersection of the semicircle with the x-axis represents the magnitude of ohmic resistance of the electrode and the electrolyte solution (Rs), which is identified at high frequencies. The diameter of the semicircle represents the intrinsic charge transfer resistance (Rct) of the active material. Several factors affecting the total resistance of the electrode system or equivalent series resistance (ESR) are (i) discontinuity of charge transfer processes on the surface of the electrolytes, (ii) the intrinsic resistance of the active material, (iii) the contact resistance between the active material to the current collector, and (iv) resistance caused by faradaic process. The inclined line indicates the diffusion process of electrolyte ions to the active material. The slope of this line represents the rate of diffusion of electrolyte ions; lower slope implies the lower the diffusion rate.31,32
Fig. 4. Nyquist plots of (a) initial materials, (b) sample A and (c) B with various composition. Inset in (a) shows the equivalent circuit of the cell system.
Fig. 4a shows the Nyquist plots of rGO, TiOx A, and TiOx B. The resistance values resulted from the fitting are shown in Table 2. TiOx B had a lower ionic resistance at the electrolyte-active materials interface (Rs = 2.51 Ω). rGO, which is known as a conductive material, exhibited the lowest ionic resistance with Rct of 11.29 Ω in this work. However, the ionic resistance of TiOx B was the highest among the samples with Rct of 69.94 Ω, while the Rct of TiOx A was 11.86 Ω. The ionic resistances are affected by the particle size, atomic structure and electrode surface wettability.14 The average particle size of TiOx A and TiOx B was 110 and 250 nm, respectively. The small size of TiOx A led to a better contact between the active materials and hence, decreasing the resistances. The oxygen deficiency in the atomic structure of TiOx A (Ti3+ : Ti4+ = 50 : 50) enabled Li ions to pass through the structure easily compared with that in TiOx B where Ti4+ dominated the structure.
Resistance value of initial materials obtained by fitting the Nyquist plots.
| Sample | rGO | TiOx A | TiOx B |
|---|---|---|---|
| R s (Ω) | 2.70 Ω | 3.12 Ω | 2.51 Ω |
| R ct (Ω) | 11.29 Ω | 11.86 Ω | 69.94 Ω |
Nyquist plots of the composites are shown in Fig. 4b and c. Combining the TiOx with rGO decreased the Rct. However, in sample A-95 : 5, the Rct value significantly increased which probably due to the imperfect contact between active materials and the current collector (Table S1†). In rGO–TiOx B composite, combining the TiOx with rGO affected the Rs value. In sample B-70 : 30, the increased Rs value implied no improvement in the charge transfer by combining the TiOx with rGO.
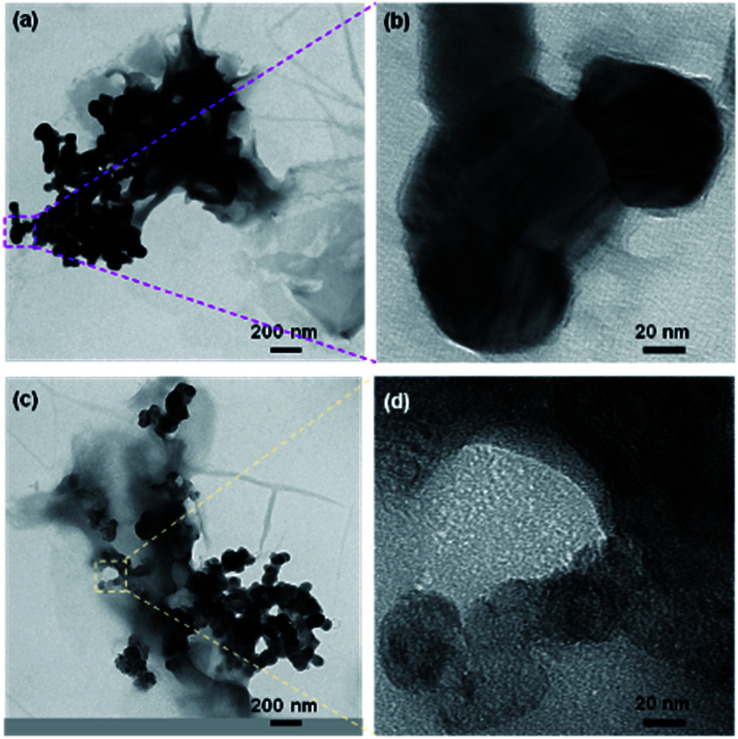
To study the effect of conductive polymer addition on rGO/TiOx, PEDOT:PSS was added to sample A and B (95 : 5, 90 : 10, and 70 : 30). According to the diffraction peak in Fig. S2,† there were only rGO and Ti4O7 peaks in sample A-90 : 10 P, indicating no phase change in the TiOx after mixing with PEDOT:PSS. Interestingly, a weak Ti4O7 peak was also observed at 2θ of approximately 20.5° in sample B-90 : 10 P, besides rGO and rutile TiO2 peaks. The presence of the new peak suggested a mild reduction of the TiOx, probably by rGO. The morphologies of sample A and B (90 : 10) after PEDOT:PSS addition are shown in Fig. 5. Based on these images, the TiOx particles are attached on the rGO layers and surrounded by PEDOT:PSS matrix. However, the TiOx particles in sample B-90 : 10 P appeared to be inhomogeneous and porous, which are expected to increase the specific surface area of the electrode. FTIR analysis in Fig. S3† showed that addition of TiOx into rGO matrix does not affect the bonding structure of rGO. This is in accordance with the diffraction data of rGO/TiOx which seems to be the combination of rGO and TiOx diffraction pattern. However, after PEDOT:PSS was added to the composite, the skeleton peak of graphene was slightly appeared at around 1617 cm−1. Moreover, a transmittance peak at around 588 cm−1 was observed, indicating the formation of Ti–O–C bond due to the anchoring of TiOx nanoparticles on the graphene sheets.24
Fig. 5. TEM images of sample (a and b) A-90 : 10 P and (c and d) B-90 : 10 P.
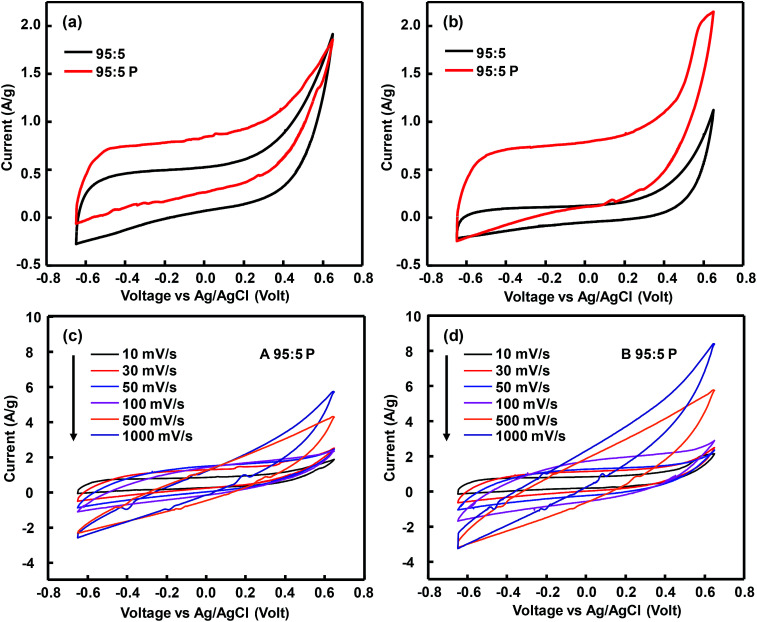
The cyclic voltammetry of both samples before and after PEDOT:PSS addition are depicted in Fig. 6. The presence of PEDOT:PSS enhanced the detected current during CV test, indicating an increased amount of current stored in the electrode during charge–discharge, promoted by the conductive polymer. CV performances of sample A-95 : 5 P and B-95 : 5 P were tested at various scan rate from 10 mV s−1 to 1000 mV s−1. Sample A was more stable than sample B up to a scan rate of 1000 mV s−1. Sample B, which possessed a lower ionic conductivity, destabilized as the scan rate was increased to 500 mV s−1.18 Addition of PEDOT:PSS, however, increased the Rct value of the active materials through an intrinsic redox reaction (Fig. S4†).
Fig. 6. Cyclic voltammetry (CV) curves of sample A and B at composition of rGO : TiOx = 95 : 5 with and without PEDOT:PSS addition (a and b) and CV curves of sample A-95 : 5 P and B-95 : 5 P at various scan rates of 10–1000 mV s−1 (c and d).
Specific capacitance
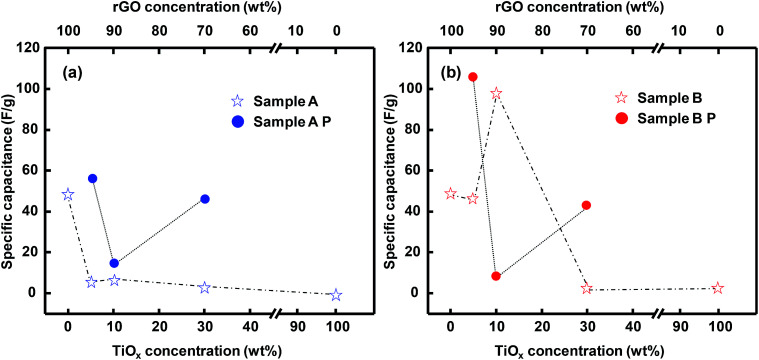
Specific capacitance calculated from CV curves integration are showed in Fig. 7. The composite of TiOx A and rGO, in any TiOx A concentration, exhibited a lower specific capacitance than that of standalone rGO (Fig. 7a). 5% loading of TiOx B in the composite slightly decreased the capacitance, but a further increase in the TiOx loading to 10% significantly improved the capacitance to a value higher than that of standalone rGO (98.8 F g−1vs. 49.5 F g−1). This implies that TiOx B, which was dominated by TiO2 phase, is more suitable to provide capacitance than TiOx A. It is speculated that the crystal structure of TiOx A, although dominated by Ti4O7, is not favorable for the electron mobility. This is consistent with the Rs value of TiOx A which was supposed to be lower than that of TiOx B due to the Ti4O7 phase. Similar behavior was also exhibited in a previous study.25 The low electron mobility finally lowered the resulting specific capacitance of TiOx A. 10% was the optimum TiOx B loading for delivering the specific capacitance, probably because of the optimum surface sites for charge storage and electron transfer.
Fig. 7. Specific capacitance of sample A (a) and sample B (b) before and after PEDOT:PSS addition.
Addition of PEDOT:PSS to the rGO/TiOx composite resulted a different trend, where the specific capacitance of sample A-95 : 5 and B-95 : 5 increased significantly to be 57.1 F g−1 and 106.2 F g−1, respectively. However, the specific capacitance of sample B-95: P should be increased, as it decreases after second cycle (Fig. S5†). The presence of conducting polymer promoted the charge storage in the active materials due to the anchoring TiOx.34 This hypothesis is strengthened by the XRD analysis (Fig. S6†), which shows no crystal structure difference before and after mixing with PEDOT:PSS. However, the anchoring TiOx nanoparticles on the graphene sheets could help to improve the capacitance of the sample. However, too much conducting polymer tended to decrease the specific capacitance, likely because of the blockage of the active surface sites by the polymer.
Conclusions
Electrochemical characteristics of rGO and TiOx composite with various rGO to TiOx ratios and two different TiOx structures have been investigated. The Magnéli phase in the TiOx contributed to the low intrinsic ionic resistance. However, the CV analyses showed that rutile phase exhibited a better pseudoactivity which possibly due to the presence of more redox reactions, indicated by the presence of anodic peak in the CV curve. Sample with composition of rGO : TiOx = 90 : 10 performed the highest specific capacitance value. The specific capacitance of rGO/rutile–TiOx composites could be enhanced by addition of PEDOT:PSS, up to 106.2 F g−1. We believed that rGO/TiOx/PEDOT:PSS can be developed as an electrode for supercapacitor or other energy storage devices.
Conflicts of interest
There are no conflicts to declare.
Supplementary Material
Acknowledgments
This work is supported by USAID through Sustainable Higher Education Research Alliances (SHERA) Program and partially funded by the Indonesian Ministry of Research, Technology and Higher Education under WCU Program managed by Institut Teknologi Bandung.
Electronic supplementary information (ESI) available. See DOI: 10.1039/c9ra04346b
References
- Zhang L. L. Zhao X. Chem. Soc. Rev. 2009;38:2520–2531. doi: 10.1039/B813846J. [DOI] [PubMed] [Google Scholar]
- Conway B. E., Electrochemical supercapacitors: scientific fundamentals and technological applications, Springer Science & Business Media, 2013 [Google Scholar]
- Conway B. Birss V. Wojtowicz J. J. Power Sources. 1997;66:1–14. doi: 10.1016/S0378-7753(96)02474-3. [DOI] [Google Scholar]
- Frackowiak E. Phys. Chem. Chem. Phys. 2007;9:1774–1785. doi: 10.1039/B618139M. [DOI] [PubMed] [Google Scholar]
- Pandolfo A. Hollenkamp A. J. Power Sources. 2006;157:11–27. doi: 10.1016/j.jpowsour.2006.02.065. [DOI] [Google Scholar]
- Iskandar F. Abdillah O. B. Stavila E. Aimon A. H. New J. Chem. 2018:16362–16371. doi: 10.1039/C8NJ03614D. [DOI] [Google Scholar]
- Novoselov K. S. Fal V. Colombo L. Gellert P. Schwab M. Kim K. nature. 2012;490:192. doi: 10.1038/nature11458. [DOI] [PubMed] [Google Scholar]
- Raccichini R. Varzi A. Passerini S. Scrosati B. Nat. Mater. 2015;14:271. doi: 10.1038/nmat4170. [DOI] [PubMed] [Google Scholar]
- Chiam S. Lim H. Hafiz S. Pandikumar A. Huang N. Sci. Rep. 2018;8:3093. doi: 10.1038/s41598-018-21572-x. [DOI] [PMC free article] [PubMed] [Google Scholar]
- Tkachev S. Buslaeva E. Y. Naumkin A. Kotova S. Laure I. Gubin S. Inorg. Mater. 2012;48:796–802. doi: 10.1134/S0020168512080158. [DOI] [Google Scholar]
- Wang K. Dong X. Zhao C. Qian X. Xu Y. Electrochim. Acta. 2015;152:433–442. doi: 10.1016/j.electacta.2014.11.171. [DOI] [Google Scholar]
- Iskandar F. Hikmah U. Stavila E. Aimon A. H. RSC Adv. 2017;7:52391–52397. doi: 10.1039/C7RA10013B. [DOI] [Google Scholar]
- Zhu S. Chen M. Ren W. Yang J. Qu S. Li Z. Diao G. New J. Chem. 2015;39:7923–7931. doi: 10.1039/C5NJ01480H. [DOI] [Google Scholar]
- Kim J. Khoh W.-H. Wee B.-H. Hong J.-D. RSC Adv. 2015;5:9904–9911. doi: 10.1039/C4RA12980F. [DOI] [Google Scholar]
- Chen Z. Liao W. Ni X. Chem. Eng. J. 2017;327:1198–1207. doi: 10.1016/j.cej.2017.06.098. [DOI] [Google Scholar]
- Wang S. Jiang S. P. Wang X. Electrochim. Acta. 2011;56:3338–3344. doi: 10.1016/j.electacta.2011.01.016. [DOI] [Google Scholar]
- Ramesh S. Khandelwal S. Rhee K. Y. Hui D. Composites, Part B. 2018;138:45–54. doi: 10.1016/j.compositesb.2017.11.024. [DOI] [Google Scholar]
- Xiang C. Li M. Zhi M. Manivannan A. Wu N. J. Mater. Chem. 2012;22:19161–19167. doi: 10.1039/C2JM33177B. [DOI] [Google Scholar]
- Zhang Z. Xiao F. Guo Y. Wang S. Liu Y. ACS Appl. Mater. Interfaces. 2013;5:2227–2233. doi: 10.1021/am303299r. [DOI] [PubMed] [Google Scholar]
- Hu C.-C. Chang K.-H. Lin M.-C. Wu Y.-T. Nano Lett. 2006;6:2690–2695. doi: 10.1021/nl061576a. [DOI] [PubMed] [Google Scholar]
- Tomiyasu H. Shikata H. Takao K. Asanuma N. Taruta S. Park Y.-Y. Sci. Rep. 2017;7:45048. doi: 10.1038/srep45048. [DOI] [PMC free article] [PubMed] [Google Scholar]
- Cao J. Wang Y. Zhou Y. Ouyang J.-H. Jia D. Guo L. J. Electroanal. Chem. 2013;689:201–206. doi: 10.1016/j.jelechem.2012.10.024. [DOI] [Google Scholar]
- Xiong Q.-q. Tu J.-p. Xia X.-h. Zhao X.-y. Gu C.-d. Wang X.-l. Nanoscale. 2013;5:7906–7912. doi: 10.1039/C3NR02258G. [DOI] [PubMed] [Google Scholar]
- Ramadoss A. Kim S. J. Carbon. 2013;63:434–445. doi: 10.1016/j.carbon.2013.07.006. [DOI] [Google Scholar]
- Zhang Z. Xiao F. Guo Y. Wang S. Liu Y. ACS Appl. Mater. Interfaces. 2013;5:2227–2233. doi: 10.1021/am303299r. [DOI] [PubMed] [Google Scholar]
- Arif A. F. Balgis R. Ogi T. Iskandar F. Kinoshita A. Nakamura K. Okuyama K. Sci. Rep. 2017;7:3646. doi: 10.1038/s41598-017-03509-y. [DOI] [PMC free article] [PubMed] [Google Scholar]
- Bai S. Ma Y. Jiang X. Li Q. Yang Z. Liu Q. He D. Surf. Interfaces. 2017;8:214–218. doi: 10.1016/j.surfin.2017.06.010. [DOI] [Google Scholar]
- Liu Y. Weng B. Razal J. M. Xu Q. Zhao C. Hou Y. Seyedin S. Jalili R. Wallace G. G. Chen J. Sci. Rep. 2015;5:17045. doi: 10.1038/srep17045. [DOI] [PMC free article] [PubMed] [Google Scholar]
- Mercante L. A. Facure M. H. Sanfelice R. C. Migliorini F. L. Mattoso L. H. Correa D. S. Appl. Surf. Sci. 2017;407:162–170. doi: 10.1016/j.apsusc.2017.02.156. [DOI] [Google Scholar]
- Zeng Y. Han Y. Zhao Y. Zeng Y. Yu M. Liu Y. Tang H. Tong Y. Lu X. Adv. Energy Mater. 2015;5:1402176. doi: 10.1002/aenm.201402176. [DOI] [Google Scholar]
- Geng P. Chen G. J. Membr. Sci. 2016;498:302–314. doi: 10.1016/j.memsci.2015.07.055. [DOI] [Google Scholar]
- Potphode D. D. Sivaraman P. Mishra S. P. Patri M. Electrochim. Acta. 2015;155:402–410. doi: 10.1016/j.electacta.2014.12.126. [DOI] [Google Scholar]
- Han M. Wang X. Chen C. Zou M. Niu Z. Yang Q.-H. Cao A. Song L. Chen J. Xie S. Energy Storage Materials. 2018;13:119–126. doi: 10.1016/j.ensm.2018.01.007. [DOI] [Google Scholar]
- Dai Z. Peng C. Chae J. H. Ng K. C. Chen G. Z. Sci. Rep. 2015;5:9854. doi: 10.1038/srep09854. [DOI] [PMC free article] [PubMed] [Google Scholar]
Associated Data
This section collects any data citations, data availability statements, or supplementary materials included in this article.


