Abstract
Objective:
To develop and validate a novel convolutional neural network (CNN) termed “Super U-Net” for medical image segmentation.
Methods:
Super U-Net integrates a dynamic receptive field module and a fusion upsampling module into the classical U-Net architecture. The model was developed and tested to segment retinal vessels, gastrointestinal (GI) polyps, skin lesions on several image types (i.e., fundus images, endoscopic images, dermoscopic images). We also trained and tested the traditional U-Net architecture, seven U-Net variants, and two non-U-Net segmentation architectures. K-fold cross-validation was used to evaluate performance. The performance metrics included Dice similarity coefficient (DSC), accuracy, positive predictive value (PPV), and sensitivity.
Results:
Super U-Net achieved average DSCs of 0.808±0.0210, 0.752±0.019, 0.804±0.239, and 0.877±0.135 for segmenting retinal vessels, pediatric retinal vessels, GI polyps, and skin lesions, respectively. The Super U-net consistently outperformed U-Net, seven U-Net variants, and two non-U-Net segmentation architectures (p < 0.05).
Conclusion:
Dynamic receptive fields and fusion upsampling can significantly improve image segmentation performance.
Keywords: image segmentation, U-Net, dynamic receptive field, fusion upsampling
1. Introduction
Accurate segmentation of regions of interest depicted on medical images is critical for quantitative analysis of the presence or progression of disease as well as the identification of important landmarks [1, 2]. Manual segmentation is time-consuming and requires a clinical expert to visually interpret the images and carefully outline the regions of interest. There are often significant intra- and inter-reader variances associated with manual segmentation [3, 4]. Hence, significant research effort has been dedicated to developing automated segmentation algorithms for various image modalities [5–7].
Traditional segmentation algorithms are primarily based on computer vision technologies, and their performance depends heavily on hand-crafted features. It is difficult for a limited number of manually drafted features to accurately and fully characterize specific regions of interest. Recently, convolutional neural networks (CNN) have demonstrated consistently superior performance compared to the traditional computer vision technologies in image segmentation and other image processing procedures [8–11]. Performance gains were obtained through the unique ability of CNNs to extract millions of features with stacked convolutional layers. These sequential layers generate complex feature maps that allow a CNN to automatically “learn” and “organize” image features relative to the segmentation task. U-Net is a CNN architecture formed by a symmetrical encoder-decoder backbone with skip connections that is widely used for automated image segmentation and has demonstrated remarkable performance [12]. However, the U-Net architecture has some limitations, which, if overcome, may improve performance. First, the use of static kernel sizes prevents the U-Net from adapting to spatial differences between images. Networks limited to a specific kernel size may be unable to extract all the meaningful features from datasets with varying spatial contexts [13]. Second, the use of sequential pooling operations in the encoder decreases image resolution and may sacrifice essential information for generating segmentation maps. When downsampled feature maps are upsampled and concatenated onto the accompanying feature maps from the encoder, they are commonly semantically dissimilar [14]. The dissimilarity caused by skip connections places an increased burden on the decoder to bring the feature maps into spatial alignment. Third, although convolutional layers can extract millions of features, they struggle at differentiating “noisy” background features from ROIs, especially when the edge between classes is hard to differentiate.
There have been attempts to improve the U-Net by appending additional encoder-decoder modules. Zhou et al. [14] expanded the U-Net with distinctive nested skip pathways across every level of the network and termed it as U-Net++. Their premise was that dense skip connections would allow the network to generate semantically similar feature maps when concatenated onto the decoder. Furthermore, several U-Net variations have been developed to incorporate features from state-of-the-art classification networks, such as Szegedy et al. [15] inclusion of inception blocks and He et al. [16] use of residual units. Oktay et al. [17] proposed attention gates to improve the U-Net’s ability to focus on structures of interest while simultaneously suppressing irrelevant background noise. Alom et al. [18] created the Recurrent Residual U-Net (R2 U-Net) by including residual units in both the encoder and decoder that allows the network to have multiple paths of varying length. Based on these established U-Net variants, several additional variations have been developed by incorporating modules from multiple models. The Attention Residual U-Net (Attn. Res U-Net) employed modules from both the Residual U-Net [19] and the attention module [17] to improve performance. Jha et al. [20] proposed Residual U-Net++ that leveraged residual units [16], attention gates [17], and squeeze and excitation [21] to improve the performance of polyp segmentation. Despite exhaustive efforts, U-Net variants can still struggle at providing generalized performance gains across varying segmentation tasks.
In this study, we developed a novel U-Net variant termed “Super U-Net.” To enhance the decoder’s ability to integrate concatenated feature maps, we implemented a fusion upsampling module inspired by the squeeze and excitation module developed by Hu et al. [21]. To address spatial variability between images, we incorporated a dynamic receptive field module that allowed the network to determine the correct kernel size at each level of the network. The inclusion of these modules improved the ability of the U-Net architecture to handle spatial variance and information loss based on our analysis of four datasets. The developed architecture outperformed eight variations of the U-Net and two non-U-Net segmentation architectures.
2. Materials and Methods
2.1. Super U-Net Architecture
Super U-Net was designed by modifying each U-Net core component (i.e., encoder, decoder, and skip connections) to extract detailed spatial information and integrate the concatenated feature maps from the encoder (Fig.1). The Super U-net encoder block is a modified version of the Residual units developed by He et al. [16]. It employs residual blocks to minimize the degradation problem occurring in deep networks. Fusion upsampling and dynamic receptive field modules were developed as part of Super U-net. Fusion upsampling leverages squeeze and excitation [21] to aggregate divergent feature maps into similar feature representations. The fusion upsampling module was used to modify skip connections. The dynamic receptive field module allows the network to determine the best kernel size for the current segmentation task at each iteration in training. Dynamic kernel selection grants the network parallel paths of varying kernel size and allows for the extraction of multiscale spatial information. After integrating each module, essential semantic and spatial information is preserved. Super U-net is designed to have a moderate number of network parameters (4.2 million) when compared to the typical million network parameters of other U-Nets.
Fig. 1.
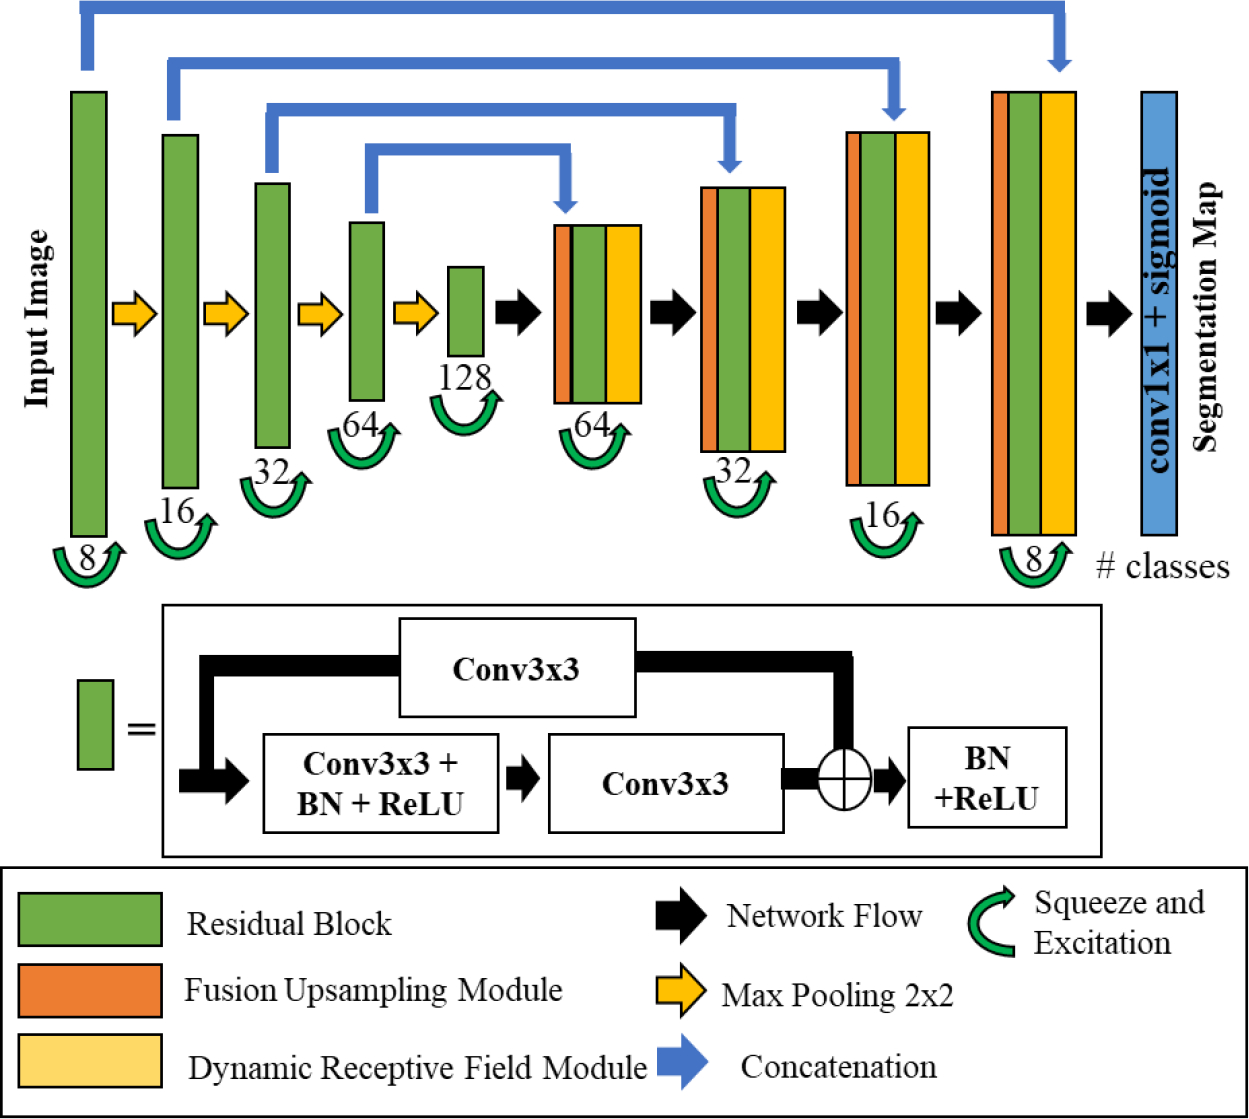
Super U-Net Architecture
2.2. Residual Block
Super U-Net uses the residual connections proposed by He et al. [16] as the central convolution component. The first layer is a convolutional operation with a kernel size of 3×3 pixels. After the convolution layer, a batch normalization layer is applied and followed by the nonlinear rectified linear unit (ReLU) activation function. Next, the feature map undergoes an additional convolutional layer prior to having the initial feature map added to the image. Thereafter, the combined feature map receives batch normalization and a ReLU activation function. As the feature maps cascade down each layer of the encoder, the number of filters doubles on every successive layer (i.e., 8, 16, 32, 64, 128). After the residual operations, the feature map is then recalibrated by implementing a squeeze and excitation module [21] to form one branch of the fusion upsampling module.
2.3. Fusion upsampling and concatenation module
The recalibrated feature map from the encoder immediately passes across the long skip connection to form the encoded branch of the upsampled fusion module (Fig. 2). This module is used to integrate the feature maps from the encoder with the upsampled feature maps of the decoder. The encoder and decoder feature maps are fed into a squeeze and excitation module [21] before concatenation. The encoded feature map undergoes a squeeze and excitation operation prior to the skip connection, which allows for the recalibrated feature map to assist the lower levels of the encoder network with the extraction of meaningful features. The decoded feature map is recalibrated and then upsampled to allow for a better distribution of features. The feature maps are “squeezed” with a global average pooling operation, and then the features are “excited,” allowing for an adaptive recalibration of channel-wise dependencies. Next, the features enter a multilayer perceptron (MLP), where the first layer contains more nodes than the input layers. A ReLU activation function is applied to the aggregated features before the features pass through an additional fully connected layer. Next, a sigmoid activation function is applied to the features followed by reshaping and multiplying the output channel-wise across the input. As the features flow upward in the decoder, the number of feature channels is reduced. After each reduction, fewer feature maps are retained. Adaptive recalibration allows the interaction between channels to be better represented when upsampled and concatenated with the corresponding feature map. Squeeze and excitation operations ensure that meaningful features are retained as the number of channels is reduced. After concatenation, the fused feature maps enter a residual block.
Fig. 2.

Fusion upsampling and concatenation module
2.3. Dynamic receptive field module
The dynamic receptive field module creates three independent paths of unique kernel sizes and allows the network to determine the optimal path (Fig. 3). Specifically, the receptive field module has three parallel routes with kernel sizes of 1×1, 3×3, and 5×5. After this initial convolutional layer, each path goes through another convolutional layer with kernel sizes equal to the previous layer. Each convolution path proceeds to dilated convolution layer with a dilation rate equivalent to their kernel size (i.e., Conv3×3 has a dilation rate of 3). The kernel size of 1 provides a baseline for the network to refine its feature maps. Each path is then concatenated before undergoing a final convolutional layer. Thereafter, the output is concatenated onto the initial feature map. By granting the network the freedom of choice in its path, the network can optimally learn multiscale contextual information [13].
Fig. 3.
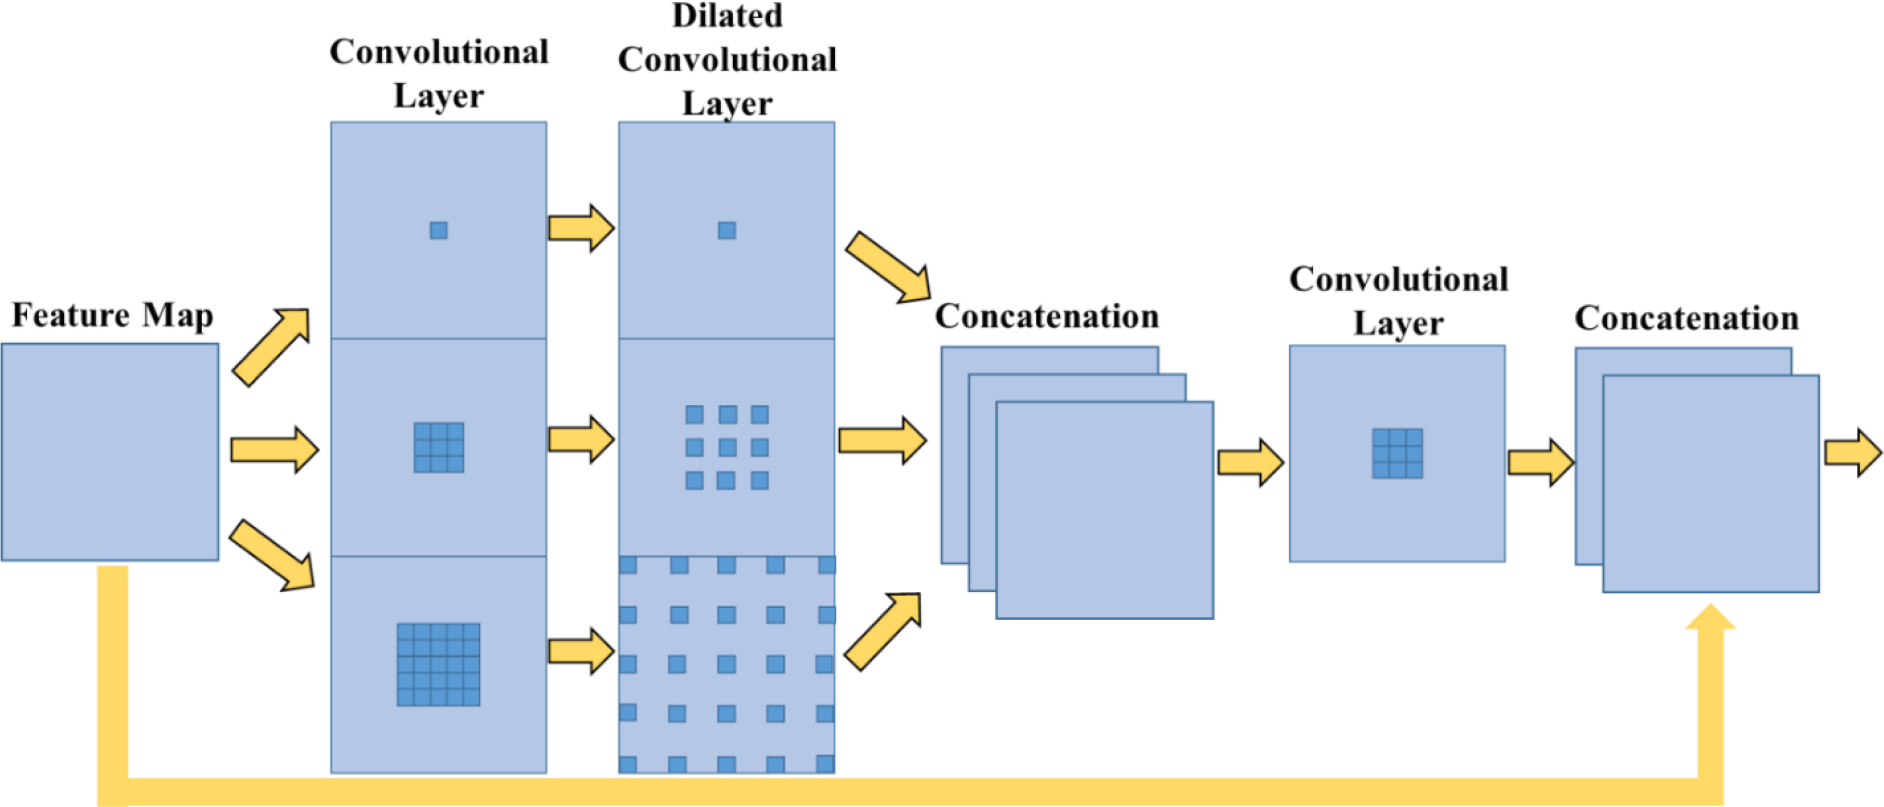
Dynamic Receptive Field module
The fusion upsampling module and the dynamic receptive field module enable Super U-Net to integrate the feature maps of the encoder with the decoder as compared to the traditional U-Net. Feature similarity is prioritized between encoder and decoder feature maps by decreasing the number of channels across the decoder. Decreasing the number of channels forces multiple channels to be represented by a single channel; divergent channels forced into a single channel will create irregular features. Reducing the number of channels in the feature map to the number of segmentation channels requires that the remaining feature maps have semantic similarities and generalizable features. Divergent feature maps prevent the network from being able to optimize performance. Upsampled fusion and dynamic receptive fields are two mechanisms that attempt to extract and retain significant features, which ensures that meaningful features are leveraged for the segmentation map.
2.4. Training and validation datasets
Super U-Net was trained and evaluated using four publicly available datasets: (1) Digital Retinal Images for Vessel Extraction (DRIVE) and (2) Kvasir-SEG, (3) Child Heart and Health Study in England (CHASE DB1), and (4) International Skin Imaging Collaboration (ISIC).
DRIVE: This dataset was collected from a diabetic retinopathy screening program in the Netherlands [22]. The dataset contained 40 color fundus images, among which 33 images were negative for diabetic retinopathy and seven images were diagnosed with diabetic retinopathy. The images were acquired using a Canon CR5 non-mydriatic 23CCD camera with a 45-degree field of view (FOV). When released to the public, the images were cropped to only include the FOV. The retinal vessels depicted in the images were manually segmented by an ophthalmologist. The retinal images were randomly sampled to create image “patches” that were 48×48 pixels.
Kvasir-SEG: This dataset was generated by the Vestre Viken Health Trust in Norway [23] and consisted of 1000 GI tract endoscopic images depicting polyps [24]. Certified radiologists outlined the polyps on all the images. Image matrices varied from 720×576 to 1920×1080. All the images in this dataset contained polyps, and their locations were known. In other words, the algorithm did not need to detect the polyps.
CHASE DB1: This dataset was collected during cardiovascular health screening of primary school children in three different UK cities [25]. The dataset contains 28 color retina images taken from the left and right eye of 14 pediatric subjects. Each image was annotated by two trained specialists. The fundus images were taken with a Nidek NM-200D handheld fundus camera and processed with a Computer-Assisted Image Analysis of the Retina (CAIAR) program.
ISIC: This dataset contains 2,000 images of cancerous skin lesions collected by the International Skin Imaging Collaboration [26]. Each image contains a lesion diagnosis of either melanoma, nevus, or seborrheic keratosis. An experienced clinician used a semi-automated or manual process to segment the lesions on the images.
The Dice similarity coefficient (DSC) was used as the loss function to train Super U-net on both datasets. The Adam optimizer was used with initial learning rates of 0.001, 0.0001, 0.01, and 0.01 for DRIVE, Kvasir-SEG, CHASE DB1, and ISIC databases, respectively. Learning rates were determined empirically based upon a specific task. The training epochs for the DRIVE, CHASE DB1, Kvasir-SEG, and ISIC datasets were 40, 40, 30, and 100, respectively. Due to the limit of GPU memory, the batch size was set at 32 (image patches) for the DRIVE and CHASE DB1 datasets and 4 (images) for the ISIC and Kvasir-SEG datasets. The training procedure stopped if the DSC loss did not improve for 15 continuous epochs. When training the networks on the Kvasir-SEG and ISIC dataset, each image was resized to 512×512 pixels by nearest neighbor sampling. When training the networks on the DRIVE and CHASE DB1 dataset, we employed random patch generation. This procedure involves randomly selecting 48×48 pixel subsections of the original image for training, which increases the size and diversity of the training data. When testing occurred, sliding window patch generation was used to create predictions. After all patches for a testing image were generated, they were “stitched” together to create the complete segmentation map. Training data was augmented using a collection of geometric and image transformations (e.g., scale, rotation, translation, Gaussian noise, smoothing, and brightness perturbations). Pixels that were predicted at or above 0.5 were classified as the regions of interest during the testing phase. All networks were implemented in Keras TensorFlow and trained on an NVIDIA GeForce Titan XP.
2.5. Performance assessment
The segmentation performance of the Super-U-Net was evaluated using DSC, accuracy, positive predictive value (PPV), and sensitivity (Eq. 1 – 4). These metrics are based on if a pixel is correctly or incorrectly identified by the computer software compared to the manual segmentation. True positive correlates to a pixel correctly being classified as a segmented region of interest, while false positive corresponds to a correctly identified background pixel. The DSC evaluates the amount of agreement (or overlap) between two segmentation approaches, which in this study were the CNN algorithms versus the manual segmentation. Eight U-Net variants, including U-Net [12], Res U-Net [19], Inception U-Net [27], Recurrent Residual U-Net (R2U-Net) [18], U-Net++ [14], Attention U-Net [17], Res U-Net++ [20], and Attention Res U-Net, were trained and tested against Super U-Net. We performed additional experimental validation against two non-U-Net segmentation architectures, namely SegNet [29] and LinkNet [30]. The k-fold cross-validation (k=5) method was used to evaluate the performance of the CNN models on the DRIVE, CHASE DB1, and Kvasir-SEG datasets. During each fold, the data was split into a unique training and testing set. With a k value of 5, DRIVE had a train/test split of 32/8, while Kvasir-SEG had a train/test split of 800/200. CHASE DB 1 had a train/test split of 23/5 with one unique split of 25/3 due to the number of images. K-fold cross-validation was not performed on the ISIC dataset due to the size of the dataset (n=2000). ISIC had a train/test split of 1800/200. After training and testing were completed, the network’s weights were randomized before the next fold was trained. This process ensured that performance metrics are representative of the entire dataset. The mean performance between the different CNN architectures was tested using T-test statistics with a p-value less than 0.05 considered statistically significant.
| (1) |
| (2) |
| (3) |
| (4) |
An ablation study with the dynamic receptive field and the upsampling fusion modules was performed to test the individual impact of the two modules. The DRIVE dataset (retinal vessels) was split into 20 images for training and different 20 images for testing. The patch strategy and data augmentation were used in this analysis.
3. Results
(1). DRIVE segmentation results
Super U-Net achieved better performance segmenting retinal vessels on fundus images based on DSC, and accuracy with average values of 0.808 and 0.966, respectively (Table 1). The DSC for Super U-net was significantly higher than the traditional U-Net and seven U-Net variants (p < 0.05). Although there are trade-offs in segmentation performance (“hits” and “misses”), visual inspection demonstrated the overall better performance of Super U-Net compared to other U-Net variations for segmenting retinal vessels (Figs. 4 and 5).
Table 1.
The average performance metrics for segmenting retinal vessels in the DRIVE testing dataset (n=40).
| Architecture | Dice Coefficient | Accuracy | PPV | Sensitivity |
|---|---|---|---|---|
|
| ||||
| U-Net | 0.678±0.026 | 0.872±0.000 | 0.659±0.052 | 0.808±0.045 |
| SegNet | 0.191±0.018 | 0.270±0.009 | 0.901±0.010 | 0.117±0.013 |
| LinkNet | 0.765±0.034 | 0.961±0.007 | 0.961±0.006 | 0.821±0.056 |
| Inception U-Net | 0.659±0.026 | 0.949±0.000 | 0.781±0.052 | 0.576±0.034 |
| Attention U-Net | 0.780±0.029 | 0.960±0.000 | 0.758±0.061 | 0.816±0.037 |
| Res U-Net | 0.798±0.026 | 0.965±0.000 | 0.815±0.048 | 0.790±0.043 |
| R2 U-Net | 0.798±0.025 | 0.965±0.000 | 0.808±0.052 | 0.794±0.036 |
| Attn. Res U-Net | 0.797±0.025 | 0.965±0.000 | 0.802±0.054 | 0.801±0.0364 |
| U-Net++ | 0.770±0.035 | 0.962±0.000 | 0.810±0.069 | 0.742±0.047 |
| Res U-Net++ | 0.755±0.030 | 0.956±0.000 | 0.742±0.059 | 0.780±0.042 |
| Super U-Net | 0.808±0.021 | 0.966±0.000 | 0.803±0.045 | 0.818±0.036 |
Fig 4.
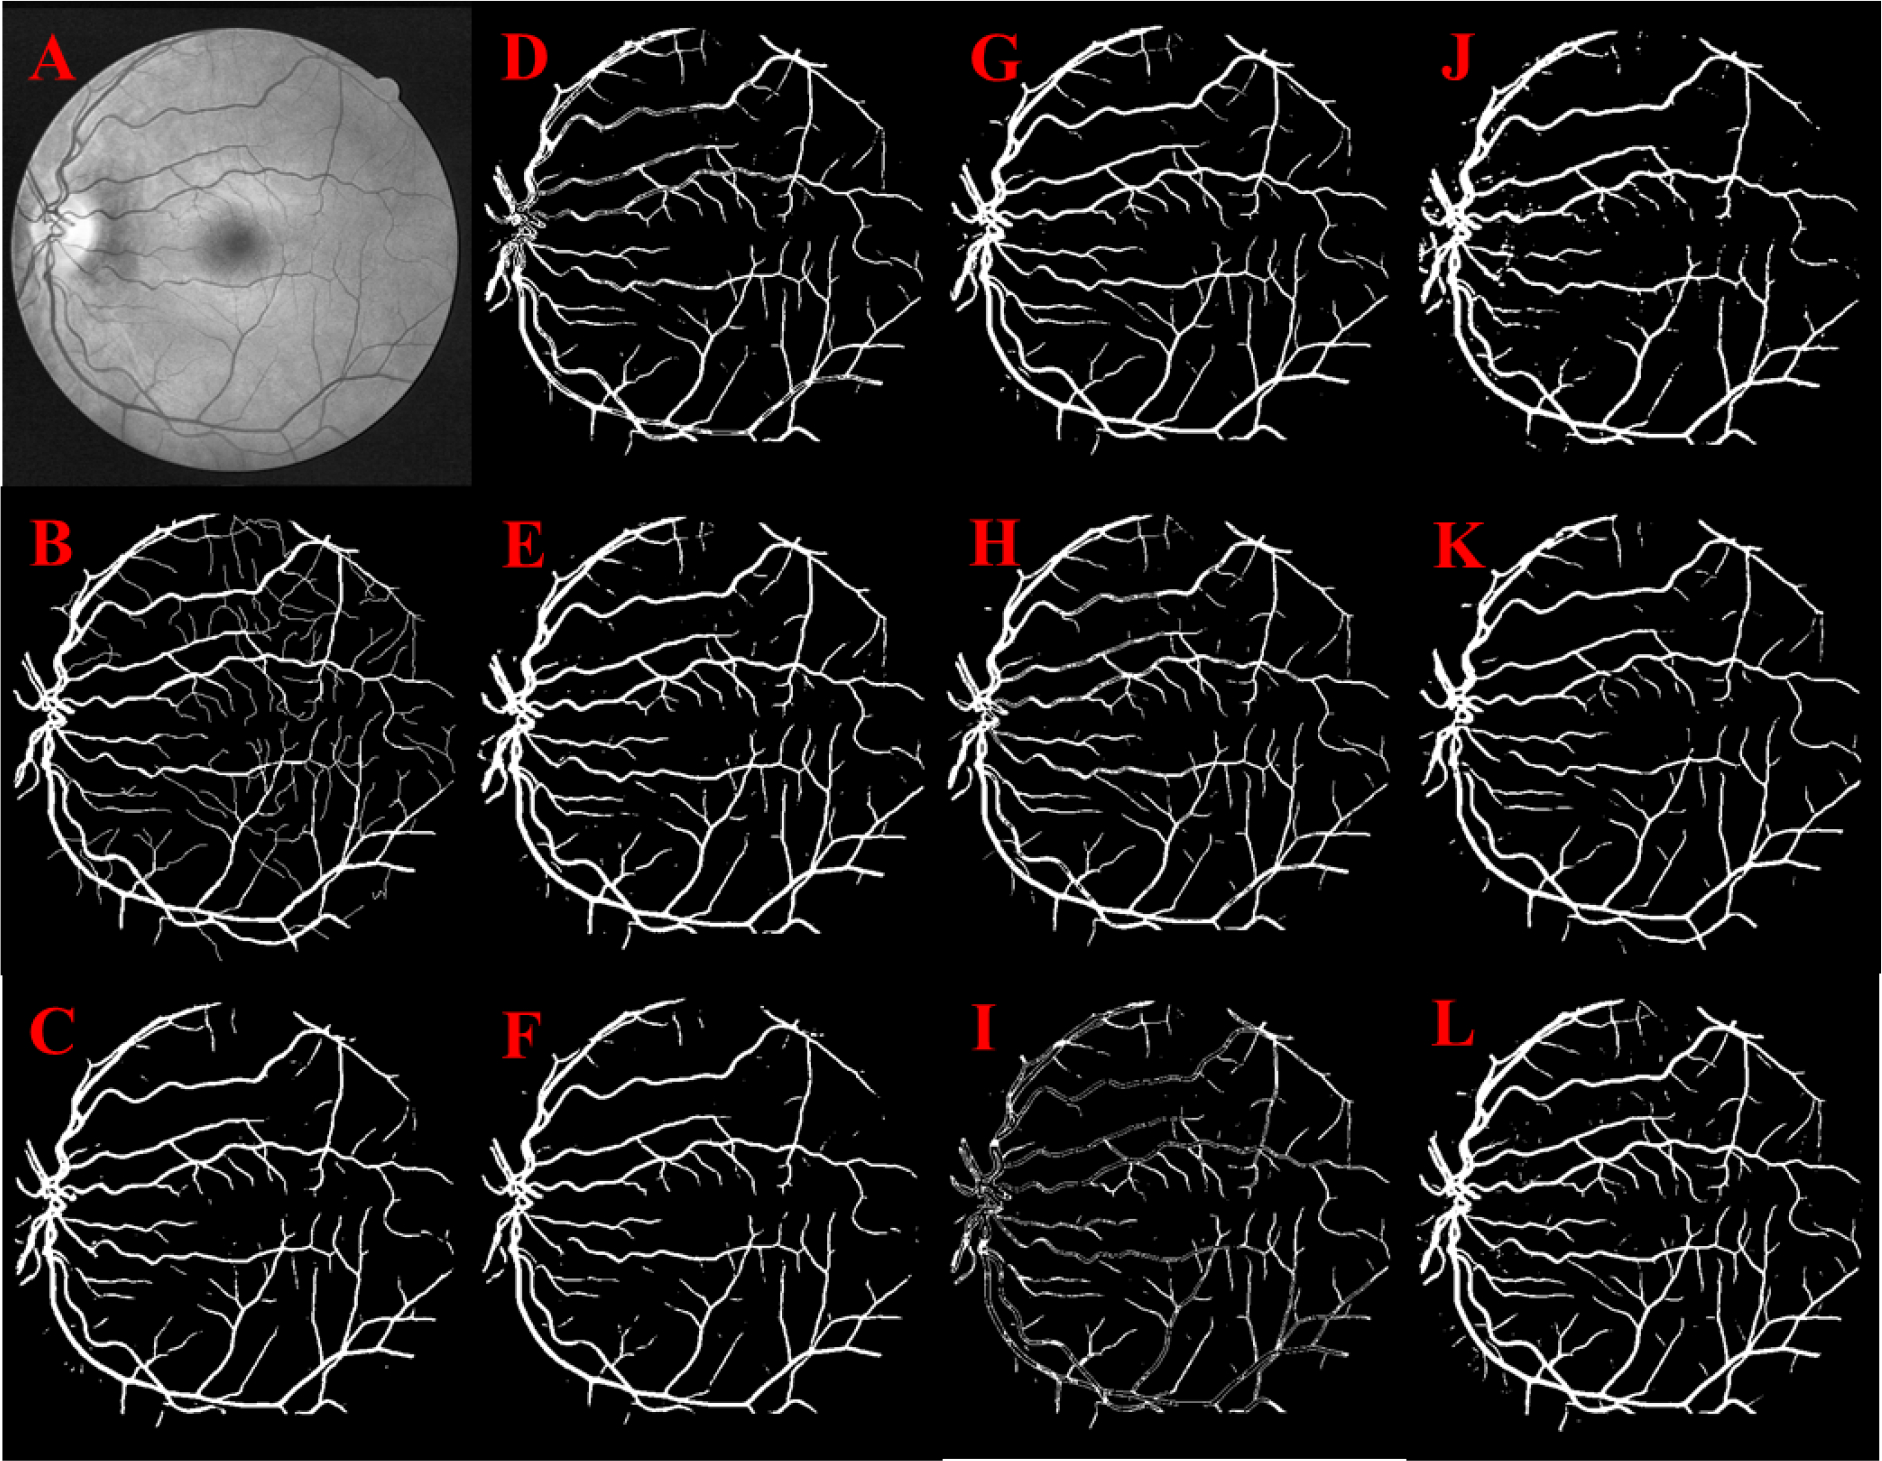
Retinal vessel segmentation: Original image (A), Manual segmentation (B), U-Net (C), Res U-Net (D), Attention U-Net (E), U-Net++ (F), Attn. Res U-Net (G), R2 U-Net (H), Inception U-Net (I), Res U-Net++ (J), LinkNet (K), Super U-Net (L)
Fig 5.
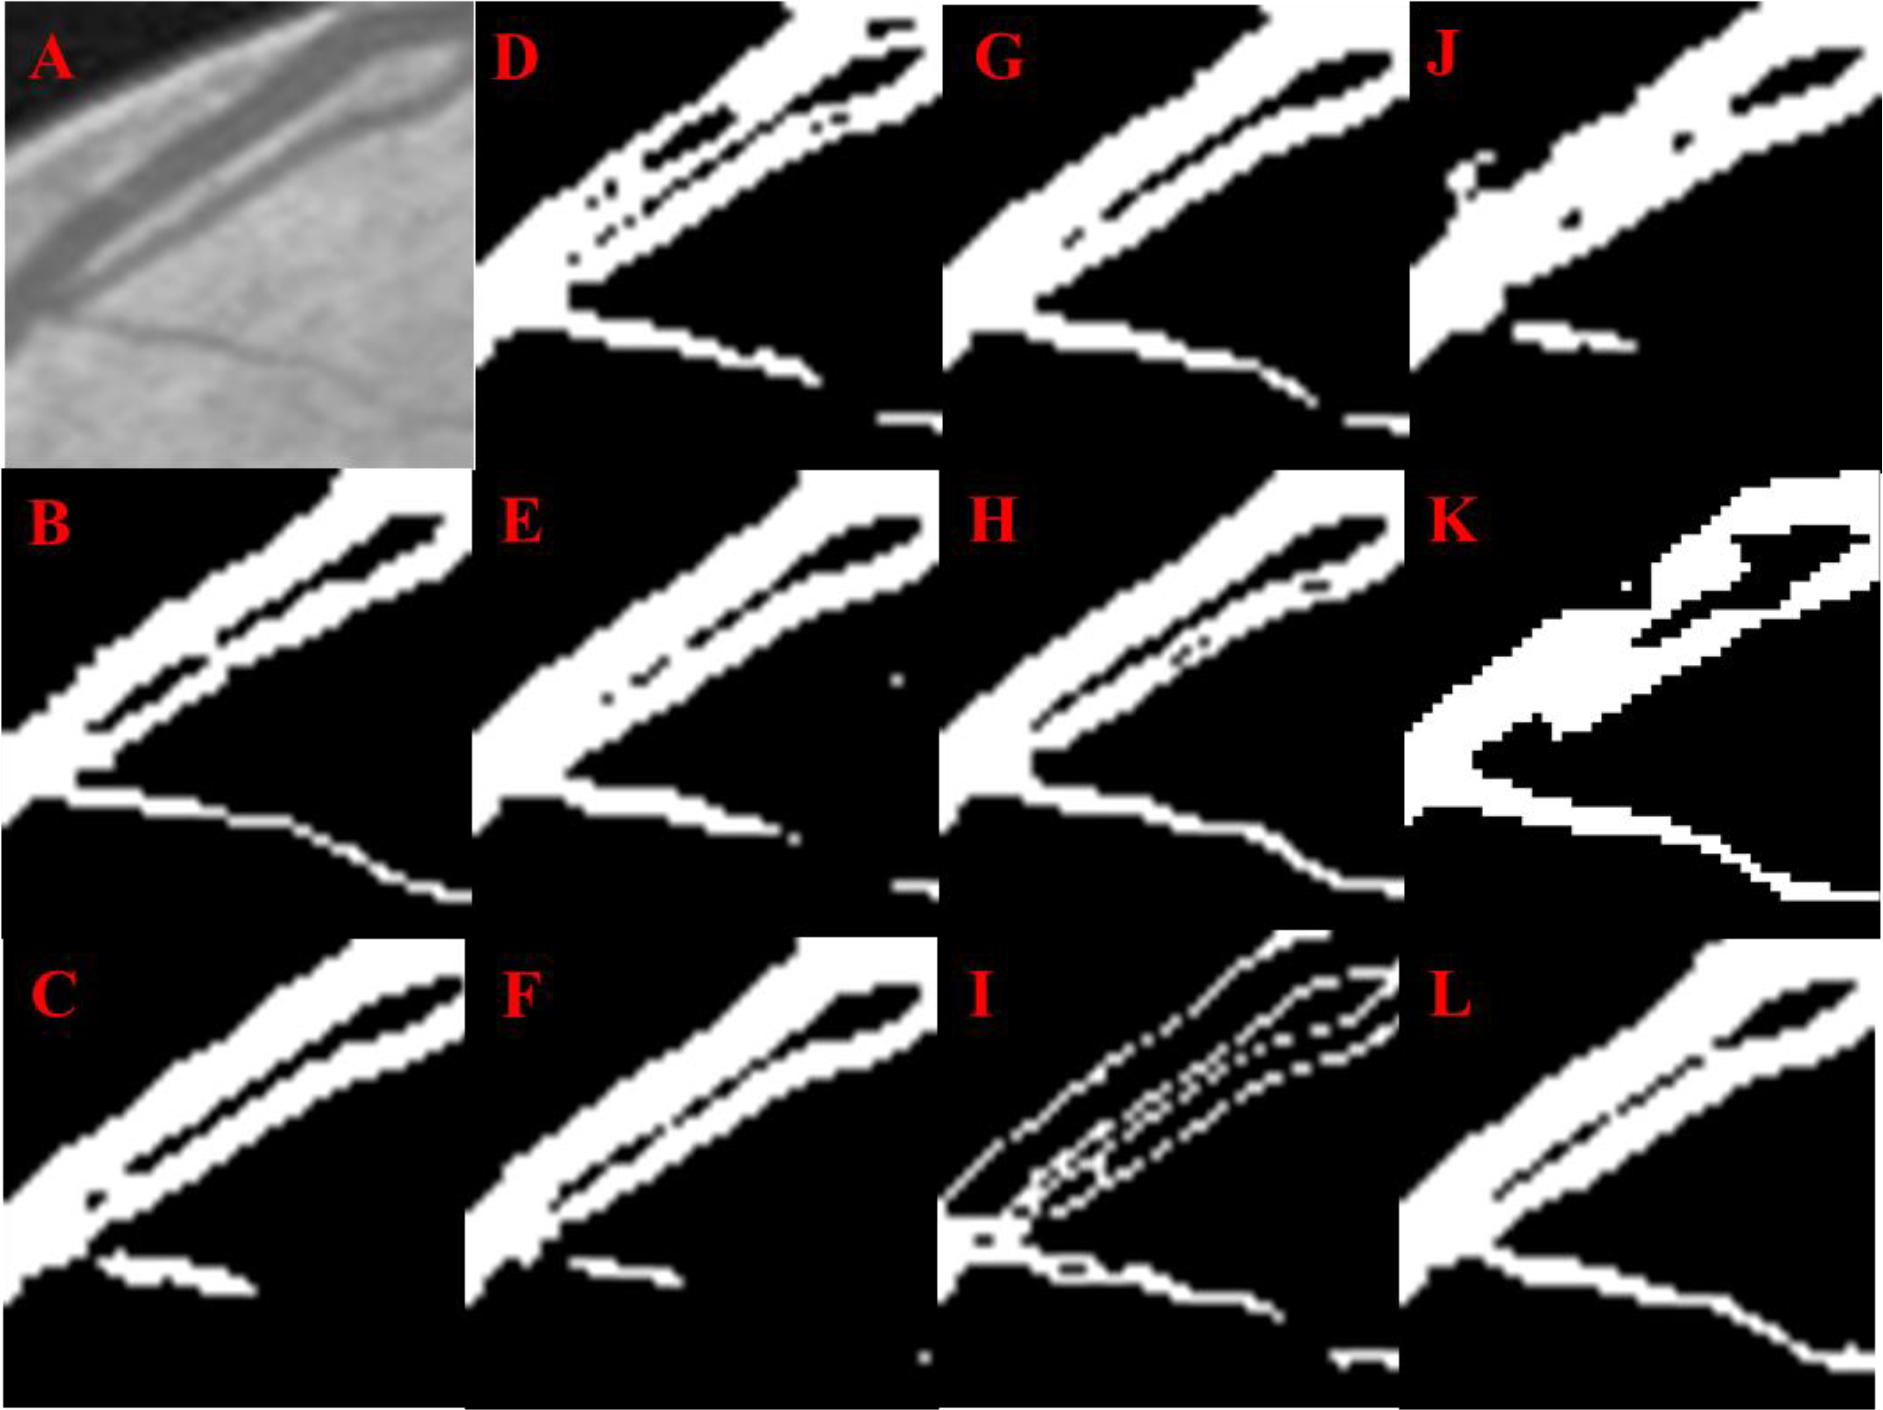
Retinal vessel segmentation: Original image (A), Manual segmentation (B), U-Net (C), Res U-Net (D), Attention U-Net (E), U-Net++ (F), Attn. Res U-Net (G), R2 U-Net (H), Inception U-Net (I), Res U-Net++ (J), LinkNet (K), Super U-Net (L)
(2). CHASE DB1 segmentation results
Super U-Net’s performance segmenting retail vessels on pediatric fundus images based on average DSC, accuracy, PPV, and sensitivity was 0.752(±0.019), 0.966(±0.003), 0.967(±0.003), and 0.769(±0.040), respectively. Super U-Net significantly outperformed the other U-Net networks and SegNet based on DSC and sensitivity (p < 0.05) and had comparable performance in terms of accuracy and PPV (Table 2). LinkNet had the second best performance with a DSC of 0.745±0.023 and the best performance on sensitivity (0.773±0.03). Super U-Net demonstrated the ability to segment retinal vessels when trained separately with only 20 images based on visual inspection (Fig. 6).
Table 2.
The average performance metrics for segmenting retinal vessels in the CHASE DB1 testing dataset of pediatric fundus images (n=28).
| Architecture | Dice Coefficient | Accuracy | PPV | Sensitivity |
|---|---|---|---|---|
|
| ||||
| U-Net | 0.581±0.043 | 0.955±0.004 | 0.951±0.004 | 0.470±0.054 |
| SegNet | 0.719±0.020 | 0.962±0.004 | 0.962±0.003 | 0.724±0.039 |
| LinkNet | 0.745±0.023 | 0.967±0.003 | 0.966±0.003 | 0.773±0.03 |
| Inception U-Net | 0.519±0.074 | 0.954±0.006 | 0.951±0.006 | 0.378±0.081 |
| Attention U-Net | 0.640±0.269 | 0.752±0.229 | 0.905±0.068 | 0.751±0.229 |
| Res U-Net | 0.739±0.048 | 0.968±0.004 | 0.967±0.004 | 0.702±0.081 |
| R2 U-Net | 0.347±0.038 | 0.601±0.004 | 0.572±0.005 | 0.669±0.049 |
| Attn. Res U-Net | 0.675±0.034 | 0.953±0.007 | 0.959±0.004 | 0.717±0.066 |
| U-Net++ | 0.731±0.039 | 0.968±0.002 | 0.967±0.002 | 0.673±0.073 |
| Res U-Net++ | 0.529±0.034 | 0.769±0.009 | 0.927±0.014 | 0.738±0.035 |
| Super U-Net | 0.752±0.019 | 0.966±0.003 | 0.967±0.003 | 0.769±0.040 |
Fig 6.
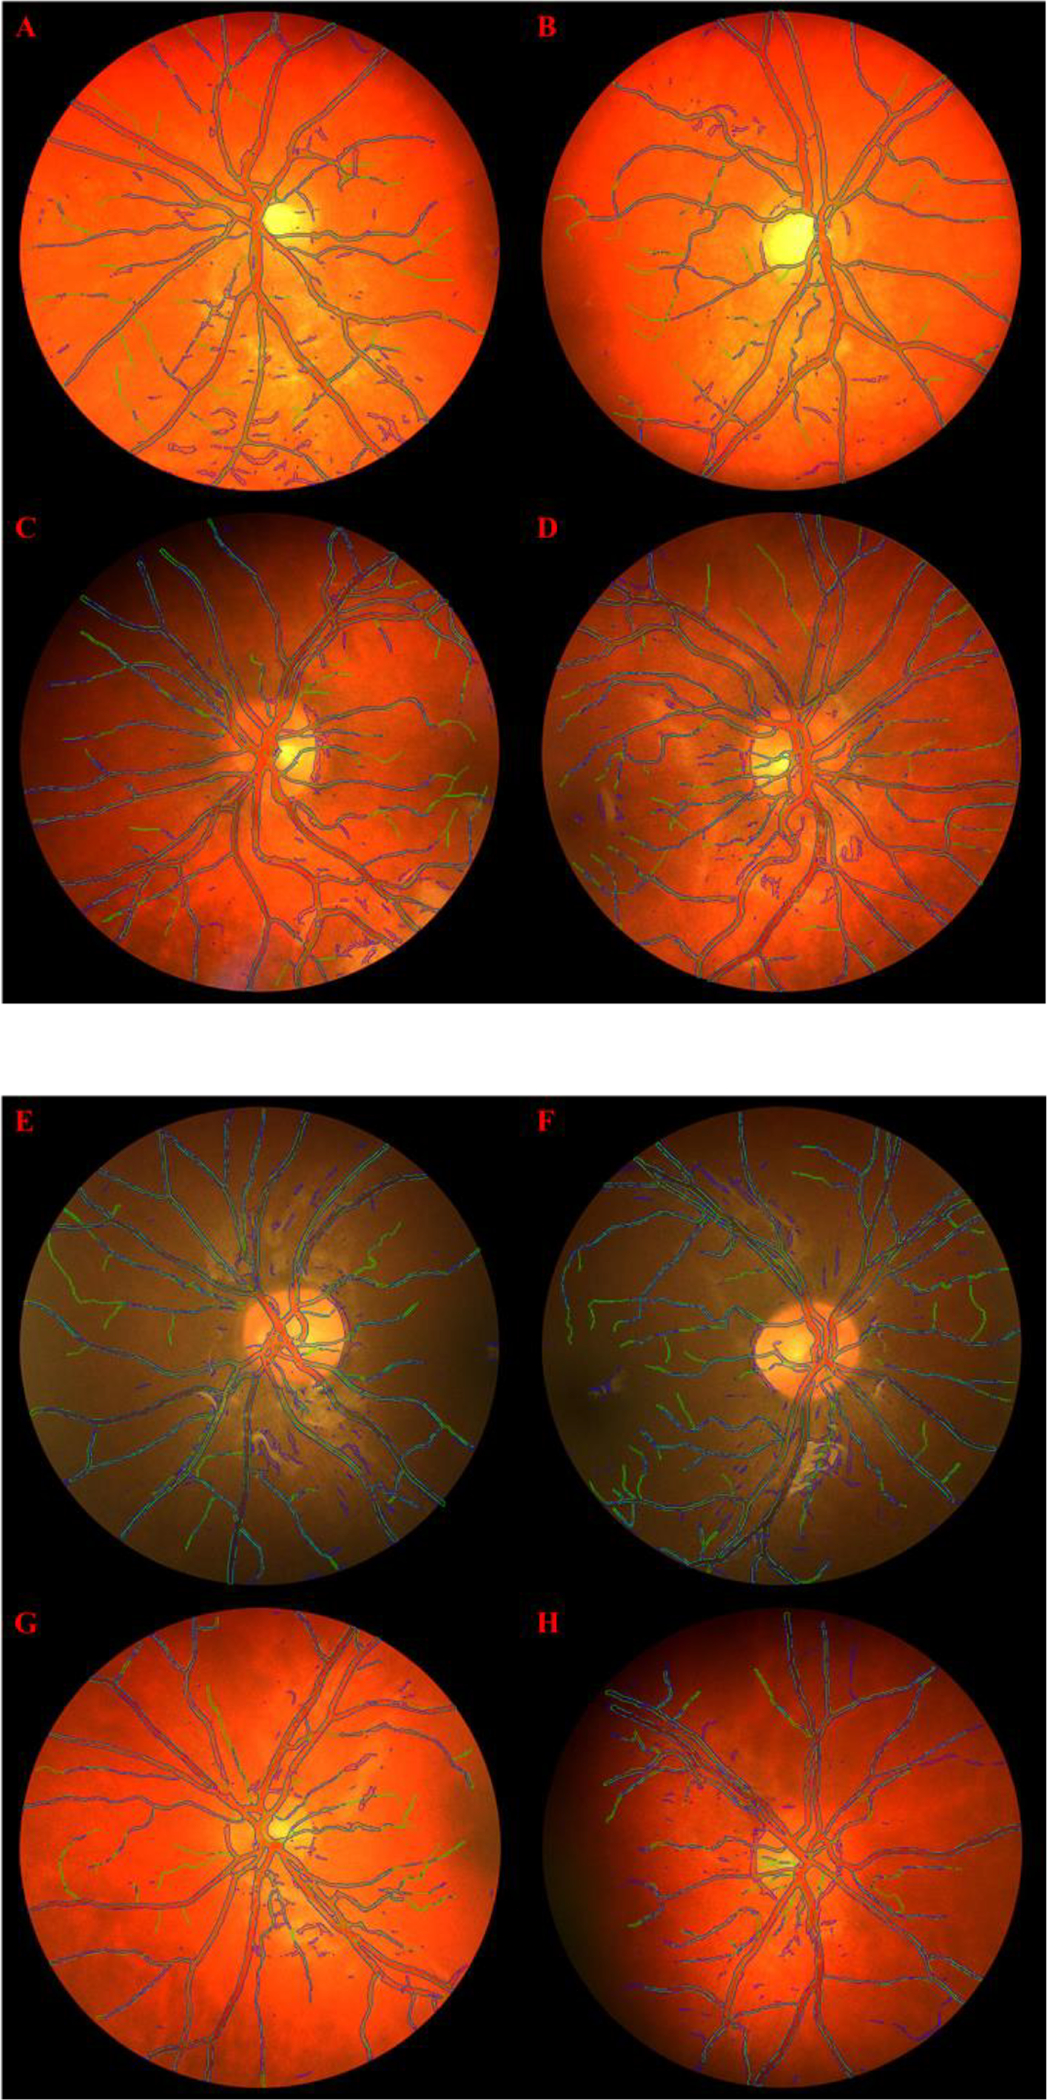
Retinal vessel segmentation results for 8 validation images generated by Super U-Net (outlined in blue) compared to the manual outline (outlined in green) on the CHASE DB1 dataset when trained on a 20/8 train/test split.
(3). Kvasir-SEG segmentation results
In segmenting GI polyps, the Super U-Net achieved an average DSC, accuracy, and sensitivity of 0.804(±0.239), 0.946(±0.000), and 0.809(±0.256), which were significantly higher (p < 0.05) than the traditional U-Net, seven U-Net variants and SegNet (Table 3), with the exception of LinkNet that had superior performance in sensitivity (0.830±0.221). Visual inspection again demonstrated the overall better performance of Super U-Net compared to other state-of-art CNN-based segmentation architectures (Figs.7 and 8).
Table 3.
The average performance metrics for segmenting GI polyps in the Kvasir-SEG testing dataset (n=1000).
| Architecture | Dice Coefficient | Accuracy | Sensitivity |
|---|---|---|---|
|
| |||
| U-Net | 0.621±0.310 | 0.905±0.000 | 0.626±0.335 |
| SegNet | 0.643±0.225 | 0.889±0.090 | 0.658±0.264 |
| LinkNet | 0.781±0.223 | 0.940±0.080 | 0.830±0.221 |
| Inception U-Net | 0.590±0.306 | 0.882±0.000 | 0.659±0.328 |
| Attention U-Net | 0.545±0.303 | 0.868±0.000 | 0.619±0.336 |
| Res U-Net | 0.696±0.272 | 0.919±0.000 | 0.717±0.276 |
| R2 U-Net | 0.512±0.256 | 0.851±0.000 | 0.634±0.288 |
| Attn. Res U-Net | 0.559±0.262 | 0.880±0.000 | 0.620±0.289 |
| U-Net++ | 0.746±0.231 | 0.930±0.000 | 0.769±0.245 |
| Res U-Net++ | 0.704±0.293 | 0.913±0.000 | 0.726±0.301 |
| Super U-Net | 0.804±0.239 | 0.946±0.000 | 0.809±0.256 |
Fig 7.
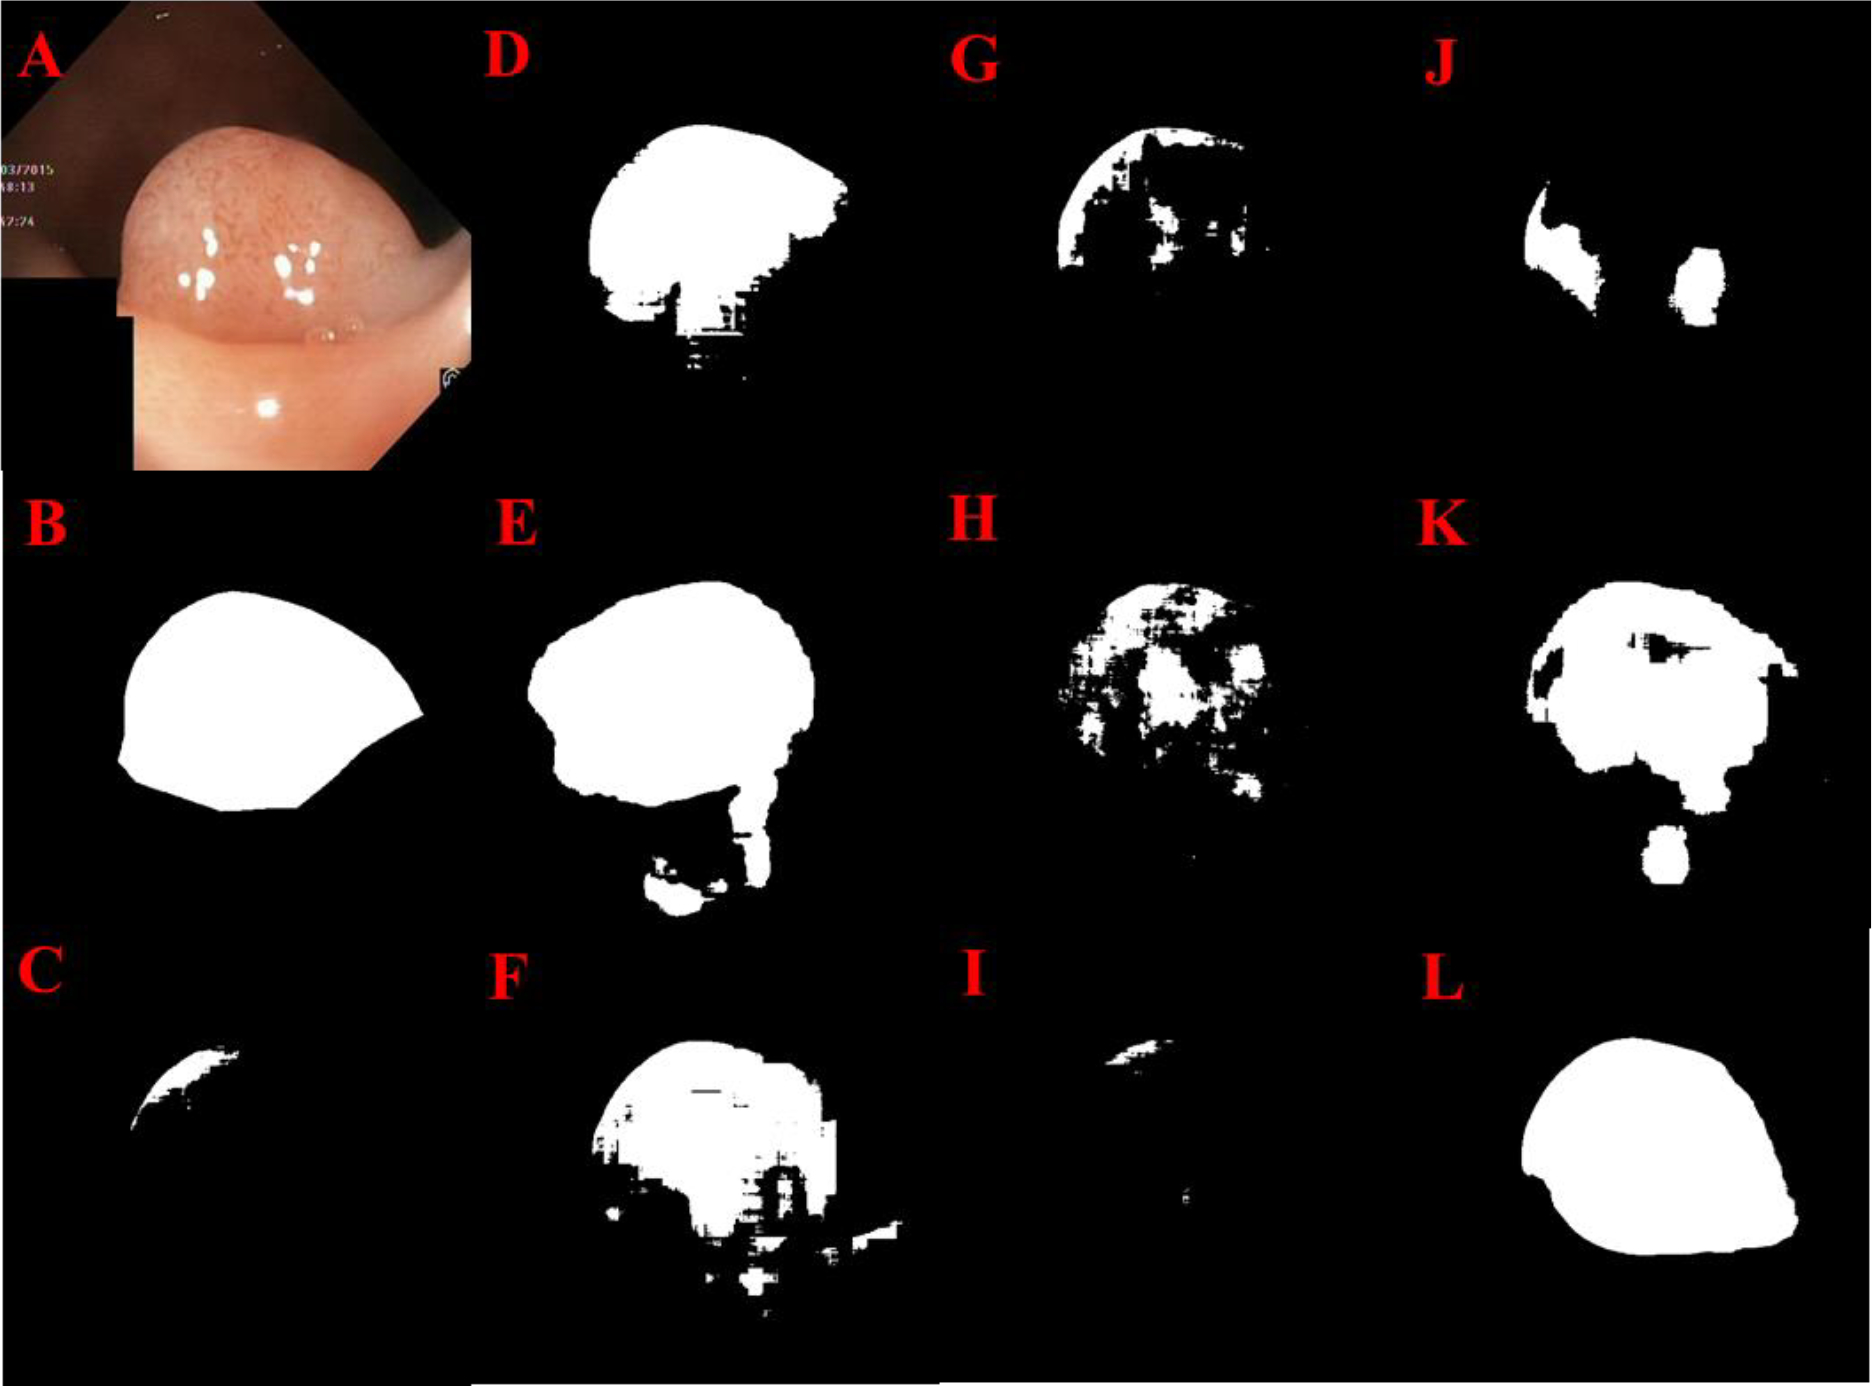
GI polyp segmentation results: Original image (A), Manual segmentation (B), U-Net (C), Res U-Net (D), LinkNet (E), U-Net++ (F), Attn. Res U-Net (G), R2 U-Net (H), Inception U-Net (I), Res U-Net++ (J), SegNet (K) Super U-Net (L)
Fig. 8.
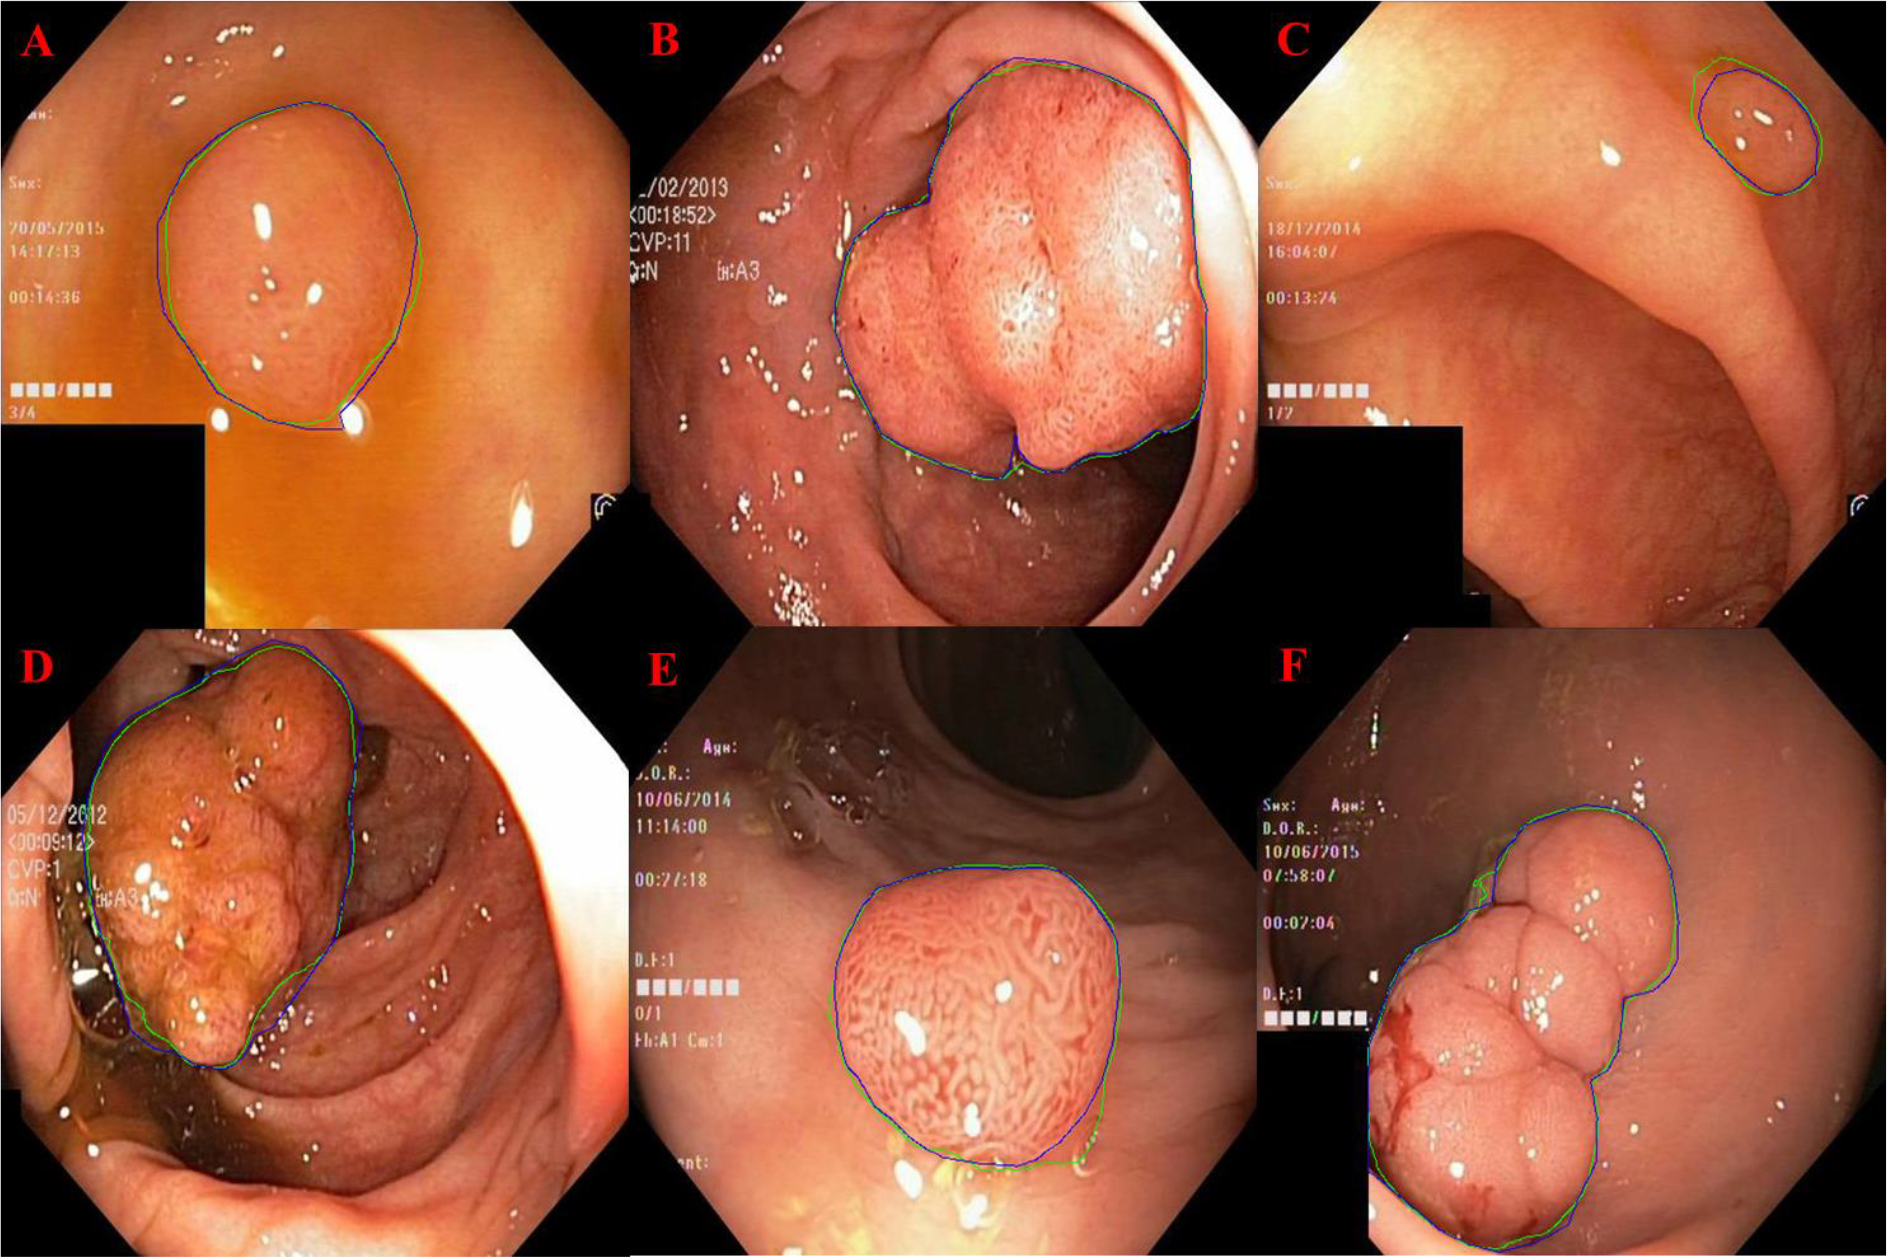
GI polyp segmentation results for Super U-Net (outlined in blue) compared to manual segmentation (outlined in green).
(4). ISIC Segmentation Results
The Super U-Net achieved a DCS, accuracy, PPV, and sensitivity of 0.877(±0.135), 0.956(±0.038), 0.963(±0.029), and 0.910(±0.169), respectively, for segmenting skin lesions (Table 4). Super U-Net significantly outperformed all other networks in DSC (p < 0.05). Super U-Net demonstrated the ability to segment skin lesions when the gradient between the lesion and normal skin was low and in the presence of background noise (Figs. 9 and 10).
Table 4.
Performance metrics for segmenting skin lesions in the ISIC dataset (n=200)
| Architecture | Dice Coefficient | Accuracy | PPV | Sensitivity |
|---|---|---|---|---|
|
| ||||
| U-Net | 0.826±0.158 | 0.928±0.050 | 0.943±0.067 | 0.877±0.170 |
| SegNet | 0.619±0.283 | 0.763±0.250 | 0.895±0.078 | 0.694±0.313 |
| LinkNet | 0.821±0.166 | 0.925±0.074 | 0.943±0.053 | 0.853±0.187 |
| Inception U-Net | 0.677±0.289 | 0.813±0.201 | 0.909±0.075 | 0.826±0.285 |
| Attention U-Net | 0.640±0.269 | 0.752±0.229 | 0.905±0.068 | 0.917±0.172 |
| Res U-Net | 0.665±0.252 | 0.787±0.192 | 0.914±0.058 | 0.787±0.193 |
| R2 U-Net | 0.837±0.175 | 0.936±0.066 | 0.951±0.044 | 0.871±0.212 |
| Attn. Res U-Net | 0.704±0.280 | 0.857±0.171 | 0.919±0.068 | 0.803±0.299 |
| Res U-Net++ | 0.846±0.140 | 0.942±0.060 | 0.954±0.037 | 0.853±0.170 |
| Super U-Net | 0.877±0.135 | 0.956±0.038 | 0.963±0.029 | 0.910±0.169 |
Fig 9.
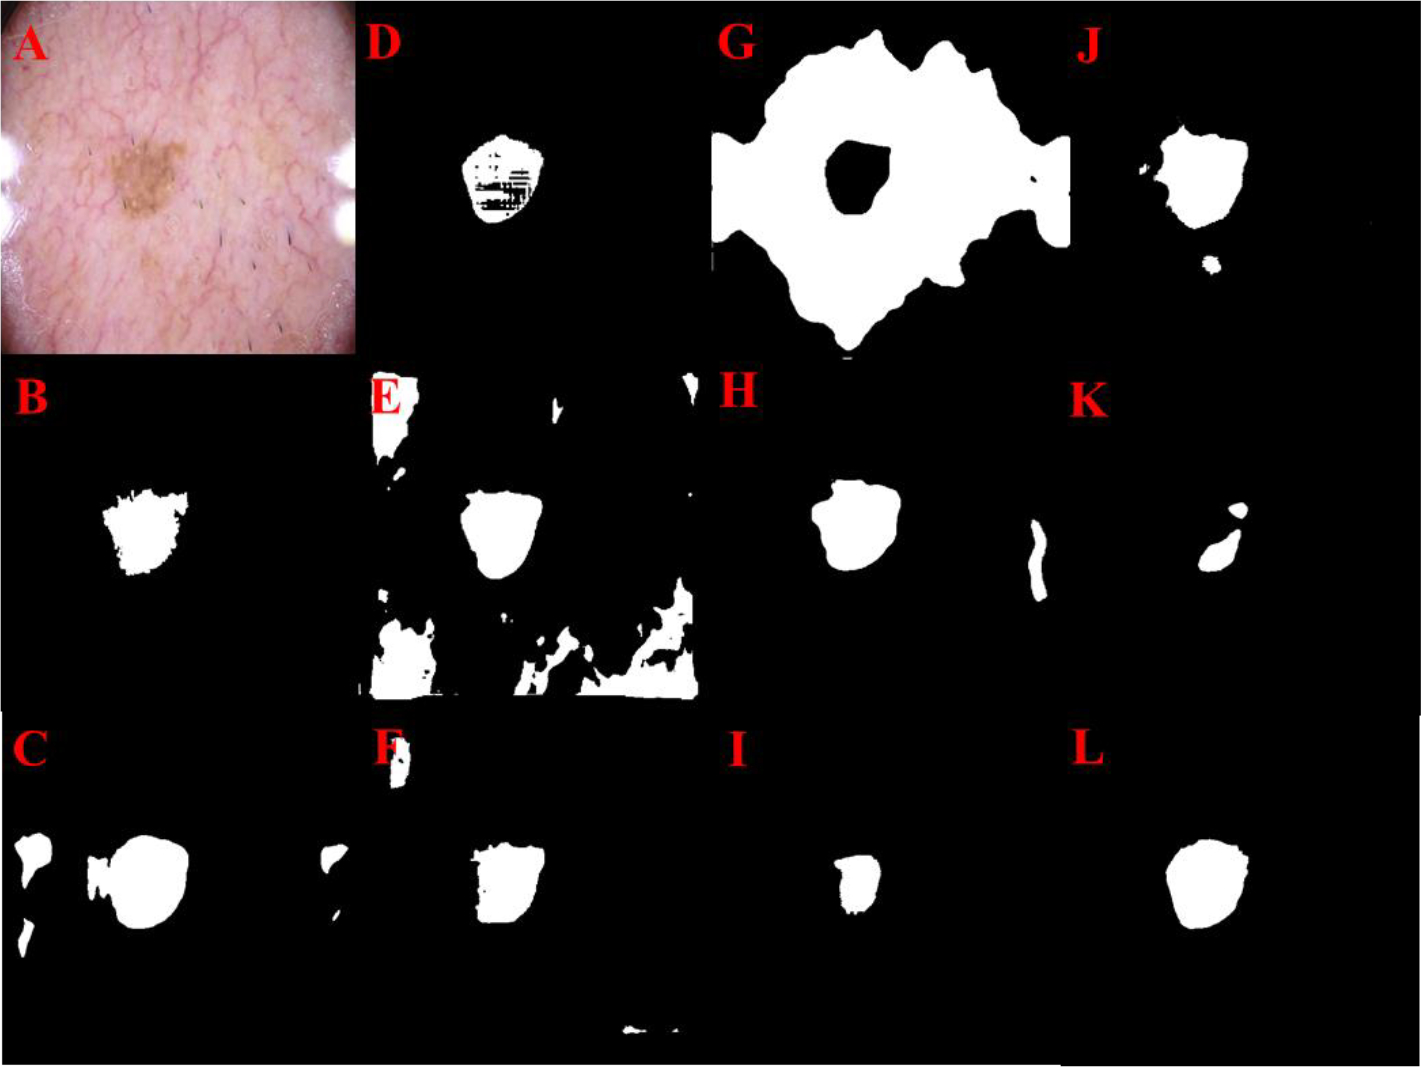
Skin lesion segmentation results: Original image (A), Manual segmentation (B), U-Net (C), Res U-Net (D), Attention U-Net (E), U-Net++ (F), LinkNet (G), R2 U-Net (H), Inception U-Net (I), Res U-Net++ (J), SegNet (K) Super U-Net (L)
Fig. 10.
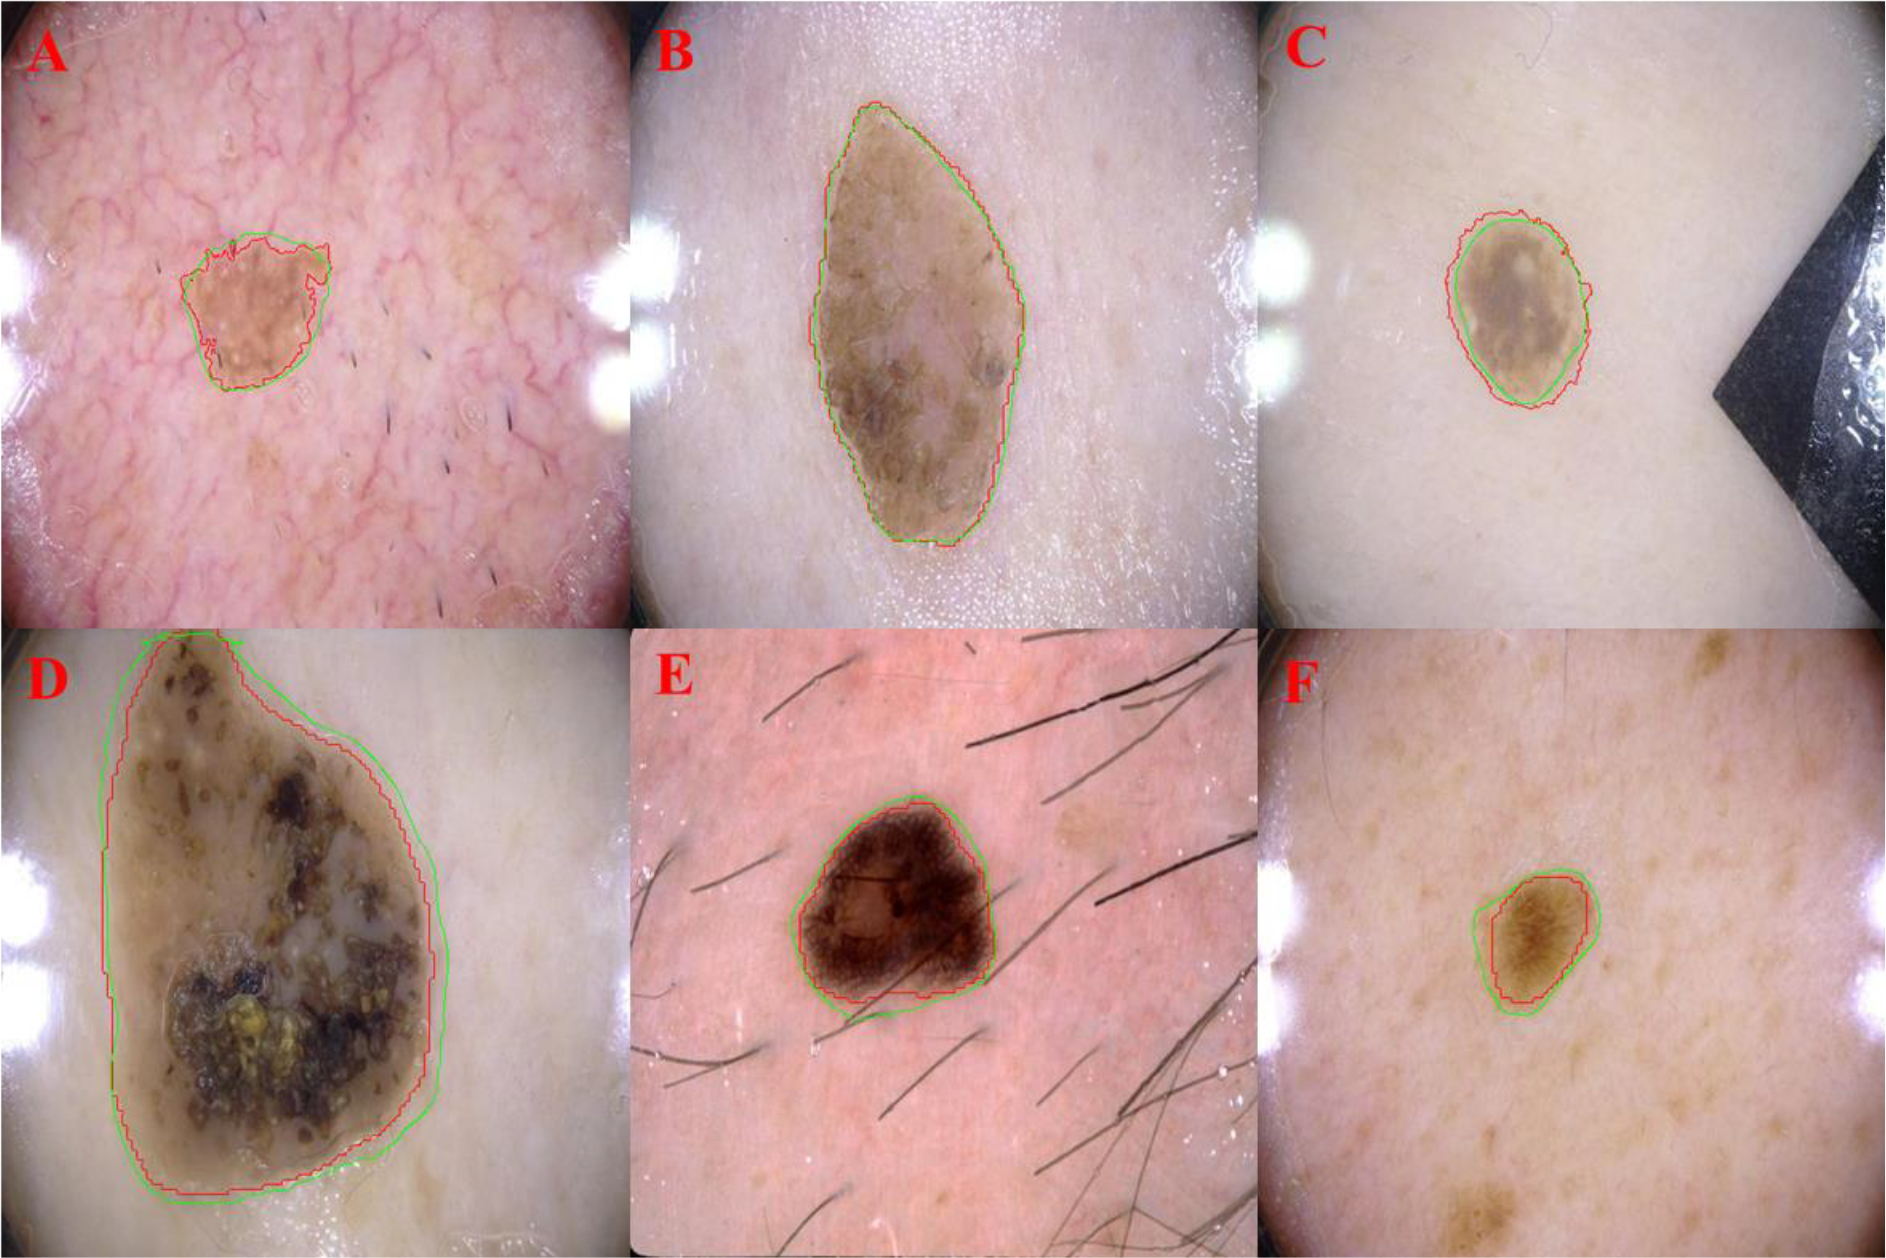
Examples demonstrating the ability of Super U-Net in segmenting cancerous skin lesions. The computerized segmentations were outlined in green, and the manual segmentations were outlined in red.
(5). Ablation Experiment
The Super U-Net showed the best performance in the ablation analysis with an average DSC, accuracy, PPV and sensitivity of 0.794 (±0.026), 0.967(±0.004), 0.882(±0.034), and 0.726(±0.058) respectively for segmenting retinal vessels in the DRIVE testing dataset (Table 5). DSC and sensitivity were significantly greater (p < 0.05) than the DSC and sensitivity for U-Net (Table 6). The traditional U-Net, U-Net with the dynamic receptive field module, and U-Net with the fusion upsampling had an average DSC of 0.769 (±0.349), 0.778 (±0.030), and 0.787 (±0.026), respectively, for segmenting retinal vessels (Table 5). The Super U-Net outperformed the traditional U-Net on all (20/20) of test images based on DSC (Table 7).
Table 5.
The mean performance metrics of U-Net, dynamic receptive fields, fusion upsampling, and Super U-Net for segmenting retinal vessels in the DRIVE testing dataset (n=20).
| Architecture | Dice | accuracy | PPV | sensitivity |
|---|---|---|---|---|
|
| ||||
| U-Net | 0.769±0.035 | 0.965±0.005 | 0.904±0.036 | 0.673±0.065 |
| U-Net w/ dynamic receptive fields | 0.778±0.030 | 0.965±0.005 | 0.875±0.035 | 0.705±0.059 |
| U-Net w/ fusion upsampling | 0.787±0.026 | 0.966±0.004 | 0.879±0.039 | 0.718±0.063 |
| Super U-Net | 0.794±0.026 | 0.967±0.004 | 0.082±0.034 | 0.726±0.058 |
Table 6.
Individual DSC values for U-Net and Super U-Net for segmenting retinal vessels in the training dataset.
| Image Names | U-Net DSC | Super U-Net DSC |
|---|---|---|
|
| ||
| 01_test | 0.808 | 0.821 |
| 02_test | 0.808 | 0.833 |
| 03_test | 0.779 | 0.795 |
| 04_test | 0.780 | 0.807 |
| 05_test | 0.751 | 0.776 |
| 06_test | 0.730 | 0.769 |
| 07_test | 0.752 | 0.784 |
| 08_test | 0.710 | 0.745 |
| 09_test | 0.695 | 0.744 |
| 10_test | 0.763 | 0.789 |
| 11_test | 0.766 | 0.791 |
| 12_test | 0.775 | 0.797 |
| 13_test | 0.742 | 0.783 |
| 14_test | 0.790 | 0.808 |
| 15_test | 0.773 | 0.794 |
| 16_test | 0.776 | 0.807 |
| 17_test | 0.741 | 0.776 |
| 18_test | 0.786 | 0.797 |
| 19_test | 0.854 | 0.859 |
| 20_test | 0.790 | 0.806 |
| Average | 0.769 | 0.794 |
| Std. Dev | 0.035 | 0.026 |
4. Discussion
We developed a CNN model termed Super U-Net to improve image segmentation of the published U-Net models. The performance of the Super U-Net was significantly better than the traditional U-Net architecture and seven U-Net variants for segmenting retinal vessels, GI polyps, and skin lesions. The unique characteristic of the Super U-Net is the incorporation of multiscale spatial features and semantically dissimilar skip connections. The novel dynamic receptive field module and the fusion upsampling module allow Super U-Net to adapt to a segmentation task across each training iteration. Super U-Net incorporates multiscale spatial features and can unify feature maps across the skip connection. Super U-Net’s spatial awareness was demonstrated by its ability to adapt to the GI polyp and skin lesion segmentation tasks, which offered spatial variability between each of the different types of images. The network selected the appropriate kernel size within the dynamic receptive field module by using spatial feature adaption. Improving the skip connection with the fusion upsampling module allows Super U-Net to differentiate semantically vague segmentation boundaries. Proper fusion of the encoder and decoder protected Super U-Net from losing valuable information during upsampling. The motivation of applying channel-wise squeeze and excitation operations is to emphasize the significant aspects of the upsampled features from the decoder layer prior to being concatenated with the encoder’s feature maps. Upsampling after recalibration allows for an improved fusion of low-level encoder feature maps with high-level decoder feature maps because it emphasizes feature relationships before upsampling occurs.
These modules allowed Super U-Net to significantly improve segmentation performance compared to the traditional U-Net and seven U-Net variants when segmenting retinal vessels (Tables 1 and 2) and GI polyps (Table 3) and skin lesions (Table 4). Although Super U-Net had significantly better performance at segmenting retinal vessels (Table 1), the performance improvement was relatively small. We attribute the small performance gains in segmenting retinal vessels to scale-invariant and self-similarity characteristics of the vessels, which simplifies the segmentation task. This lack of variability caused the network to not require assistance from the dynamic receptive field module. However, this demonstrates that Super U-Net can still perform well on uniform datasets. Super U-Net demonstrated a DSC improvement of greater than 2% as compared to all other networks for segmenting skin lesions (Table 4). Furthermore, the Super U-Net had the largest performance gains with a DSC 5% greater than the next best model (U-Net++ w/ DSC of 0.746) for segmenting polyps (Table 3), which suggests that the inclusion of fusion upsampling and dynamic receptive fields improves general performance without increasing parameters. Super U-Net also outperformed U-Net++ with less than half the parameters (4.2 million vs. 9.0 million).
Patch generation was used to train Super U-Net to segment retinal vessels based on: (1) the size of the dataset, (2) the detail level of the target object, and (3) the importance of global features required for the segmentation task. First, the DRIVE and CHASE DB1 datasets only included 40 and 28 images, respectively, and required the use of multiple approaches to increase the size of trainable data. While augmentation allowed us to greatly increase the diversity of the data, random patch generation enabled us to generate a large number of unique patches from a single image. Second, small vessels depicted on retinal images are critical to assess early disease, but can be difficult to segment accurately. The patch-based strategy retained the original resolution of the images, which facilitated the segmentation of small retinal vessels. Third, retinal vessel segmentation does not heavily rely on global spatial contexts when generating ROIs. This enables the accurate segmentation of local patches. In contrast, polyp and lesion segmentation relied heavily on global spatial features. It is desirable to visualize the entire polyp or lesion in the image under analysis to allow the network to understand unique segmentation boundaries. Finally, testing the Super U-Net on both the patch and the entire images may enable a better understanding of its potential in image segmentation.
The optical techniques of fundus imaging can create images whose appearance and characteristics may vary significantly due to a number of factors, which include imaging devices, ambient light, patient cooperation, and camera focus. This often results in significant performance variation across datasets. The CHASE DB1 dataset allowed us to study the segmentation performance of Super U-Net on a small dataset acquired on children. When training a segmentation model on a small dataset, a significant number of image patches have to be sampled. Despite the limited number of images in this dataset, Super U-Net showed significant performance gains in segmenting retinal vessels on pediatric images compared to the other networks based on DSC and sensitivity (p < 0.05) (Table 2).
The addition of individual modules to the traditional U-Net architecture did not uniformly correlate to improved performance on all datasets (Tables 1, 2, 3, 4). Some networks (Attn. Res U-Net, Res U-Net++) employed additional modules to increase performance on a single dataset, but these models failed to show generalizable performance gains. Furthermore, the two non-U-Net segmentation architectures, SegNet and LinkNet, demonstrated reasonable performance when compared to Super U-Net in certain segmentation tasks. LinkNet was the most capable model out of all architectures we compared, demonstrating second best performance on the CHASE-DB1 dataset, as well as the best performance in the metric sensitivity on two datasets. This result suggests that using skip connections with summation rather than concatenation could yield better results in certain segmentation tasks, which is a topic for future research. SegNet performed well on RGB images but failed to converge on single-channel fundus images. We attribute this to SegNet being designed for traditional computer vision tasks rather than medical imaging. Our results suggest that all networks had worse performance when segmenting retinal vessels on pediatric images that had large spatial variability between images (Table 2). The images depicting polyps had unique spatial and semantic differences creating a more challenging segmentation task. The retinal images were more uniform. Consequently, the DSC performance of the traditional U-Net and seven U-Net variants had a larger range of performance for segmenting polyps compared to retinal vessels. However, the Super U-Net was able to maintain stable performance for segmenting polyps, skin lesions, or retinal vessels with DSC values of 0.808, 0.877, 0.804, and 0.752, respectively. We attribute this stability to the Super U-Net’s ability to adapt to individual segmentation tasks.
When the dynamic receptive field and the fusion upsampling modules were separately added to the basic U-Net CNN, there were slight performance gains for segmenting the retinal vessels (Table 5). The average DSC for retinal vessel segmentation for U-Net, U-Net with dynamic receptive fields, U-Net with fusion upsampling, and Super U-Net were 0.769 (±0.035), 0.778 (±0.030), 0.787 (±0.026), and 0.794 (±0.026), respectively. Additionally, on the 20 test images, Super U-Net outperformed U-Net on each image, demonstrating consistent segmentation improvement (Table 6). The inclusion of the dynamic receptive fields or the fusion upsampling modules demonstrated the ability to significantly improve the performance of the traditional U-Net architecture.
There are limitations with this study. First, the size of publicly annotated medical image datasets was small. However, this small size may more faithfully demonstrate the contribution of a CNN architecture to the segmentation performance. Super U-net’s ability to achieve improved performance with limited data suggests that the architecture is generalizable across image types and segmentation tasks. Second, the GI polyp and skin lesion images were resized to 512×512 pixels due to hardware limits (e.g., GPU memory). This resizing operation might affect the performance of an individual CNN model, but it should not affect the performance differences between the CNN models. All of the models were trained using the same datasets under the same training conditions or parameters. Third, the Super U-Net and other CNN models were developed and tested on four segmentation tasks; however, we believe that size and breadth of the datasets were sufficient to compare the performance of the Super U-Net to other U-Net architectures.
5. Conclusion
We described a novel CNN architecture termed Super U-Net in this study. Its unique characteristic is the incorporation of two novel modules, namely the dynamic receptive field module and the fusion upsampling module, which are used to generate multiscale spatial features and semantically dissimilar skip connections. We tested the performance of Super U-Net by applying it to the segmentation of retinal vessels, polyps, and skin lesions on four different datasets. Our experiments showed that integrating the two modules improved the segmentation performance significantly compared to state-of-the-art CNN models, including the classical U-Net, seven U-Net variants, and two non-U-Net architectures. At this moment, we only validated the segmentation performance of Super U-Net on 2-D images. In the future, we will implement its 3-D version and validate its segmentation performance on radiological images (e.g., computed tomography (CT) and magnetic resonance imaging (MRI)). In addition, we will explore the potential of Super U-Net for other medical image analysis tasks (e.g., classification and registration).
Highlights.
A novel convolutional neural network termed „Super U-Net” for medical image segmentation.
A fusion upsampling module that recalibrates feature maps prior to concatenation.
A dynamic receptive field module that allows the network to determine the correct kernel size for the current segmentation task.
Comparative experiments were performed on the Super U-Net, seven U-Net variants, and two non-U-Net segmentation architectures on the DRIVE, CHASE DB1, Kvasir-SEG, and ISIC 2017 datasets.
ACKNOWLEDGEMENT
This work is supported by the National Institutes of Health (NIH) (Grant No. R01CA237277) and the UPMC Hillman Developmental Pilot Program.
Biography
Cameron Beeche received his B.Sc. degree in Computer Science from the University of Pittsburgh, Pittsburgh, Pennsylvania 2021. His research interests include machine learning, computer vision, artificial intelligence, medical image segmentation, and medical image classification.
Footnotes
Declaration of Interests
The authors have no conflicts of interest to declare.
Publisher's Disclaimer: This is a PDF file of an unedited manuscript that has been accepted for publication. As a service to our customers we are providing this early version of the manuscript. The manuscript will undergo copyediting, typesetting, and review of the resulting proof before it is published in its final form. Please note that during the production process errors may be discovered which could affect the content, and all legal disclaimers that apply to the journal pertain.
References
- [1].Lifeng Qiao YZ, Zhou Hui, “Diabetic Retinopathy Detection Using Prognosis of Microaneurysm and Early Diagnosis System for Non-Proliferative Diabetic Retinopathy Based on Deep Learning Algorithms,” IEEE Access, vol. 8, pp. 104292–104302, 2020. [Google Scholar]
- [2].Kuan-Song Wang GY, Chao Xu, et al. , “Accurate diagnosis of colorectal cancer based on histopathology images using artificial intelligence,” BMC Med, vol. 19, 2021. [DOI] [PMC free article] [PubMed] [Google Scholar]
- [3].Lennox Hoyte WY, Brubaker Linda, Fielding Julia R., Lockhard Mark E., Heilbrun Marta E., Brown Morton B., Warfield Simon K., “Segmentations of MRI Images of the Female PelvicFloor: A Study of Inter- and Intra-reader Reliability,” Journal of Magnetic Resonance Imaging, vol. 33, pp. 684–691, 2011. [DOI] [PMC free article] [PubMed] [Google Scholar]
- [4].Frezghi Habte SB, Shay Keren1, Doyle Timothy C,, Levin Craig S, Paik David S, “In situ study of the impact of inter- and intra-reader variability on region of interest (ROI) analysis in preclinical molecular imaging,” American journal of nuclear medicine and molecular imaging, vol. 3, pp. 175–181, 2013. [PMC free article] [PubMed] [Google Scholar]
- [5].Aggarwal N. S. a. L. M., “Automated medical image segmentation techniques,” Journal of Medical Physics, vol. 35, 2010. [DOI] [PMC free article] [PubMed] [Google Scholar]
- [6].Leo C.S. LCCT, Suneetha V, “An Automated Segmentation Algorithm for Medical Images,” 13th International Conference on Biomedical Engineering, vol. 23, 2009. [Google Scholar]
- [7].Kaus MR, Warfield SK, Nabavi A, Black PM, Jolesz FA, and Kikinis R, “Automated Segmentation of MR Images of Brain Tumors,” Radiology, vol. 218, no. 2, pp. 586–591, 2001, doi: 10.1148/radiology.218.2.r01fe44586. [DOI] [PubMed] [Google Scholar]
- [8].Fu R et al. , “Automated delineation of orbital abscess depicted on CT scan using deep learning,” Medical Physics, no. in press, 2021. [DOI] [PMC free article] [PubMed] [Google Scholar]
- [9].Wang L et al. , “Automated segmentation of the optic disc from fundus images using an asymmetric deep learning network,” Pattern Recognition, vol. 112, p. 107810, 2021/04/01/ 2021, doi: 10.1016/j.patcog.2020.107810. [DOI] [PMC free article] [PubMed] [Google Scholar]
- [10].Ashraf SF et al. , “Predicting benign, preinvasive, and invasive lung nodules on computed tomography scans using machine learning,” J Thorac Cardiovasc Surg, Feb 16 2021, doi: 10.1016/j.jtcvs.2021.02.010. [DOI] [PubMed] [Google Scholar]
- [11].Zhen Y, Chen H, Zhang X, Meng X, Zhang J, and Pu J, “Assessment of Central Serous Chorioretinopathy Depicted on Color Fundus Photographs Using Deep Learning,” Retina, vol. 40, no. 8, pp. 1558–1564, Aug 2020, doi: 10.1097/IAE.0000000000002621. [DOI] [PubMed] [Google Scholar]
- [12].Olaf Ronneberger Phillip Fischer a. T. B., “U-Net: Convolutional Networks for Biomedical Image Segmentation,” in International Conference on Medical image computing and computer-assisted intervention, pp. 234–241, 2015. [Google Scholar]
- [13].Liang-Chieh Chen GP, Schroff Florian, Adam Hartwig, “Rethinking Atrous Convolution for Semantic Image Segmentation,” ArXiv, 2017. [Google Scholar]
- [14].Zongwei Zhou MMRS, Tajbakhsh Nima, Liang Jianming, “UNet++: A Nested U-Net Architecture for Medical Image Segmentation,” Deep Learning in Medical Image Analysis and Multimodal Learning for Clinical Decision Support, pp. 3–11, 2018. [DOI] [PMC free article] [PubMed] [Google Scholar]
- [15].Christian Szegedy WL, Jia Yangqing, Sermanet Pierre, Reed Scott, Anguelov Dragomir, Erhan Dumitru, Vanhoucke Vincent, Rabinovich Andrew, “Going deeper with convolutions,” 2015 IEEE Conference on Computer Vision and Pattern Recognition (CVPR), pp. 1–9, 2015. [Google Scholar]
- [16].Kaiming He XZ, Ren Shaoqing, Sun Jian, “Deep Residual Learning for Image Recognition,” IEEE Conference on Computer Vision and Pattern Recognition (CVPR), pp. 770–778, 2016. [Google Scholar]
- [17].Ozan Oktay JS, Le Folgoc Loic, Lee Matthew, Heinrich Mattias, Misawa Kazunari, Mori Kensaku, McDonagh Steven, Hammerla Nils Y, Kainz Bernhard, Glocker Ben, Rueckert Daniel, “Attention U-Net: Learning Where to Look for the Pancreas,” Medical Imaging with Deep learning, 2018. [Google Scholar]
- [18].Md Zahangir Alom MH, Yakopcic Chris, Taha Tarek M., Asari Vijayan K., “Recurrent Residual Convolutional Neural Network based on U-Net (R2U-Net) for Medical Image Segmentation,” Journal of Medical Imaging, vol. 6, 2019. [DOI] [PMC free article] [PubMed] [Google Scholar]
- [19].Zhengxin Zhang QL, Wang Yunhong, “Road Extraction by Deep Residual U-Net,” IEEE Geoscience and Remote Sensing Letters, vol. 15, no. 5, pp. 749–753, 2018. [Google Scholar]
- [20].Debesh Jha PHS, Riegler Michael A., Johansen Dag, de Lange, Pal Halvorsen Thomas, Johansen Havard D., “ResUNet++: An Advanced Architecture for Medical Image Segmentation,” IEEE International Symposium on Multimedia (ISM), pp. 225–2255, 2019. [Google Scholar]
- [21].Jie Hu LS, Albanie Samuel, Sun Gang, Wu Enhua, “Squeeze-and-Excitation Networks,” IEEE/CVF Conference on Computer Vision and Pattern Recognition, pp. 7132–7141, 2018. [Google Scholar]
- [22].“DRIVE: Digital Retinal Images for Vessel Extraction.” https://drive.grand-challenge.org/ (accessed.
- [23].Debesh Jha PHS, Riegler Michael A., Halvorsen Pål, Johansen Dag, de Lange Thomas, and Johansen Håvard D., “Kvasir-SEG: A Segmented Polyp Dataset,” In Proceedings of the ternational conference on Multimedia Modeling, 2020. [Google Scholar]
- [24].Fatima RPB Haggar A, “Colorectal Cancer Epidemiology: Incidence, Mortality, Survival, and Risk Factors,” Clinics in colon and rectal surgery, vol. 22, 2009. [DOI] [PMC free article] [PubMed] [Google Scholar]
- [25].Owen CG et al. , “Retinal arteriolar tortuosity and cardiovascular risk factors in a multi-ethnic population study of 10-year-old children; The child heart and health study in England (CHASE),” Arteriosclerosis, Thrombosis, and Vascular Biology, Article vol. 31, no. 8, pp. 1933–1938, 2011, doi: 10.1161/ATVBAHA.111.225219. [DOI] [PMC free article] [PubMed] [Google Scholar]
- [26].Codella N GD, Celebi ME, Helba B, Marchetti MA, Dusza S, Kalloo A, Liopyris K, Mishra N, Kittler H, Halpern A, “Skin Lesion Analysis Toward Melanoma Detection: A Challenge at the 2017 International Symposium on Biomedical Imaging (ISBI), Hosted by the International Skin Imaging Collaboration (ISIC),” arXiv: 1710.05006 [cs.CV], 2017. [Google Scholar]
- [27].Narinder Punn SA, “Inception U-Net Architecture for Semantic Segmentation to Identify Nuclei in Microscopy Cell Images,” ACM Transactions on Multimedia Computing, Communications, and Applications, pp. 1–15, 2020. [Google Scholar]
- [28].Guosheng Lin AM, Shen Chunhua, Reid Ian, “RefineNet: Multi-path Refinement Networks for High-Resolution Semantic Segmentation,” IEEE Conference on Computer Vision and Pattern Recognition (CVPR), vol. 1, pp. 5168–5177, 2017. [Google Scholar]
- [29].Badrinarayanan V, Kendall A, and Cipolla R, “SegNet: A Deep Convolutional Encoder-Decoder Architecture for Image Segmentation,” IEEE Transactions on Pattern Analysis and Machine Intelligence, vol. 39, no. 12, pp. 2481–2495, 2017, doi: 10.1109/TPAMI.2016.2644615. [DOI] [PubMed] [Google Scholar]
- [30].Chaurasia A and Culurciello E, “LinkNet: Exploiting encoder representations for efficient semantic segmentation,” 2017 IEEE Visual Communications and Image Processing (VCIP), pp. 1–4, 2017. [Google Scholar]


