Abstract
Skin disease cases are rising in prevalence, and the diagnosis of skin diseases is always a challenging task in the clinic. Utilizing deep learning to diagnose skin diseases could help to meet these challenges. In this study, a novel neural network is proposed for the classification of skin diseases. Since the datasets for the research consist of skin disease images and clinical metadata, we propose a novel multimodal Transformer, which consists of two encoders for both images and metadata and one decoder to fuse the multimodal information. In the proposed network, a suitable Vision Transformer (ViT) model is utilized as the backbone to extract image deep features. As for metadata, they are regarded as labels and a new Soft Label Encoder (SLE) is designed to embed them. Furthermore, in the decoder part, a novel Mutual Attention (MA) block is proposed to better fuse image features and metadata features. To evaluate the model’s effectiveness, extensive experiments have been conducted on the private skin disease dataset and the benchmark dataset ISIC 2018. Compared with state-of-the-art methods, the proposed model shows better performance and represents an advancement in skin disease diagnosis.
Keywords: Skin disease, Deep learning, Transformer, Multimodal fusion, Attention
Introduction
In recent years, with an increasingly aging population, the number of skin disease cases has been growing significantly. This status quo brings a great challenge to medical institutions since the diagnosis of skin diseases is almost fully dependent on expert dermatologists. Utilizing deep learning could help to alleviate the burden on medical institutions.
In the earliest studies, researchers usually used traditional methods to extract image color features for classification. After the emergence of Convolutional Neural Networks (CNNs), such as ResNet [1], and DenseNet [2], due to their efficient performance in feature extraction, they soon became the most used methods in image classification. Those networks have been introduced in the medical field and have performed well in diagnosis[3–6]. Moreover, in the last years, many new ViT-based networks [7–11] have been proposed since the proposal of the Vision Transformer [12]. Due to their superior performance in various vision tasks, ViTs have received a lot of attention. Many recent ViT-based models [7, 9, 10], such as Swin Transformer [9], and NesT [10], have achieved better results in image classification than traditional state-of-the-art CNNs [1, 2, 13, 14]. In this study, the Transformer framework [15] is introduced for skin disease diagnosis.
The datasets used for the experiments were multimodal datasets that contain skin disease images and clinical metadata. During the screening phase, patients will not only have associated images of skin diseases but will also provide some clinical metadata (age, sex, etc.). The metadata could provide key information for diagnosis and help improve diagnostic accuracy. This means that a dataset containing both images and clinical metadata has more clinical significance. Due to the multimodal nature of the data, how to effectively fuse image information and metadata information becomes a key feature. Inspired by the fusion mechanism in the Transformer [15] framework, the model design includes two encoders to extract the image and metadata features, and one decoder for feature fusion.
In this work, a new multimodal Transformer is proposed for skin disease classification. The network mainly contains two encoders for both images and metadata, and one decoder to fuse the multimodal information. A pre-trained ViT model is utilized as the backbone in the image encoder to obtain image deep features. Additionally, a Soft Label Encoder is designed to embed the metadata more effectively. After the features from different modalities have been extracted, the most important task is to fuse them effectively. A novel Mutual Attention block is proposed to improve the decoder part of the network. Extensive experiments have been conducted to evaluate the proposed model. The main contributions are summarized as follows:
Aiming at the classification of skin diseases containing images and metadata, a novel multimodal Transformer is proposed. The model combines two encoders to extract image features and metadata features, respectively, and a decoder to fuse multimodal features.
In the encoder part, ViT models are introduced as the backbone to extract image features, a Soft Label Encoder is designed to embed metadata. In the decoder part, the Mutual Attention block is proposed to better fuse multimodal features.
Extensive experiments have been performed on the private datasets and the benchmark dataset ISIC 2018. Compared with the state-of-the-art methods, the experimental results demonstrate the effectiveness of the proposed model.
Related work
CNN-based methods for skin disease diagnosis
Early methods for medical image classification were mainly based on traditional machine learning methods and deep CNN methods. Phung et al. [16] used to extract image traditional features to complete skin classification. With the development of deep CNN, various neural networks [1, 13, 14] have been proposed and have a better performance than traditional methods in image feature extraction. Due to their effective performance, CNN-based methods soon became the mainstream methods in image classification, and some methods were introduced into the medical field. For instance, ResNet and DenseNet are widely used in medical image classification [5, 17]. It is worth mentioning that some methods that combine traditional methods with deep learning methods also have an efficient performance in skin disease diagnosis [18–21].
Vision transformer
Transformer was first proposed in the field of Natural Language Processing (NLP) [15]. Motivated by its success in NLP, Dosovitskiy et al. [12] applied it to Computer Vision. According to the method of the Transformer, ViT [12] first split an input image into patches as tokens, and utilized the encoder in the Transformer to obtain the correlation of tokens. After the ViT [12] was proposed, many models were designed based on it. For instance, Swin Transformer [9] mainly improves the way images are split and uses a hierarchical structure to improve the ViT [12]. Based on the Swin Transformer, NesT [10] combines a hierarchical structure with a block aggregation function to reach faster convergence and a lighter network, which are more suitable for small datasets. In this study, ViT models are introduced as the backbone to design the overall framework, and the results of experiments show that ViTs can also achieve effective performance in medicine.
Unlike CNNs, ViTs are usually more data-hungry and are often trained on public datasets with millions of labeled data. So when used for other datasets, pre-trained ViT models would be a better choice. It is also worth mentioning that different sized ViTs adapt to different sized datasets. Additionally, although there have been many improvements in the Transformer encoder part, there have been few improvements in the Transformer decoder part. Many multimodal fusion methods [11, 22] still utilize Cross Attention in the Transformer decoder to fuse multimodal features. In this study, a new Mutual Attention block is designed to improve the decoder part.
Multimodal fusion
Recently, an increasing number of tasks involve multimodal input. In skin disease classification, many previous studies [23–25] used only images. This is mainly because most datasets do not contain metadata, and the metadata does not seem to be related to skin diseases. However, some studies [26, 27] demonstrated the effectiveness of metadata, and then more researchers [28] began to introduce metadata into their models, achieving great results. Inspired by those studies and the multimodal information in the datasets, we consider the task as a multimodal task.
Early researches [29–32] mainly utilized the One-hot Encoder to embed the metadata, which encodes metadata as hard labels. In this study, a Soft Label Encoder is designed to embed the metadata into soft labels.
The multimodal task is to fuse information from different modalities into a stable multimodal representation for downstream tasks. And the most important part of multimodal tasks is multimodal features fusion. Early work mainly focused on simple operation-based and simple attention-based multimodal fusion. For instance, Kim et al. [33] were the first to use the tensor outer product to calculate the correlation between two modalities. In the Bilinear Attention Network (BAN) [34], bilinear pooling and co-attention are used to fuse metadata information and image information. Xiong et al. [35] used attention-based Gate Recurrent Units to update episodic memory and retrieve the required information. Since the Transformer [15] has been proposed, more studies have used Cross Attention in the Transformer decoder to fuse multimodal information. For example, Chen et al. [11] used Cross Attention to fuse multi-scale image features. Bose et al. [36] used self-attention and Cross Attention to fuse RGB and LiDAR image features. Motivated by those studies, we designed a Mutual Attention block to fuse multimodal features.
Methods
This section mainly describes the methods used and proposed in this study. An architecture overview of the model is first presented. Then, the network will be explained in detail as ViT for image features, Soft Label Encoder for metadata, and Mutual Attention block.
Architecture overview
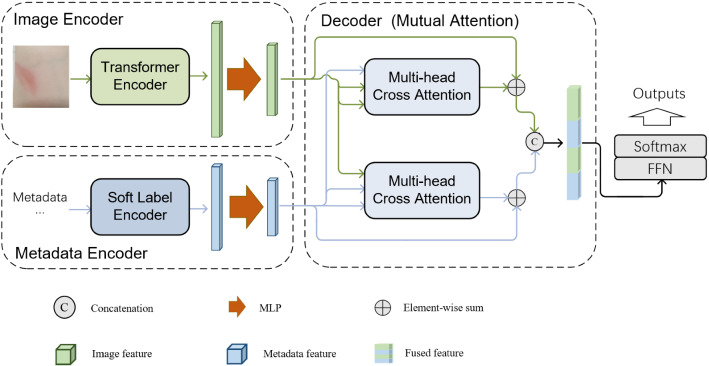
Figure 1 presents the overall architecture of the model. As shown, the network is composed of two encoders and one decoder. Two encoders extract image features and metadata features, respectively, and the decoder is to fuse multimodal features.
Fig. 1.
The overall architecture of the model
A suitable ViT model is utilized as the Transformer Encoder to extract image deep features in Image Encoder. The selection of the Transformer Encoder is according to the size of the dataset and the model’s performance on a certain dataset. As Table 2 shows, several ViTs(original ViT, Swin Transformer, NesT) are compared with some popular CNNs(ResNet101, Densenet121) on the private dataset and NesT shows the best performance. Then, NesT is utilized as the backbone on the private dataset and ViT-L is utilized as the backbone on the benchmark dataset ISIC 2018. A subsequent Multilayer Perceptron (MLP) is used to further extract image features.
Table 2.
Comparison of the performance of networks on the private dataset
| Methods | Acc | Sen | Spe | F1 | AUC |
|---|---|---|---|---|---|
| DenseNet121 | 0.667 | 0.722 | 0.943 | 0.664 | 0.889 |
| ResNet101 | 0.662 | 0.726 | 0.950 | 0.673 | 0.889 |
| ViT-B | 0.594 | 0.623 | 0.935 | 0.587 | 0.850 |
| Swin-B | 0.693 | 0.736 | 0.966 | 0.695 | 0.918 |
| NesT-B | 0.750 | 0.746 | 0.968 | 0.716 | 0.944 |
The bold values represent the best results in the metrics. This can make more readable and make it easier to compare the results of different methods. This also highlights the effectiveness of the proposed method
In the metadata encoder, a Soft Label Encoder(SLE) is designed to embed metadata into soft labels. SLE is a data processing method to embed metadata into vectors and it will not be trained. A subsequent MLP is used to extract metadata features.
After the image and metadata features are obtained, they are fused in the decoder. The main part of the decoder is the proposed Mutual Attention block, which will be introduced in detail in Sect. 3.4.
At the end of the network, fused representation is mapped to the output through FFN and SoftMax.
ViT for image deep features
Due to the ViTs’ significant performance in image classification, ViT models are introduced for the task. Considering that the dataset contains limited data, and that ViT models are data-hungry, pre-trained models would have better performance. Thus, pre-trained ViT models are utilized as the backbone for transfer learning in the network. These models had been pre-trained on large-scale datasets before fine-tuning. The models used in the experiments, both NesT and ViT-L, are pre-trained in the ILSVRC-2012 ImageNet dataset with 1 k classes and 1.3 M images.
A better backbone is utilized according to the size of the dataset and the model’s performance on a certain dataset. Several ViTs and CNNs are compared on each dataset, and a better one is utilized as the backbone. The backbone network can be replaced by other suitable models. Table 2 presents a comparison of different ViTs and CNNs on the private dataset. As is evident, NesT [10] has the best results and is utilized as the backbone of the private dataset. On the benchmark dataset ISIC 2018, several ViTs(original ViT, Swin Transformer, NesT) are compared with some popular CNNs(ResNet101, Densenet121, VGG19). Original ViT-L [12] shows the best performance and is utilized as the backbone on ISIC 2018.
Soft label encoder for metadata
In addition to images, there are corresponding metadata in the datasets. Unlike the large number of words in the Visual Question Answering (VQA) tasks, the metadata in the used datasets only contain a small amount of textual descriptions of the patient’s clinical information.
The metadata of the private dataset contains 13 common causes of skin diseases(unknown, thermal injury, infectious disease, burn, diabetes, diabetes bug bite, trauma, vascular wound disease, mechanical injury, scarring, iatrogenic injury, tumor, pressure ulcer). And the metadata in the dataset ISIC 2018 contains a more extensive range of information, which consists of 4 attributes: gender, diagnosis type, age, and body location. In total, there are 39 types of textual descriptions in the public dataset ISIC 2018.
Due to the fewer types of textual descriptions in the metadata, they could be regarded as descriptive labels. Therefore, we consider encoding metadata as encoding labels. Each type of textual description can be regarded as a kind of label. And each descriptive label corresponds to an element in the encoded vectors. As the examples in Fig. 3, “Age: 5,” “Age: 15,” and “Location: face” are all textual descriptions in the metadata. “Age: 5” corresponds to the second element, and “Age: 15” corresponds to the fourth element in the encoded vectors. Hence, for each image in the private dataset, corresponding metadata can be encoded into a 13-dimensional vector. And for each image in ISIC 2018, corresponding metadata can be encoded into a 39-dimensional vector.
Fig. 3.
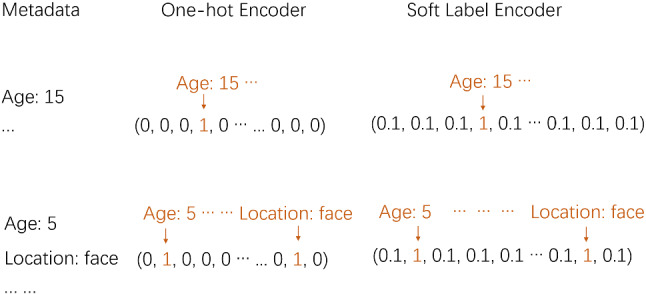
Comparison of Soft Label Encoder with One-hot Encoder
One-hot encoded vectors are also called hard labels, which are usually used to calculate loss with the output of the network. Some works[29–32] utilize One-hot Encoder to embed metadata and achieve great results. The principle of One-hot Encoder is that the element is encoded as 1 if the corresponding textual description exists, otherwise, it is encoded as 0.
One-hot encoded vectors contain extensive zero elements, which makes no attribution to the feature extraction. As Fig. 2 shows, the forward propagation of One-hot encoded vectors in the first layer of MLP is as follows:
| 1 |
Fig. 2.
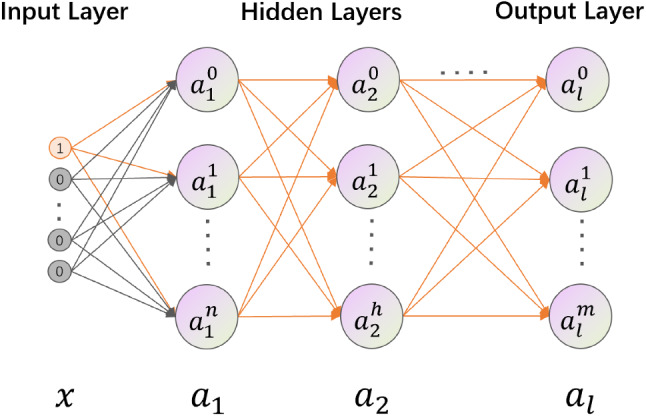
Forward propagation of One-hot encoded vectors in MLP
x refers to the input vector. and are hidden layers. represents the output of the MLP. , , , and are all network parameters in the MLP.
As shown in Fig. 2, when x takes the value of [1,0..,0], is . Then, ,.., make no impact and only contains the information of . The output of the MLP() also only contains the information of . Then, the MLP plays the role of re-encoding the metadata.
To make the network learn more information and the output of the MLP could be more expressive, the Soft Label Encoder(SLE) is designed. Figure 3 shows how it works and gives a comparison with One-hot Encoder. In SLE, metadata are encoded as soft labels instead of hard labels. In greater detail, the elements that are encoded as 0 in the One-hot Encoder will be encoded as 0.1 in SLE. The value of 0.1 is close to 0 and much smaller than 1, so the SLE encoded vectors could keep the distinguishability of One-hot encoded vectors. Additionally, in the forward propagation of the MLP, 0.1 also makes attributions, which enable the network to learn correlations among textual descriptions and the output of the MLP contains more information. By this operation, the metadata features are more expressive and the vectors are more suitable to be sent to the network.
Mutual attention block
There are many ways to fuse multimodal features, and the most frequently used methods are simple operation-based fusion and attention-based fusion. Simple operation-based fusion is mainly based on element-wise addition or concatenation.
Some more complex fusions are attention-based or cross-attention-based. In the Attention block, the input representation is transformed to three vectors(i.e., query(q), key(k), value(v)). q is multiplied by k to generate an attention map between vectors. And v, which represents the value of the input representation, is multiplied by the attention map to get the result of the Attention block. Considering q and k do not have to be transformed from the same representation, Cross Attention multiplies q and k from different modalities to fuse multimodal features. Furthermore, in the Multi-head Cross Attention block, the input representations are transformed to multiple sets of (q, k, v) to learn more attention information. Head(h) refers to the number of sets.
Inspired by those fusion methods, we proposed the Mutual Attention block.
The architecture of the proposed Mutual Attention block is presented in Fig. 4. represents the dimension of the image representation. refers to the dimension of the metadata representation. means the number of heads.
Fig. 4.
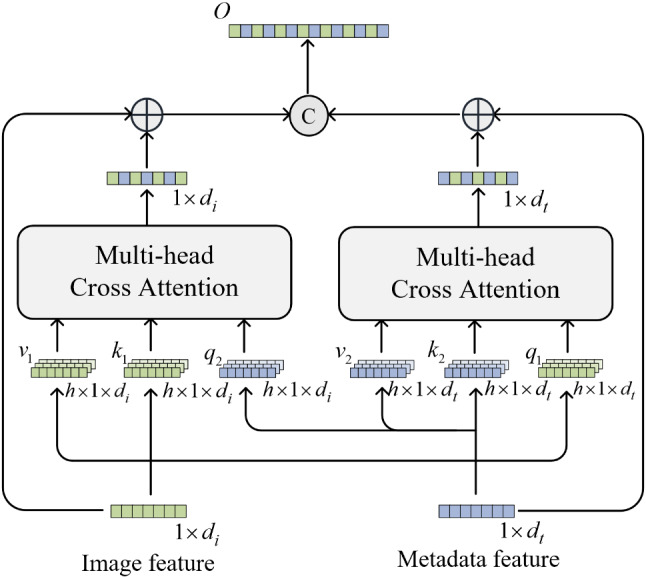
Mutual Attention block
As shown, the MA utilizes two Multi-head Cross Attention to interactively fuse information from images and metadata. This symmetrical structure in MA could not only enhance the interaction of multimodal features but also retain the key information of their own modalities. Differently from the Cross Attention used by the Transformer, the features for residual connection are used to calculate and instead of in MA. This aims to incorporate more interactive information while retaining the original modal information. Additionally, to prevent the degradation of the model, a residual connection is added after each Multi-head Cross Attention block. At the end of the MA block, two fused representations are concatenated into a stable representation as the output of the MA block.
The , and can be formulated as follows:
| 2 |
where represents the image presentation; represents the metadata presentation. , , , , , are linear transformation matrices. is the dimension of the image representation. means the dimension of the metadata representation. refers to the nth head in the Attention module. It is worth noting that and have different dimensions while and ( and ) should keep the same dimension. And the solution is to align their dimensions with the transform matrix .
After , and are calculated, they are fused in the Multi-head Cross Attention. Figure 5 shows the architecture of Multi-head Cross Attention. ⊗ operation means element-wise multiply. Softmax operation is on every Attention map. Concatenation operation is to concatenate h d-dimensional vectors to a h × d-dimensional vector. Linear operation is to transform a h × d-dimensional vector to a d-dimensional vector. The function of Multi-head Cross Attention can be described as follows:
| 3 |
| 4 |
where d represents the dimension of . refers to the number of heads. consists of . consists of . consists of . is linear transformation matrice. presents the function of Multi-head Cross Attention.
Fig. 5.
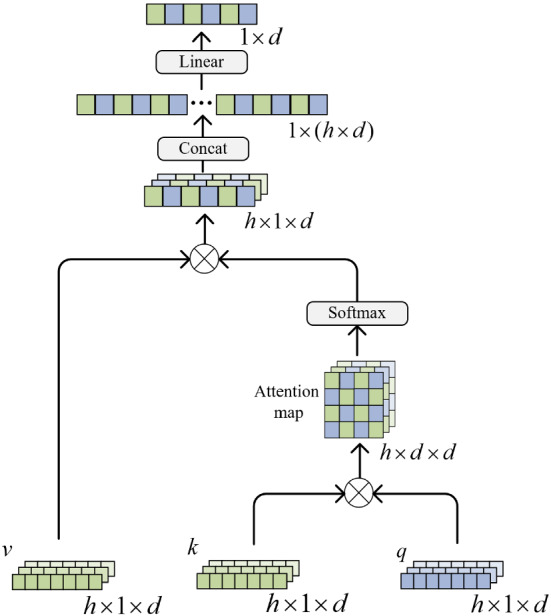
Multi-head Cross Attention
At the end of MA, two residual presentations are concatenated as the output. It can be described as follows:
| 5 |
where represents the output of the MA block.
Materials and experiments
In this section, extensive experiments are conducted on the private dataset and ISIC 2018. On the private dataset, the network is compared with other popular methods and the results show the effectiveness and advancement of the proposed model. We first introduce the dataset in Sect. 4.1 and then the implementation details in Sect. 4.2. After that, the experimental results on the private dataset and a comparison with the state-of-the-art methods will be presented in Sect. 4.3. Moreover, the model is applied to the public dataset ISIC 2018 and the results are compared with some recent studies in Sect. 4.4. Finally, in Sect. 4.5, to verify the effectiveness of the proposed MA and SLE, ablation experiments are conducted on the ISIC 2018.
Datasets
The private dataset was collected by the doctors we cooperate with. Mobile phones are used to take skin wound disease images in the clinic. Considering that the cause of the disease can also make an attribution to the disease diagnosis, the doctors summarize some common causes of skin wound diseases for patients to choose from (unknown, thermal injury, infectious disease, burn, diabetes, diabetes bug bite, trauma, vascular wound disease, mechanical injury, scarring, iatrogenic injury, tumor, pressure ulcer). After the images and clinical metadata are collected, the dataset is given to skin wound specialist doctors for diagnosis. A total of 760 disease images are collected and they are finally classified into 9 categories(skin necrosis, skin defect, skin and soft tissue infection, gangrene, sinus tract, first-degree burn, second-degree burn, third-degree burns, Scar healing), each containing 97, 165, 32, 66, 13, 86, 116, 90, 95 images. In the experiments, the dataset is randomly split into 610 images for training and 150 images for the test.
To further verify the practicability and effectiveness of the model, it is evaluated on the benchmark dataset ISIC 2018 [37, 38], which includes 10,015 dermatoscopic images in 7 diagnostic classes. Each image is also with corresponding metadata, and there are a total of 39 types of textual descriptions in the metadata. The dataset is randomly split into 8012 images for training and 2003 images for the test.
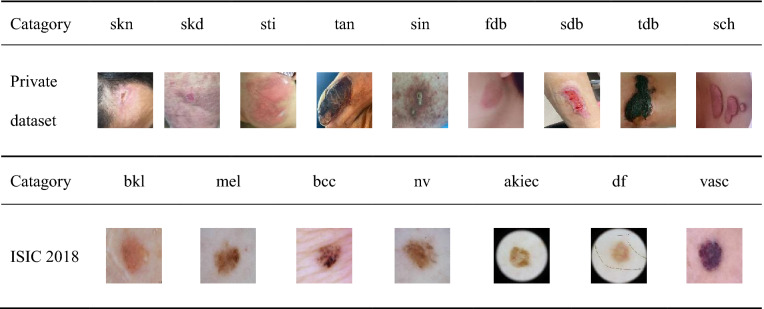
Table 1 presents some examples in both datasets. The images in the private dataset are in nine diagnostic classes: skin necrosis(skn), skin defect(skd), skin and soft tissue infection(sti), gangrene(gan), sinus(sin), first-degree burn(fdb), second-degree burn(sdb), third-degree burn(tdb), and scar healing(sch). The images in ISIC 2018 are among seven categories: benign keratosis (bkl), melanoma (mel), basal cell carcinoma (bcc), melanocytic (nv), actinic keratosis (akiec), dermatofibroma (df), and vascular lesion (vasc).
Table 1.
Skin disease images
Implementation details
The ratio of the training set to the test set is about 4:1. The private dataset is randomly split into 610 images for training and 150 images for the test. And the public dataset contains 8012 images for training and 2003 images for the test.
All the MLP and FFN in the network are composed of 3 fully connected layers. Each full-connection layer is connected to the ReLU6 activation function. MLP is mainly used to extract the feature or carry out representation mapping.
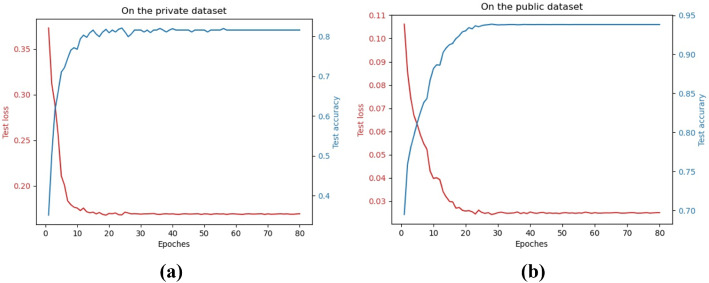
All experiments are conducted on a single GPU (Titan) with a batchsize of 8. From the convergence graphs in Fig. 6, it can be seen that the loss converges and the accuracy does not improve after 50 epochs of training. Thus, the training epoch is set to 50. Some other setups include the weighted cross-entropy loss and the learning scheduler. The weighted cross-entropy loss assigns a weight to each category to handle the category imbalance. The initial learning rate is 0.001 and is multiplied by 0.1 every 7 epochs. The optimizer used is SGD instead of AdamW, which brings a faster convergence to the loss.
Fig. 6.
The convergence graphs on the private dataset (a) and public dataset (b)
In terms of data augmentation, each image from the original dataset will be preprocessed before being sent to the network. During the training, images are randomly cropped to 224 × 224 after the shorter sides of images are resized to 256. In this way, the network is trained on a different part of the image each time, which aims to enhance the robustness of the model. Then, random rotation and flip operations are also performed to augment the image. During the test, the images are resized to 224 × 224 and sent to the network.
Experiments on the private dataset
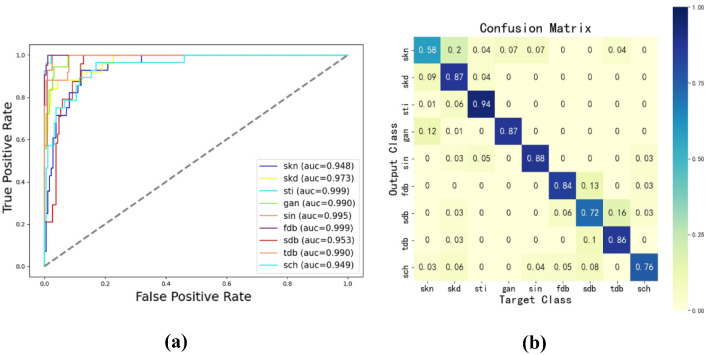
This subsection mainly compares the proposed model with some popular methods using the private dataset. Skin disease classification is a multi-classification task in medicine, and the main evaluation metrics include accuracy(Acc), AUC, sensitivity(Sen), specificity(Spe), and F1. Accordingly, some metrics are used to evaluate the model. Table 2 compares different models on the private dataset with only images as input. Table 3 presents the effects of different metadata encoders. Table 4 is a comparison of the Mutual Attention with some other fusion methods. Additionally, the ROC curve and confusion matrix are presented in Fig. 7.
Table 3.
Comparison of different metadata encoders (private dataset)
| Methods | Acc1 | Acc2 | Spe | Sen | F1 | AUC |
|---|---|---|---|---|---|---|
| Word2vec | 0.313 | 0.750 | 0.967 | 0.746 | 0.718 | 0.944 |
| One-hot Encoder | 0.401 | 0.763 | 0.962 | 0.783 | 0.745 | 0.947 |
| Soft Label Encoder | 0.473 | 0.777 | 0.973 | 0.804 | 0.788 | 0.964 |
The bold values represent the best results in the metrics. This can make more readable and make it easier to compare the results of different methods. This also highlights the effectiveness of the proposed method
Table 4.
Comparison of different fusion methods (private dataset)
| Methods | Acc | Spe | Sen | F1 | AUC |
|---|---|---|---|---|---|
| No metadata | 0.750 | 0.946 | 0.746 | 0.716 | 0.944 |
| Element-wise concat | 0.777 | 0.9732 | 0.804 | 0.788 | 0.964 |
| Element-wise multiply | 0.762 | 0.9718 | 0.801 | 0.756 | 0.971 |
| MFB [39] | 0.756 | 0.9705 | 0.794 | 0.747 | 0.954 |
| BAN [34] | 0.746 | 0.9709 | 0.795 | 0.750 | 0.967 |
| CrossViT [11] | 0.750 | 0.9677 | 0.783 | 0.746 | 0.954 |
| MetaBlock [32] | 0.786 | 0.9728 | 0.823 | 0.807 | 0.968 |
| Mutual attention | 0.816 | 0.9745 | 0.854 | 0.820 | 0.974 |
The bold values represent the best results in the metrics. This can make more readable and make it easier to compare the results of different methods. This also highlights the effectiveness of the proposed method
Fig. 7.
The results of the proposed model on the private dataset: (a) ROC curve, (b) Confusion matrix
Backbone The performance of some ViTs and CNNs on the private dataset is presented in Table 2. According to the size of the private dataset, corresponding sized models are utilized. And all the models are pre-trained. Compared with other CNNs, DenseNet121 and ResNet101 have relatively better performances on the private dataset. With only images as inputs, they can achieve an accuracy of about 66%. The original ViT does not show better results than traditional CNNs on the private dataset. Swin Transformer shows a slight improvement, and NesT has great performance and even achieved an accuracy of 0.75 on the private dataset. According to the description of Zhang et al. [10], NesT is more adaptable to small datasets and has better performance on them. Thus, NesT is utilized as the backbone in the network on the private dataset.
Soft Label Encoder Two other encoding methods are compared with the Soft Label Encoder in Table 3. One is the One-hot Encoder, which is more similar to SLE. A comparison between them is presented in Sect. 3.2. Another is Word2Vec, which is more often used for large corpora. One-hot Encoder and SLE encode the metadata as labels, while word2vect encodes the metadata as words. Acc1 in Table 3 represents the accuracy with only metadata as input for classification. Acc2 and the other metrics are the results with the common input of images and metadata. In the network, the fusion method used is concatenation, and the backbone used is Nest-B.
Comparing the Acc1 of the Word2Vec method with that of One-hot Encoder and SLE methods, it can be seen that the metadata are more suitable to be encoded as labels. Additionally, the Acc1 of the One-hot Encoder method is lower than that of the SLE method, which indicates that the soft label vectors are more suitable for the model. Furthermore, comparing the Acc2 of the three methods and some other metrics, it is found that the soft label encoded vectors could bring the greatest improvement to the whole network.
Mutual Attention block As shown in Table 4, the Mutual Attention block is compared with six other popular fusion methods. In the network, metadata are encoded to soft labels and the backbone used is NesT-B. For comparison, the metrics of the model with only images as input are also presented. Compared with the results of the model without metadata information, the accuracy of some methods has decreased. This means that some valuable features are lost during the fusion. Element-wise concatenation and element-wise multiplication are simple operation-based. The results show that simple operation-based fusion methods can bring a slight improvement to the original model. Multi-modal Factorized Bilinear pooling (MFB) [39] and Bilinear Attention Networks (BAN) [34] mainly use bilinear pooling and bilinear attention to fuse multimodal features. These methods have been often used in VQA tasks. But the results indicate that they are not suitable for the task. CrossViT [11] mainly uses Cross Attention to fuse multimodal features. MetaBlock is an Attention-Based mechanism to combine images and metadata [32]. Comparing all the methods, Mutual Attention achieves the best accuracy, sensitivity, specificity, F1 score, and AUC, which demonstrates that the proposed MA could enable the model to better fuse image features and metadata features.
Results Compared with other methods, the previous results have demonstrated the effectiveness of the proposed network. Some other detailed results are presented in Fig. 7. From the ROC curve in Fig. 7a, it can be seen that the AUC value of each category has reached about 0.95 or higher. What’s more, some categories’ AUC value is around 0.99. The confusion matrix in Fig. 7b shows that the model can give high diagnostic accuracy on some categories(e.g., 0.94 in the skin and soft tissue infection(ski)). While some other categories have relatively lower accuracy. From the analysis and observation of the private dataset, it is found that the images have high similarities, which might be the reason for the low accuracy. For example, some images of skin necrosis have a high similarity to some images of skin defect, and many images of scar healing are similar to the images of the second-degree burn. In fact, those categories with similar images are also the most difficult for experts to diagnose. In general, thenetworkhasaneffectiveperformance inthe private dataset.
Experiments on ISIC 2018 dataset
To prove the practicality and generalizability of the proposed network, the model is evaluated on the benchmark dataset ISIC 2018. The dataset is randomly split into 8012 images for training and 2003 images for the test. In addition, to evaluate the effectiveness and advancement of the model, the network is compared with some other state-of-the-art methods on ISIC 2018.
Table 5 presents a comparison of the network with six other state-of-the-art methods on the ISIC 2018. The results for other networks are from the respective publications. Our method has achieved 0.9381 for accuracy, thus outperforming previous works by more than 1%. In addition, the proposed model achieved the best sensitivity, specificity, F1 score, and AUC (0.9014, 0.9836, 0.9013, 0.9932, respectively). The comparison to the state-of-the-art methods on ISIC 2018 reflects the model’s effective performance and advancement.
Table 5.
Comparison on ISIC 2018
| Methods | Acc | Sen | Spe | F1 | AUC |
|---|---|---|---|---|---|
| Multi-model [40] | 0.8980 | 0.8971 | / | 0.8992 | 0.978 |
| MobileNet [4] | 0.9270 | 0.7242 | 0.9714 | 0.7277 | 0.96 |
| DenseNet [41] | 0.8580 | 0.6904 | 0.9592 | / | 0.88 |
| Semi-supervised [42] | 0.9254 | 0.7147 | 0.9272 | 60.68 | 0.9358 |
| Transfer-learning [43] | 0.914 | 0.8374 | / | / | 0.974 |
| MAT [28] | 0.9255 | / | / | / | 0.98 |
| Ours | 0.9381 | 0.9014 | 0.9836 | 0.9013 | 0.9932 |
The bold values represent the best results in the metrics. This can make more readable and make it easier to compare the results of different methods. This also highlights the effectiveness of the proposed method
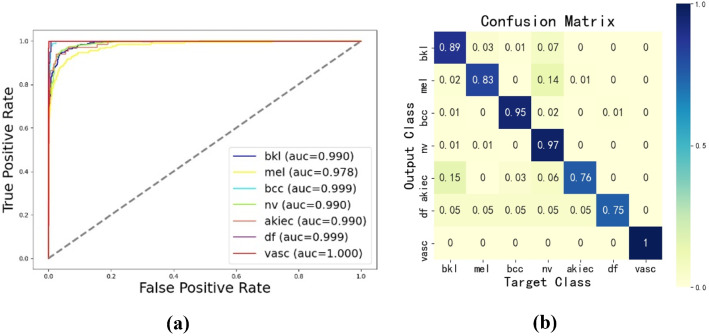
The ROC curve and confusion matrix are presented in Fig. 8. From the ROC curve in Fig. 8a, it can be seen that the proposed network achieves a high AUC value and almost every category’s AUC value reaches 0.99. Additionally, the confusion matrix shows that the model can give high accuracy in the diagnosis of some diseases (e.g., basal cell carcinoma(bcc), melanocytic(nv), and vascular lesion (vasc)). And the model has reached a balanced accuracy of 0.88, which is a respectable result on the unbalanced dataset. These results in Fig. 8 reflect our method’s efficient performance in the benchmark dataset ISIC 2018.
Fig. 8.
The results of the proposed model on ISIC 2018: (a) ROC curve, (b) Confusion matrix
Ablation experiments
The experiments performed on the private dataset have compared SLE and MA with some other methods. To further verify the effectiveness of the proposed SLE and MA, ablation experiments were conducted on ISIC 2018. The results are shown in Table 6. The experiments in rows 1–4 correspond to experiments 1–4. When SLE is not used, it is replaced with the One-hot Encoder. When MA is not used, it is replaced with a concatenation operation.
Table 6.
Ablation experiments (ISIC 2018)
| SLE | MA | Acc | Sen | Spe | AUC |
|---|---|---|---|---|---|
| 0.9206 | 0.8825 | 0.9795 | 0.9896 | ||
| ✓ | 0.9281 | 0.8967 | 0.9812 | 0.9920 | |
| ✓ | 0.9286 | 0.8893 | 0.9824 | 0.9918 | |
| ✓ | ✓ | 0.9381 | 0.9014 | 0.9836 | 0.9932 |
From the comparison of experiments 2 and 3 with experiment 1, it is demonstrated that both SLE and MA bring improvements to the network. From experiment 4, it can be seen that when SLE and MA are both used, the effect is better than that of either used alone. The results in Table 6 reflect the effectiveness of the proposed SLE and MA.
Discussion
The results presented in the previous sections have shown the proposed model’s effectiveness and advancement in skin disease classification. In this section, we mainly discuss the improvement of the proposed model and analyze the reasons for its significant performance.
In the diagnosis of skin diseases, the accuracy of diagnosis will be improved when patients provide clinical information. Then, the images and metadata can be used together to diagnose skin disease. And the network is designed based on the datasets that consist of images and clinical metadata. Compared with the model with only images as inputs, the model improves the accuracy from 0.75 to 0.816. To further verify the effectiveness and generalizability of the proposed model, it is evaluated on the benchmark dataset ISIC 2018.
Inspired by the Transformer framework, the model is designed with two encoders to extract image features and metadata features, respectively, and a decoder to fuse them. For image feature extraction, due to the relatively small size of skin datasets compared with ImageNet, pre-trained ViT models are introduced for transfer learning. A comparison of ViTs and CNNs on the private dataset is presented in Table 2, and the results show the better performance of ViT. Then, ViT models were utilized as the backbone in the task for better results. The images in the private dataset are not uniform and contain some background noise. NesT can better adapt to those images. However, ISIC 2018 contains much more data and the images are clear and uniform. Then, ViT-L shows better performance in ISIC 2018.
The other main contributions of this paper are the improvements in the metadata encoder and the fusion mechanism. As for metadata, they have usually been treated as words in previous research. Considering the small number of textual descriptions in the metadata, a simple encoder would be better for them. The Word2Vec encoded vectors would contain more semantic information and have higher similarity since the metadata contain similar descriptive information. In contrast, the One-hot encoded vectors and soft label encoded vectors would have lower similarities. Additionally, the One-hot encoded vectors contain many 0 elements, which makes no attribution to feature extraction in the forward propagation. To enable the model to learn more information and make the metadata feature more expressive, a Soft Label Encoder(SLE) is designed to embed metadata into soft labels. The results in Table 3 demonstrate that SLE has better performance in encoding metadata than Word2Vec and One-hot Encoder. The comparison illustrates the practicability of SLE.
In the decoder, the designed Mutual Attention block mainly consists of two Multi-head Cross Attention blocks and a concatenation operation. To better balance the information from different modalities, an asymmetrical structure design is adopted. And a residual link is added after each Cross Attention block to prevent the degradation of the network. Usually, the output of one Cross Attention block contains more information about the features for residual connection. Thus, the representation for residual connection is used to calculate and instead of to retain more self-information. On each branch, Cross Attention is utilized to introduce interactive information of another modality. At the end of the MA, two residual representations are concatenated to obtain fused features. In Table 4, the comparison of different fusion methods demonstrates the effectiveness of MA. Compared with the network, which utilizes One-hot Encoder for metadata and concatenation for fusion, the proposed model improves the accuracy from 0.763 to 0.816.
In the experiments on the benchmark dataset ISIC 2018, the network is compared with some other state-of-the-art methods on it. And the results illustrate the better performance and advancement of the proposed model. From the ablation studies in Table 6, it can be found that the model does not show better results than previous methods without MA and SLE. After MA and SLE are used, the accuracy is increased from 0.9206 to 0.9381. As the ISIC 2018 contains much more data and the accuracy is more than 0.92, the improvement is not as much as on the private dataset when MA and SLE applied. But compared with the improvements achieved by other studies, the model has improved the accuracy by more than 1% and achieved the best results in some other metrics. This can demonstrate the effectiveness of MA and SLE and the model’s significant performance on skin disease classification.
Conclusion
In this paper, a novel multimodal Transformer is proposed to fuse images and metadata for skin disease classification. In the network, a proper ViT model is utilized as the backbone to extract image deep features. As for clinical metadata, a Soft Label Encoder is designed to embed them into soft labels. Moreover, the designed Mutual Attention block could make the image features and metadata features better fused. Extensive experiments demonstrate that the proposed framework achieves significant performance in skin disease classification. On the private dataset, the proposed model achieved an accuracy of 0.816, which is better than other popular networks. On the dataset ISIC 2018, the proposed method achieves an accuracy of 0.9381 and an AUC of 0.99. Compared with the state-of-the-art methods, the model shows effective performance and advancement in skin disease diagnosis. As for future studies, more work could focus on image feature extraction. The data collection and data cleaning of skin diseases are also worthy of attention.
Acknowledgements
This research is supported in part by Science and Technology Commission of Shanghai Municipality (20DZ2254400, 21DZ2200600), National Scientific Foundation of China (82170110), Zhongshan Hospital Clinical Research Foundation(2019ZSGG15), and Shanghai Pujiang Program (20PJ1402400).
Biographies
Gan Cai
was born in Hubei Province, China, and obtained the B.S. degree in School of Information Science and Engineering from East China University of Science and Technology in 2020. He is currently pursuing the M.S. degree in East China University of Science and Technology. His main research interests include deep learning for medical image processing and computer vision. 
Yu Zhu
Member IEEE received the PhD degree from Nanjing University of Science and Technology, China, in 1999. She is currently a professor in the department of electronics and communication engineering of East China University of Science and Technology. Her research interests include image processing, computer vision, multimedia communication and deep learning, especially, for the medical auxiliary diagnosis by artificial intelligence technology. She has published more than 90 papers in journals and conferences. 
Yue Wu
is currently the lecturer of East China University of Science and Technology. He received the PhD degree from University of Sheffield, UK, in 2016, and B.S. degree from Zhejiang University, China in 2010. He then worked as a research fellow in Alibaba Inc from 2010-2011. He won an IEEE best conference paper award and was a co-investor of three patents. His research interests include wireless communications, optimization, machine learning and complex network. 
Xiaoben Jiang
is pursuing the Ph.D. degree in East China University of Science and Technology. His current research interests include digital image processing and computer vision. His experience includes the denoising method on chest X-ray images and CT images, and detection of COVID-19 cases from denoised CXR images. He has published in journals in the crossing field of medical science and computer vision, and has been involved in publicly and privately funded projects.
Jiongyao Ye
is currently the Associate Professor of East China University of Science and Technology. He received the B.S. degree from Waseda University, JP in 2005, and Ph.D. degree from Waseda University, JP in 2011. He worked as a senior researcher in SONY Inc from 2005–2008, as a research fellow in Waseda University from 2011–2012, as senior researcher in Fujitsu Inc from 2012–2014. He won twice IEEE best conference paper awards and four IC layout patented. His research interests include IC Design, Intelligent Hardware Design, Chip failure analysis and Low Power Design.
Dawei Yang
is dedicated in early diagnosis of lung cancer and relevant studies, with special interests on management of pulmonary nodule and validation of diagnostic biomarker panels based on MIOT, CORE and radiomics artificial intelligence (AI) platform. He is the member of IASLC Prevention, Screening and Early Detection Committee. Since 2011, he has published 16 SCI research articles and 9 as first author, including which on Am J Resp Crit Care (2013), Can Lett (2015, 2020) and Cancer (2015 and 2018), etc. As a presenter for oral or poster presentation in ATS, WCLC, APSR, ISRD couple times, he is one of the peer reviewers for international journals, such as J Cell Mol Med and J Transl Med.
Footnotes
Publisher's Note
Springer Nature remains neutral with regard to jurisdictional claims in published maps and institutional affiliations.
Contributor Information
Yu Zhu, Email: zhuyu@ecust.edu.cn.
Dawei Yang, Email: yang_dw@hotmail.com.
References
- 1.He, K., Zhang, X., Ren, S., Sun, J.: Deep residual learning for image recognition. In: Proceedings of the IEEE Conference on Computer Vision and Pattern Recognition, pp. 770–778 (2016)
- 2.Huang, G., Liu, Z., Van Der Maaten, L., Weinberger, K.Q.: Densely connected convolutional networks. In: Proceedings of the IEEE Conference on Computer Vision and Pattern Recognition, pp. 4700–4708 (2017)
- 3.Xiao, H., Ran, Z., Mabu, S., Li, Y., Li, L.: SAUNet++: an automatic segmentation model of COVID-19 lesion from CT slices. Vis. Comput. pp. 1–14 (2022)
- 4.Mohamed, E.H., El-Behaidy, W.H.: Enhanced skin lesions classification using deep convolutional networks. In: 2019 Ninth International Conference on Intelligent Computing and Information Systems (ICICIS), IEEE, pp. 180–188 (2019)
- 5.Zhang, Y., Wang, C.: SIIM-ISIC melanoma classification with DenseNet. In: 2021 IEEE 2nd international conference on big data, artificial intelligence and internet of things engineering (ICBAIE), IEEE, pp. 14–17 (2021)
- 6.Karthik K, Kamath SS. A deep neural network model for content-based medical image retrieval with multi-view classification. Vis. Comput. 2021;37(7):1837–1850. doi: 10.1007/s00371-020-01941-2. [DOI] [Google Scholar]
- 7.Wang, W., et al.: Pyramid vision transformer: a versatile backbone for dense prediction without convolutions. arXiv preprint arXiv:2102.12122 (2021)
- 8.Yang, J., et al.: Focal self-attention for local-global interactions in vision transformers. arXiv preprint arXiv:2107.00641 (2021)
- 9.Liu, Z., et al.: Swin transformer: Hierarchical vision transformer using shifted windows. arXiv preprint arXiv:2103.14030 (2021)
- 10.Zhang, Z., Zhang, H., Zhao, L., Chen, T., Pfister, T.: Aggregating nested transformers. arXiv preprint arXiv:2105.12723 (2021)
- 11.Chen, C-F., Fan, Q., Panda, R.: Crossvit: cross-attention multi-scale vision transformer for image classification. arXiv preprint arXiv:2103.14899 (2021)
- 12.Dosovitskiy, A., et al.: An image is worth 16x16 words: transformers for image recognition at scale, arXiv preprint arXiv:2010.11929 (2020)
- 13.Simonyan, K., Zisserman, A.: Very deep convolutional networks for large-scale image recognition. arXiv preprint arXiv:1409.1556 (2014)
- 14.Tan, M., Le, Q.: Efficientnet: rethinking model scaling for convolutional neural networks. In: International Conference on Machine Learning, PMLR, pp. 6105–6114 (2019)
- 15.Vaswani, A., et al.: Attention is all you need. In: Advances in neural information processing systems, pp. 5998–6008 (2017)
- 16.Phung SL, Bouzerdoum A, Chai D. Skin segmentation using color pixel classification: analysis and comparison. IEEE Trans. Pattern Anal. Mach. Intell. 2005;27(1):148–154. doi: 10.1109/TPAMI.2005.17. [DOI] [PubMed] [Google Scholar]
- 17.Zhang J, Xie Y, Wu Q, Xia Y. Medical image classification using synergic deep learning. Med. Image Anal. 2019;54:10–19. doi: 10.1016/j.media.2019.02.010. [DOI] [PubMed] [Google Scholar]
- 18.Gao, X., Zhang, Y., Wang, H., Sun, Y., Zhao, F., Zhang, X.: A modified fuzzy clustering algorithm based on dynamic relatedness model for image segmentation. Vis. Comput. pp. 1–14 (2022)
- 19.Serte S, Demirel H. Gabor wavelet-based deep learning for skin lesion classification. Comput. Biol. Med. 2019;113:103423. doi: 10.1016/j.compbiomed.2019.103423. [DOI] [PubMed] [Google Scholar]
- 20.Javed, R., Saba, T., Shafry, M., Rahim, M.: An intelligent saliency segmentation technique and classification of low contrast skin lesion dermoscopic images based on histogram decision. In: 2019 12th International Conference on Developments in eSystems Engineering (DeSE), IEEE, pp. 164–169 (2019)
- 21.Salah KB, Othmani M, Kherallah M. A novel approach for human skin detection using convolutional neural network. Vis. Comput. 2021;38:1–11. [Google Scholar]
- 22.Hao, Y., et al.: An end-to-end model for question answering over knowledge base with cross-attention combining global knowledge. In: Proceedings of the 55th Annual Meeting of the Association for Computational Linguistics (Volume 1: Long Papers), pp. 221–231 (2017)
- 23.Gonzalez-Diaz I. Dermaknet: Incorporating the knowledge of dermatologists to convolutional neural networks for skin lesion diagnosis. IEEE J. Biomed. Health Inform. 2018;23(2):547–559. doi: 10.1109/JBHI.2018.2806962. [DOI] [PubMed] [Google Scholar]
- 24.Song L, Lin J, Wang ZJ, Wang H. An end-to-end multi-task deep learning framework for skin lesion analysis. IEEE J. Biomed. Health Inform. 2020;24(10):2912–2921. doi: 10.1109/JBHI.2020.2973614. [DOI] [PubMed] [Google Scholar]
- 25.Tang P, Liang Q, Yan X, Xiang S, Zhang D. Gp-cnn-dtel: Global-part cnn model with data-transformed ensemble learning for skin lesion classification. IEEE J. Biomed. Health Inform. 2020;24(10):2870–2882. doi: 10.1109/JBHI.2020.2977013. [DOI] [PubMed] [Google Scholar]
- 26.Kawahara J, Daneshvar S, Argenziano G, Hamarneh G. Seven-point checklist and skin lesion classification using multitask multimodal neural nets. IEEE J. Biomed. Health Inform. 2018;23(2):538–546. doi: 10.1109/JBHI.2018.2824327. [DOI] [PubMed] [Google Scholar]
- 27.Pacheco, A.G.C., Krohling, R.: An attention-based mechanism to combine images and metadata in deep learning models applied to skin cancer classification. IEEE J. Biomed. Health Inform. (2021) [DOI] [PubMed]
- 28.Zhou, L., Luo, Y.: Deep features fusion with mutual attention transformer for skin lesion diagnosis. In: Presented at the 2021 IEEE International Conference on Image Processing (ICIP) (2021)
- 29.Gessert N, Nielsen M, Shaikh M, Werner R, Schlaefer A. Skin lesion classification using ensembles of multi-resolution EfficientNets with meta data. MethodsX. 2020;7:100864. doi: 10.1016/j.mex.2020.100864. [DOI] [PMC free article] [PubMed] [Google Scholar]
- 30.Höhn J, et al. Integrating patient data into skin cancer classification using convolutional neural networks: systematic review. J. Med. Internet Res. 2021;23(7):e20708. doi: 10.2196/20708. [DOI] [PMC free article] [PubMed] [Google Scholar]
- 31.Ningrum DNA, et al. Deep learning classifier with patient’s metadata of dermoscopic images in malignant melanoma detection. J. Multidiscip. Healthc. 2021;14:877. doi: 10.2147/JMDH.S306284. [DOI] [PMC free article] [PubMed] [Google Scholar]
- 32.Pacheco AG, Krohling RA. An attention-based mechanism to combine images and metadata in deep learning models applied to skin cancer classification. IEEE J. Biomed. Health Inform. 2021;25(9):3554–3563. doi: 10.1109/JBHI.2021.3062002. [DOI] [PubMed] [Google Scholar]
- 33.Kim, J.-H., On, K.-W., Lim, W., Kim, J., Ha, J.-W., Zhang, B.-T.: Hadamard product for low-rank bilinear pooling. arXiv preprint arXiv:1610.04325 (2016)
- 34.Kim, J.-H., Jun, J., Zhang, B.-T.: Bilinear attention networks. arXiv preprint arXiv:1805.07932 (2018)
- 35.Xiong, C., Merity, S., Socher, R.: Dynamic memory networks for visual and textual question answering. In: International Conference on Machine Learning, PMLR, pp. 2397–2406 (2016)
- 36.Bose, R., Pande, S., Banerjee, B.: Two headed dragons: multimodal fusion and cross modal transactions. In: 2021 IEEE International Conference on Image Processing (ICIP), IEEE, pp. 2893–2897 (2021)
- 37.Tschandl P, Rosendahl C, Kittler H. The HAM10000 dataset, a large collection of multi-source dermatoscopic images of common pigmented skin lesions. Sci. Data. 2018;5(1):1–9. doi: 10.1038/sdata.2018.161. [DOI] [PMC free article] [PubMed] [Google Scholar]
- 38.Codella, N., et al.: Skin lesion analysis toward melanoma detection 2018: a challenge hosted by the international skin imaging collaboration (isic). arXiv preprint arXiv:1902.03368 (2019)
- 39.Yu, Z., Yu, J., Fan, J., Tao, D.: Multi-modal factorized bilinear pooling with co-attention learning for visual question answering. In: Proceedings of the IEEE international conference on computer vision, pp. 1821–1830 (2017)
- 40.Khan, M.A., Javed, M.Y., Sharif, M., Saba, T., Rehman, A.: Multi-model deep neural network based features extraction and optimal selection approach for skin lesion classification. In: 2019 international conference on computer and information sciences (ICCIS), IEEE, pp. 1–7 (2019)
- 41.Huang HW, Hsu BWY, Lee CH, Tseng VS. Development of a light-weight deep learning model for cloud applications and remote diagnosis of skin cancers. J. Dermatol. 2021;48(3):310–316. doi: 10.1111/1346-8138.15683. [DOI] [PubMed] [Google Scholar]
- 42.Liu Q, Yu L, Luo L, Dou Q, Heng PA. Semi-supervised medical image classification with relation-driven self-ensembling model. IEEE Trans. Med. Imaging. 2020;39(11):3429–3440. doi: 10.1109/TMI.2020.2995518. [DOI] [PubMed] [Google Scholar]
- 43.Gu Y, Ge Z, Bonnington CP, Zhou J. Progressive transfer learning and adversarial domain adaptation for cross-domain skin disease classification. IEEE J. Biomed. Health Inform. 2019;24(5):1379–1393. doi: 10.1109/JBHI.2019.2942429. [DOI] [PubMed] [Google Scholar]


