

Abstract
The introduction of FDG in 1976 started a new discipline and enhanced the role of molecular imaging in medicine. While the initial intent with this tracer was to determine brain function in a variety of neuropsychiatric disorders, over time, this powerful approach has made a major impact on managing many other diseases and disorders. During the past 2 decades, FDG PET has been used to detect inflammatory lesions in the atherosclerotic plaques and in other settings. However, the suboptimal spatial resolution of PET limits its ability to visualize plaques that are very small in size. Furthermore, this tracer remains in the blood for an extended period and therefore provides suboptimal results. Target-to-background ratio (TBR) has been suggested to correct for this source of error. Unfortunately, TBR values vary substantially, depending on the timing of image acquisition. Delayed imaging at later time points (3–4 hours) may obviate the need for TBR measurement, but it is impractical with conventional PET instruments. Recently, 18F-sodium fluoride (NaF) has been used for detection and quantification of molecular calcification in the plaques. This tracer is highly specific for calcification and is rapidly cleared from the circulation. In addition, global atherosclerotic burden as measured by NaF PET can be determined accurately either in the heart or major arteries throughout the body. Therefore, the role of FDG PET–based TBR measurement for detection and quantification of atherosclerotic plaques is questionable at this time.
Key Words: atherosclerosis, cardiovascular Disease, FDG, NaF, PET quantification, target-to-background ratio (TBR)
The introduction of FDG in 1976 by investigators at the University of Pennsylvania started a new era in medical imaging, which is still evolving in many domains.1 The main motivation for initiating this research was to assess brain function in normal aging and various neuropsychiatric disorders.2 This was partly due to the limitations of PET instruments available at the time and partly because of the potential impact of such an approach in neuroscience research. However, with the introduction of whole-body PET imaging capabilities in the 1980s, the interest in applications of this compound rapidly shifted to assessing other disorders, and this interest continued over the ensuing decades.3 While initially FDG PET was used to assess brain tumors, over the years this approach has become the imaging modality of choice in the management of patients with a variety of malignant diseases and disorders.4 Since the mid-1990s, investigators have also realized the potential role of FDG PET in examining inflammatory and infectious disorders.5 In particular, during the past 2 decades, some efforts have been made to define the role of this modality in the assessment of atherosclerotic plaques in the major arteries.6,7 Several groups have started major projects for characterizing this very common and potentially fatal disease and for detecting changes following therapeutic interventions.8,9
Numerous scientific communications have been introduced to the literature about the role of FDG PET in assessing atherosclerosis as a primary disorder or secondary to inflammatory disorders such as psoriasis and rheumatoid arthritis.10–15
Over the years, major concerns have been raised about the ability of FDG PET as an imaging modality in detecting atherosclerosis and other subtle diseases in various organs in the body.16,17 The spatial resolution of PET even with modern and sophisticated designs is worse than 5 mm (depending on organs examined).18 Plaques in the arteries are relatively small, especially in the early stages of the disease, when they are no larger than a few millimeters in thickness. Therefore, in contrast to assessing cancer and other focal lesions that are relatively large in size and can be detected in spite of suboptimal spatial resolution of PET, detection and characterization of atherosclerotic plaques by FDG PET pose a major challenge to this imaging modality.19 Furthermore, the degree of uptake of FDG in inflammatory lesions in the plaques is also relatively low, and this leads to reduced contrast between these lesions and surrounding background activities.20,21 Therefore, the sensitivity of this technique in detecting plaques is quite low, particularly in the early stages of the disease.
One of the major issues that must be dealt with is the longstanding presence of FDG in the circulation, which may last up to a few hours following the administration of the compound.22 Unfortunately, most studies that have been reported in the literature have been based on imaging atherosclerosis 1 hour after the administration of FDG.8,9 Presence of high levels of FDG activity in the circulation leads to substantial overestimation of the tracer activity in the plaques that are in the arterial wall. These major limitations have been realized by investigators who have been actively involved in conducting this type of research at various stages of the disease. This particular issue has been of concern to the groups who are using FDG PET imaging to determine the efficacy of various therapeutic interventions treating atherosclerotic and vascular inflammation.8–10,13 These investigators have heavily emphasized the relevance of target-to-background ratio (TBR) correction for overcoming the errors caused by the high luminal blood pool activity. The approach involves dividing the levels of FDG uptake in the arterial wall by the blood pool activity in venous compartments such as the jugular vein or the superior vena cava or the right atrium.23,24 This approach has been extensively adopted for quantification of atherosclerosis by FDG PET in numerous research studies.8,9,12,23 Unfortunately, as is noted in Figure 1, TBR values vary substantially, depending on the time interval between the administration of FDG and image acquisition.20 Target-to-background ratio values are substantially higher when measured on delayed images. This observation seriously challenges the validity of such corrections. Furthermore, adding a second measurement from a compartment with a small lumen that is changing constantly introduces a major source of error.25 Therefore, the division of the arterial wall SUV by the venous blood pool activity will lead to significant variability and errors to the TBR measurement.25,26
FIGURE 1.

Graph plotting the mean FDG activity in the aorta (A), carotid arteries (B), and the right atrial blood pool at 65, 124, and 183 minutes after FDG administration. The ratio between the arterial and blood pool activity increased with time. The interrupted lines represent the 95% confidence interval of TBR values. Reproduced with permission from Blomberg et al.20
We believe this practice is unjustified and should be avoided in the future. If FDG remains as a justifiable marker for detection of inflammation in the plaques, the current quantitative methodologies should be substantially altered, and new approaches adopted in the future. The limited data in the literature show that delayed imaging up to 3 to 4 hours leads to significant clearance of FDG from the circulation and therefore substantially enhanced contrast between inflammatory atherosclerotic plaques and intraluminal activity in the arteries (Fig. 2).20,21 Unfortunately, such an approach is not a viable option with conventional PET instruments because of the limited sensitivity of these instruments for such delayed studies. Therefore, the role of conventional PET instruments in assessing atherosclerotic plaques with FDG is questionable.
FIGURE 2.
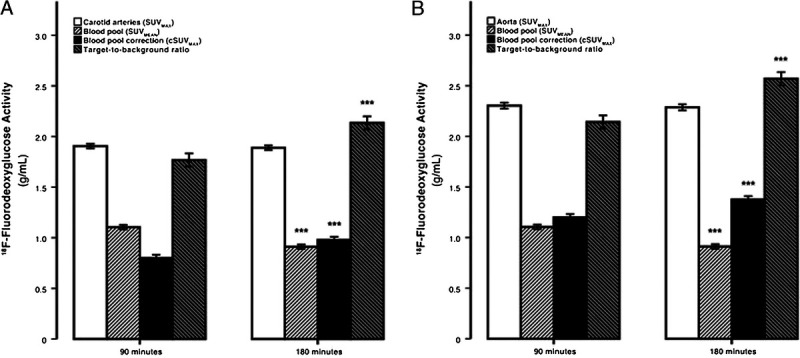
The dependence of SUVmax, blood-pool SUVmean, cSUVmax, and the TBR on FDG circulating time. The average maximum carotid (A) and aortic (B) arterial FDG activity was invariant to time, whereas blood-pool activity decreased and blood-pool corrected values and the TBR significantly increased with time. Error bars represent the 95% confidence interval of the mean. ***P < 0.0001 decline or increase compared with previous time point established by the paired Student t test. Reproduced with permission from Blomberg et al.21
The introduction of total body PET instruments may allow imaging up to several hours following the administration of FDG or other 18F-based PET tracers in the future (Fig. 3).27–29 The sensitivity of this new imaging modality is substantially higher (30×–40×) than that of conventional PET machines.27 Therefore, significant loss of activity due to decay of PET tracers will play a relatively minimal role in imaging with this modality. Furthermore, these instruments allow imaging the entire body over a short period, which also is very relevant to visualizing atherosclerotic plaques and quantifying the atherosclerotic burden. This systemic disease is widespread throughout the entire arterial system from the carotids in the neck to the tibial arteries in the lower extremities.30,31 Therefore, imaging with this modern and powerful instrument could rapidly alter the role of PET imaging in this very common and serious vascular disease.
FIGURE 3.

Delayed imaging at FDG PET (256 MBq injected, 14-minute scan duration). (Left-to-right) Images from scans performed at 1, 3, 8, and 10 hours after injection of FDG. (Top row) MIP images. (Bottom row) Coronal views of thorax and abdomen. Head motion artifacts are visible in 8-hour scan. This research was originally published by Badawi et al.27
Research studies over the past decade have demonstrated the importance of 18F-sodium fluoride (NaF) in detection and quantification of atherosclerosis.19,32,33 While the nonspecificity of FDG uptake has posed a major obstacle to detecting and quantifying specific processes such as atherosclerosis, NaF is very specific for calcification and ossification. Because atherosclerotic plaques are subject to significant degrees of calcification over the course of the disease, the uptake detected by NaF PET imaging is specific to the disease process and is not contaminated by unrelated activity in the surrounding structures. Therefore, what is visualized and measured reflects molecular calcification in the plaques.34 Furthermore, blood pool activity of NaF significantly decreases over the first hour after the administration of this compound. Therefore, imaging 1 hour after the administration of this tracer allows assessment of its uptake at the intended sites. However, with total body PET machines, it may be preferable to image at 2 to 3 hours after injection of this tracer, because this will considerably increase the target-to-noise ratio and therefore improve detection and quantification of plaque activity (Fig. 3). Furthermore, the intense uptake of FDG in the myocardium prevents detection of plaques in the coronary arteries. This has been a major limitation of FDG because coronary artery disease is a main source of morbidity and mortality in the affected population. By adopting NaF PET, this limitation is overcome, and the presence of the plaques in the coronaries can be successfully assessed.35,36 By adopting global disease assessment approach with PET, it is logical to determine the extent of the disease in the entire coronary arteries.37 This advantage will also have a revolutionary impact on the role of PET in this very important and common disease.
Increasingly, in recent years, reports have appeared in the literature describing potential uses for a multitude of PET tracers in this vascular disease.38–41 Unfortunately, adoption of these compounds is primarily based on in vitro and animal studies, and therefore, their role in assessing atherosclerosis is very minimal or nonexistent based on the published literature. Also, the limitations that have been described about FDG in this setting are even more applicable to several of these tracers. Therefore, we discourage such approaches because based on what is known about the limitations of PET in this domain, the results will be unreliable and misleading.
We encourage our colleagues to abandon the methodologies that are known to lead to erroneous results. PET and related techniques are highly scientific, and therefore, the validity of the approaches adopted should be predictable and verifiable by sound scientific designs. We believe that using reliable methodologies will improve the impact of PET as a powerful imaging modality for detection and management of atherosclerosis throughout the body. This will be of great importance for assessing the efficacy of various therapeutic inventions while the disease is in its early stages and likely to respond to treatment.
Footnotes
Conflicts of interest and sources of funding: none declared.
Contributor Information
Abass Alavi, Email: abass.alavi@pennmedicine.upenn.edu.
Thomas J. Werner, Email: tom.werner@pennmedicine.upenn.edu.
Poul Flemming. Høilund-Carlsen, Email: pfhc@rsyd.dk.
Mona-Elisabeth Revheim, Email: monar@ous-hf.no.
REFERENCES
- 1.Alavi A, Reivich M. Guest editorial: the conception of FDG-PET imaging. Semin Nucl Med. 2002;32:2–5. [DOI] [PubMed] [Google Scholar]
- 2.Newberg A, Alavi A, Reivich M. Determination of regional cerebral function with FDG-PET imaging in neuropsychiatric disorders. Semin Nucl Med. 2002;32:13–34. [DOI] [PubMed] [Google Scholar]
- 3.Hess S Blomberg BA Zhu HJ, et al. The pivotal role of FDG-PET/CT in modern medicine. Acad Radiol. 2014;21:232–249. [DOI] [PubMed] [Google Scholar]
- 4.Coleman RE Hillner BE Shields AF, et al. PET and PET/CT reports: observations from the National Oncologic PET Registry. J Nucl Med. 2010;51:158–163. [DOI] [PubMed] [Google Scholar]
- 5.Larson SM. Cancer or inflammation? A Holy Grail for nuclear medicine. J Nucl Med. 1994;35:1653–1655. [PubMed] [Google Scholar]
- 6.Yun M Yeh D Araujo LI, et al. F-18 FDG uptake in the large arteries: a new observation. Clin Nucl Med. 2001;26:314–319. [DOI] [PubMed] [Google Scholar]
- 7.Yun M Jang S Cucchiara A, et al. 18F FDG uptake in the large arteries: a correlation study with the atherogenic risk factors. Semin Nucl Med. 2002;32:70–76. [DOI] [PubMed] [Google Scholar]
- 8.Fayad ZA Mani V Woodward M, et al. Safety and efficacy of dalcetrapib on atherosclerotic disease using novel non-invasive multimodality imaging (dal-PLAQUE): a randomised clinical trial. Lancet. 2011;378:1547–1559. [DOI] [PMC free article] [PubMed] [Google Scholar]
- 9.Tawakol A Fayad ZA Mogg R, et al. Intensification of statin therapy results in a rapid reduction in atherosclerotic inflammation: results of a multicenter fluorodeoxyglucose-positron emission tomography/computed tomography feasibility study. J Am Coll Cardiol. 2013;62:909–917. [DOI] [PubMed] [Google Scholar]
- 10.Mehta NN Yu Y Saboury B, et al. Systemic and vascular inflammation in patients with moderate to severe psoriasis as measured by [18F]-fluorodeoxyglucose positron emission tomography–computed tomography (FDG-PET/CT): a pilot study. Arch Dermatol. 2011;147:1031–1039. [DOI] [PMC free article] [PubMed] [Google Scholar]
- 11.Rose S Sheth NH Baker JF, et al. A comparison of vascular inflammation in psoriasis, rheumatoid arthritis, and healthy subjects by FDG-PET/CT: a pilot study. Am J Cardiovasc Dis. 2013;3:273–278. [PMC free article] [PubMed] [Google Scholar]
- 12.Emami H Vijayakumar J Subramanian S, et al. Arterial 18F-FDG uptake in rheumatoid arthritis correlates with synovial activity. JACC Cardiovasc Imaging. 2014;7:959–960. [DOI] [PMC free article] [PubMed] [Google Scholar]
- 13.Mehta NN Shin DB Joshi AA, et al. Effect of 2 psoriasis treatments on vascular inflammation and novel inflammatory cardiovascular biomarkers: a randomized placebo-controlled trial. Circ Cardiovasc Imaging. 2018;11:e007394. [DOI] [PMC free article] [PubMed] [Google Scholar]
- 14.Gelfand JM Shin DB Alavi A, et al. A phase IV, randomized, double-blind, placebo-controlled crossover study of the effects of ustekinumab on vascular inflammation in psoriasis (the VIP-U trial). J Invest Dermatol. 2020;140:85–93.e82. [DOI] [PMC free article] [PubMed] [Google Scholar]
- 15.Gelfand JM Shin DB Duffin KC, et al. A randomized placebo-controlled trial of secukinumab on aortic vascular inflammation in moderate-to-severe plaque psoriasis (VIP-S). J Invest Dermatol. 2020;140:1784–1793.e1782. [DOI] [PMC free article] [PubMed] [Google Scholar]
- 16.Alavi A, Werner TJ, Høilund-Carlsen PF. What can be and what cannot be accomplished with PET to detect and characterize atherosclerotic plaques. J Nucl Cardiol. 2018;25:2012–2015. [DOI] [PubMed] [Google Scholar]
- 17.Alavi A, Werner TJ, Høilund-Carlsen PF. PET-based imaging to detect and characterize cardiovascular disorders: unavoidable path for the foreseeable future. J Nucl Cardiol. 2018;25:203–207. [DOI] [PubMed] [Google Scholar]
- 18.Alavi A Werner TJ Høilund-Carlsen PF, et al. Correction for partial volume effect is a must, not a luxury, to fully exploit the potential of quantitative PET imaging in clinical oncology. Mol Imaging Biol. 2018;20:1–3. [DOI] [PubMed] [Google Scholar]
- 19.Paydary K Revheim ME Emamzadehfard S, et al. Quantitative thoracic aorta calcification assessment by (18)F-NaF PET/CT and its correlation with atherosclerotic cardiovascular disorders and increasing age. Eur Radiol. 2021;31:785–794. [DOI] [PubMed] [Google Scholar]
- 20.Blomberg BA Akers SR Saboury B, et al. Delayed time-point 18F-FDG PET CT imaging enhances assessment of atherosclerotic plaque inflammation. Nucl Med Commun. 2013;34:860–867. [DOI] [PubMed] [Google Scholar]
- 21.Blomberg BA Thomassen A Takx RA, et al. Delayed 18F-fluorodeoxyglucose PET/CT imaging improves quantitation of atherosclerotic plaque inflammation: results from the CAMONA study. J Nucl Cardiol. 2014;21:588–597. [DOI] [PubMed] [Google Scholar]
- 22.Basu S Kung J Houseni M, et al. Temporal profile of fluorodeoxyglucose uptake in malignant lesions and normal organs over extended time periods in patients with lung carcinoma: implications for its utilization in assessing malignant lesions. Q J Nucl Med Mol Imaging. 2009;53:9–19. [PubMed] [Google Scholar]
- 23.Rudd JH Myers KS Bansilal S, et al. Atherosclerosis inflammation imaging with 18F-FDG PET: carotid, iliac, and femoral uptake reproducibility, quantification methods, and recommendations. J Nucl Med. 2008;49:871–878. [DOI] [PubMed] [Google Scholar]
- 24.Seraj SM Raynor WY Revheim ME, et al. Assessing the feasibility of NaF-PET/CT versus FDG-PET/CT to detect abdominal aortic calcification or inflammation in rheumatoid arthritis patients. Ann Nucl Med. 2020;34:424–431. [DOI] [PubMed] [Google Scholar]
- 25.Huet P Burg S Le Guludec D, et al. Variability and uncertainty of 18F-FDG PET imaging protocols for assessing inflammation in atherosclerosis: suggestions for improvement. J Nucl Med. 2015;56:552–559. [DOI] [PubMed] [Google Scholar]
- 26.Chen W, Dilsizian V. PET assessment of vascular inflammation and atherosclerotic plaques: SUV or TBR? J Nucl Med. 2015;56:503–504. [DOI] [PubMed] [Google Scholar]
- 27.Badawi RD Shi H Hu P, et al. First human imaging studies with the EXPLORER total-body PET scanner. J Nucl Med. 2019;60:299–303. [DOI] [PMC free article] [PubMed] [Google Scholar]
- 28.Saboury B Morris MA Farhadi F, et al. Reinventing molecular imaging with total-body PET, part I: technical revolution in evolution. PET Clin. 2020;15:427–438. [DOI] [PubMed] [Google Scholar]
- 29.Saboury B Morris MA Nikpanah M, et al. Reinventing molecular imaging with total-body, PET, part II: clinical applications. PET Clin. 2020;15:463–475. [DOI] [PMC free article] [PubMed] [Google Scholar]
- 30.Borja AJ Rojulpote C Hancin EC, et al. An update on the role of total-body PET imaging in the evaluation of atherosclerosis. PET Clin. 2020;15:477–485. [DOI] [PubMed] [Google Scholar]
- 31.Høilund-Carlsen PF Piri R Gerke O, et al. Assessment of total-body atherosclerosis by PET/computed tomography. PET Clin. 2021;16:119–128. [DOI] [PubMed] [Google Scholar]
- 32.McKenney-Drake ML Moghbel MC Paydary K, et al. (18)F-NaF and (18)F-FDG as molecular probes in the evaluation of atherosclerosis. Eur J Nucl Med Mol Imaging. 2018;45:2190–2200. [DOI] [PMC free article] [PubMed] [Google Scholar]
- 33.Moghbel M Al-Zaghal A Werner TJ, et al. The role of PET in evaluating atherosclerosis: a critical review. Semin Nucl Med. 2018;48:488–497. [DOI] [PubMed] [Google Scholar]
- 34.McKenney-Drake ML Territo PR Salavati A, et al. (18)F-NaF PET imaging of early coronary artery calcification. JACC Cardiovasc Imaging. 2016;9:627–628. [DOI] [PubMed] [Google Scholar]
- 35.Høilund-Carlsen PF Moghbel MC Gerke O, et al. Evolving role of PET in detecting and characterizing atherosclerosis. PET Clin. 2019;14:197–209. [DOI] [PubMed] [Google Scholar]
- 36.Høilund-Carlsen PF Sturek M Alavi A, et al. Atherosclerosis imaging with (18)F-sodium fluoride PET: state-of-the-art review. Eur J Nucl Med Mol Imaging. 2020;47:1538–1551. [DOI] [PMC free article] [PubMed] [Google Scholar]
- 37.Saboury B Edenbrandt L Piri R, et al. Alavi-Carlsen Calcification Score (ACCS): a simple measure of global cardiac atherosclerosis burden. Diagnostics (Basel). 2021;11. [DOI] [PMC free article] [PubMed] [Google Scholar]
- 38.Stacy MR, Maxfield MW, Sinusas AJ. Targeted molecular imaging of angiogenesis in PET and SPECT: a review. Yale J Biol Med. 2012;85:75–86. [PMC free article] [PubMed] [Google Scholar]
- 39.Ye YX Calcagno C Binderup T, et al. Imaging macrophage and hematopoietic progenitor proliferation in atherosclerosis. Circ Res. 2015;117:835–845. [DOI] [PMC free article] [PubMed] [Google Scholar]
- 40.Nie X Laforest R Elvington A, et al. PET/MRI of hypoxic atherosclerosis using 64Cu-ATSM in a rabbit model. J Nucl Med. 2016;57:2006–2011. [DOI] [PMC free article] [PubMed] [Google Scholar]
- 41.Nie X Elvington A Laforest R, et al. (64)Cu-ATSM positron emission tomography/magnetic resonance imaging of hypoxia in human atherosclerosis. Circ Cardiovasc Imaging. 2020;13:e009791. [DOI] [PMC free article] [PubMed] [Google Scholar]