Abstract
Graphitic carbon nitride (g-C3N4) has attracted wide attention due to its potential in solving energy and environmental issues. However, rapid charge recombination and a narrow visible light absorption region limit its performance. In our study, Mg-doped g-C3N4 was synthesized through a facile one-pot strategy for CO2 reduction. After Mg doping, the light utilization efficiency and photo-induced electron–hole pair separation efficiency of the catalysts were improved, which could be due to the narrower band gap and introduced midgap states. The highest amounts of CO and CH4 were obtained on Mg-CN-4% under ultraviolet light illumination, which were about 5.1 and 3.8 times that of pristine g-C3N4, respectively; the yield of CO and CH4 reached 12.97 and 7.62 μmol g−1 under visible light irradiation. Our work may provide new insight for designing advanced photocatalysts in energy conversion applications.
Graphitic carbon nitride (g-C3N4) has attracted wide attention due to its potential in solving energy and environmental issues.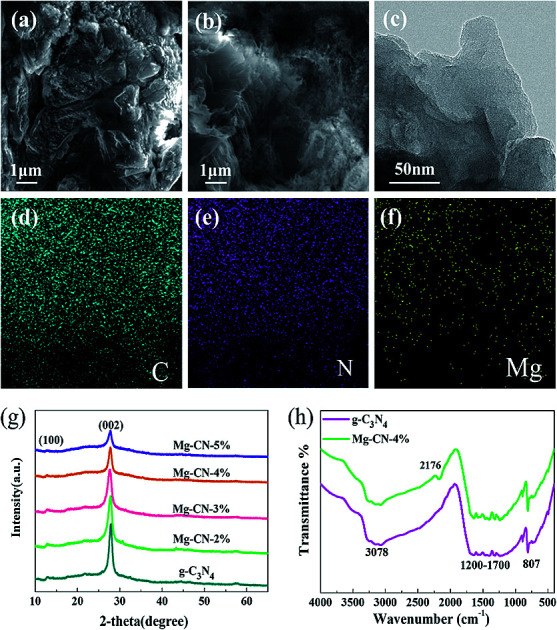
Introduction
Semiconductor photocatalysis technology is regarded as a green and promising strategy that uses solar energy to solve the energy crisis and environmental pollution problems faced by human beings.1–3 Fujishima and Honda successfully used a TiO2 photocatalyst for water splitting in 1972,4 which marked the beginning of a new era in the field of photocatalysis. At present, photocatalysts such as titanium dioxide (TiO2),5 zinc oxide (ZnO),6 graphene carbonitride (g-C3N4),7 bismuth oxide (Bi2O3),8 cadmium sulfide (CdS),9 and layered metal hydroxides,10 have been used in the field of photocatalysis.11
g-C3N4 is a potential 2D layered structure polymer organic semiconductor photocatalyst with a band gap width of 2.7 eV, which has attracted widespread attention of researchers.12–14 The advantages of low-cost, abundant and stability make it widely applied in water decomposition,15 CO2 reduction,16 NO removal,17 and organic pollutant degradation.18 However, the low specific surface area, high photo-generated electron–hole pairs recombination, and low visible-light harvesting capacity limit its development.19,20
Strategies for g-C3N4 modification, including metal doping (K,21 Cu,22 Pd,23 Mn24), non-metal doping (B,25 N,26 S,27 P28), semiconductor recombination (V2O5,29 MnO2,30 CeO2,31 TiO2 (ref. 32)), and so on, have been developed to suppress the recombination of photo-generated electron–hole pairs, expand the visible light response range, and improve the photocatalytic performance.33,34 Among these strategies, element doping was a hot research. For example, Kumar et al. synthesized Se-doped g-C3N4 by facile one-pot two-step strategy and the catalysts demonstrated high photocatalytic performance in CO2 reduction.35 Wang et al. synthesized K-doped g-C3N4 by thermal polymerization, and the photocatalytic hydrogen evolution rate of K-doped g-C3N4 was improved.21 Tang et al. synthesized Mg/g-C3N4 by hydrothermal deposition method and the results show that Mg element plays an important role in increasing electron–holes pairs separation and extending the range of light response.36 However, doping of Mg into carbon nitride by one-pot method has not been explored so far.
In this manuscript, Mg-doped g-C3N4 photocatalysts with various doping amount have been successfully prepared by one-pot method with magnesium chloride as Mg source. The catalysts were characterized by a series of methods such as, XRD, TEM, XPS, UV-vis, and PL. The catalytic performance towards photocatalytic CO2 reduction was evaluated in the gas phase reactor.
Results and discussion
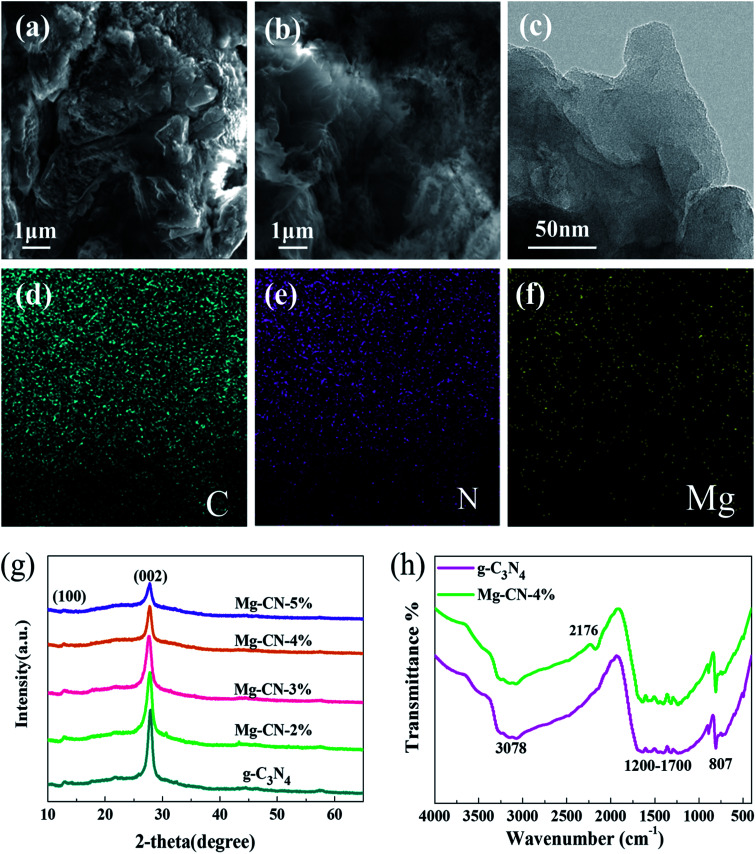
The morphologies of samples were observed by SEM. As shown in Fig. 1(a), the SEM image of g-C3N4 displays typical two-dimensional layered structure with wrinkles and irregular stacks.37 After doping Mg (Fig. 1(b)), the morphology of g-C3N4 changes to some extent, which may be attributed to delamination effect.38 Compared with g-C3N4, the layers of Mg-CN-4% become thinner and curlier. The Mg-CN-4% having optimum photocatalytic activity was selected for TEM characterization. The TEM image of Mg-CN-4% shows a typical layered structure in Fig. 1(c).39 The EDX spectrum (Fig. S1†) and elemental mapping of the Mg-CN-4% indicates that the sample consisted of C, N and Mg elements.
Fig. 1. SEM images of (a) g-C3N4, (b) Mg-CN-4%; (c) TEM image of Mg-CN-4%; (d) elemental mapping images of C, (e) N, (f) Mg of Mg-CN-4%; (g) XRD spectra of samples; (h) FTIR spectra of g-C3N4 and Mg-CN-4%.
The crystalline structures of samples were analyzed by XRD. Fig. 1(g) shows XRD patterns of g-C3N4 and Mg-doped g-C3N4. For g-C3N4 sample, there are two typical diffraction peaks at 12.86° and 27.79° corresponding to (100) and (002) facet of g-C3N4. The peak at 12.86° is assigned to in-plane repeating tri-s-triazine units, and the sharp peak at 27.79° is ascribed to interlayer stacking of conjugated aromatics.40 Mg-doped g-C3N4 has similar diffraction peaks with g-C3N4, indicating that Mg doping does not change the graphitic-like structure of g-C3N4. No diffraction peaks of the Mg species were observed in the Mg-CN-4%, manifesting that Mg was successfully doped into g-C3N4. After doping Mg, the peak intensity of the catalyst decreases, indicating that Mg doping can reduce the crystallinity of g-C3N4.41
The doping state and bonding characteristics of g-C3N4 and Mg-CN-4% was confirmed by FTIR spectra. In Fig. 1(h), the representative peak appeared at 807 cm−1 belonged to the characteristic breathing vibration mode for tri-s-triazine rings of g-C3N4,42 and the peaks at 1200–1700 cm−1 are ascribed to the typical CN heterocycles stretching modes.43 The peaks at 1240–1400 cm−1 and 1480–1650 cm−1 are assigned to the stretching modes of C–N and C N groups, respectively.21 Another broad peak at around 3078 cm−1 is caused by N–H bonds, which is derived from uncondensed amine groups.44 Compared with g-C3N4, a distinct peak appeared at 2176 cm−1 in Mg-CN-4%, which can be attributed to C N group. Due to Mg-induced surface defects, some sp2 C–N bonds were converted into C N bonds in Mg-CN-4%.45,46
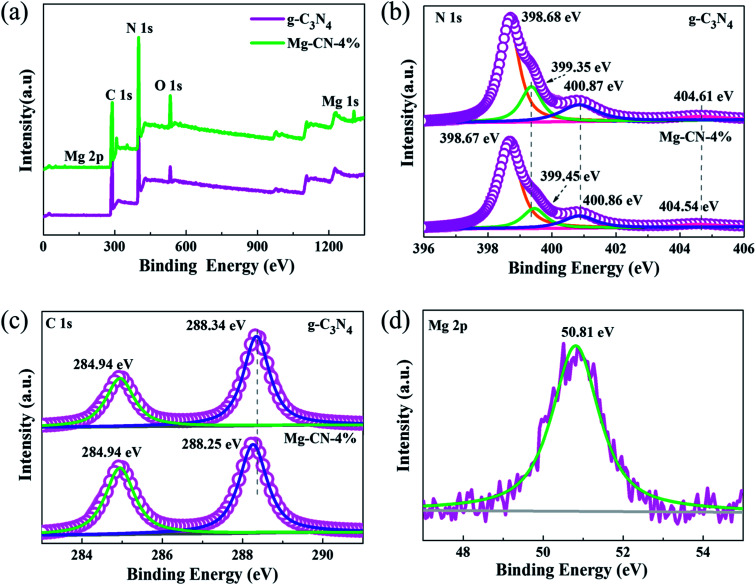
To further examine the surface chemical composition and elemental valence of samples, XPS measurements was performed. Fig. 2(a) illustrates XPS survey spectra of g-C3N4 and Mg-CN-4%, elements of C, N, O were detected in both catalysts. Mg elements can be observed in Mg-CN-4%, which is consistent with the results of XRD. The N1s peaks of g-C3N4 can be deconvoluted into four characteristic peaks with binding energy at 398.68 eV, 399.35 eV, 400.87 eV, and 404.61 eV, respectively (Fig. 2(b)). The most intense peak was at 398.68 eV, corresponding to sp2 hybridized N in C–N C groups. The peaks at 399.35 eV and 400.87 eV are ascribed to tertiary N atoms bonded of N–(C)3 groups and amino functional groups47 and the peak at 404.61 eV is attributed to typical π-excitations in the heterocycles. The C1s spectra of g-C3N4 are shown in Fig. 2(c), from which two peaks can be observed at 284.94 eV and 288.25 eV, corresponding to C–C bonds and N–C–N coordination in the graphitic structure, respectively.48 The Mg2p binding energy is 50.81 eV, which usually belongs to Mg2+.49,50 In the O1s XPS spectra (Fig. S2†), no peaks appeared at ∼528–531 eV, which correspond to O in metal oxides.23 Therefore, magnesium is doped into the CN skeleton in an ionic state. Compared with g-C3N4, the C1s and N1s peaks of Mg-CN-4% show a slight shift, indicating that the surface chemical structure of Mg-doped g-C3N4 changes.51
Fig. 2. (a) Wide survey scans, (b) N1s high-resolutions, (c) C1s high-resolutions of g-C3N4 and Mg-CN-4%, (d) Mg2p high-resolutions of Mg-CN-4%.
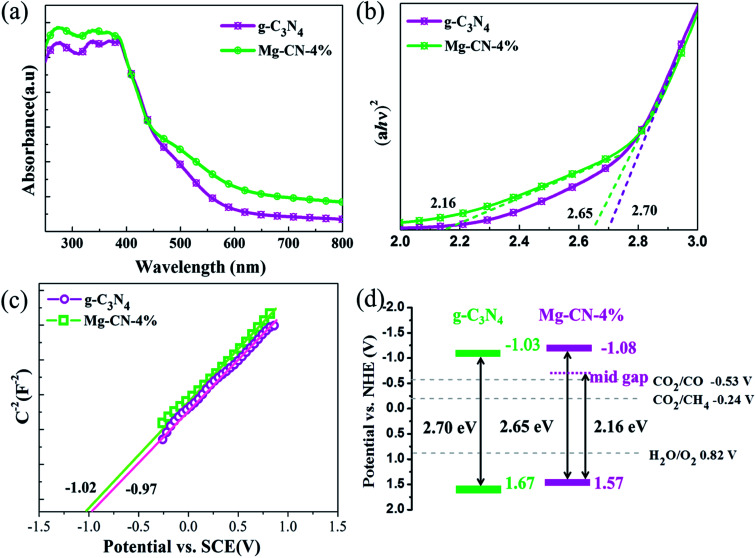
The optical absorption properties of g-C3N4 and Mg-CN-4% were studied by UV-vis diffuse reflectance spectra. As seen in Fig. 3(a), the intensity of light absorption of Mg-CN-4% was higher than g-C3N4 from ultraviolet light to visible light region. The optical band gap energies of as-prepared photocatalysts have been calculated by using the following formula:ahν = A(hν − Eg)nwhere a, h, ν, A and Eg are the absorption coefficient, Planck's constant, light frequency, proportionality constant and bandgap, respectively.52 The optical band gap energies for samples were obtained from a plot of (ahν)2vs. hν (n = 1/2 for a direct transition, n = 2 for an indirect transition). As shown in Fig. 4(b), the band gap of g-C3N4 was estimated to be 2.70 eV, which is equal to the band gap in the previously reported paper.53 It is clearly revealed that Mg doping reduced the band gap of Mg-CN-4% to 2.65 eV. The UV-vis spectra of Mg-CN-4% presented a tail absorption which indicates the formation of the midgap states.35 It is reported that such midgap states is due to the existence of disorders/defects within the band gap.54 The Mott–Schottky curves of g-C3N4 and Mg-CN-4% are shown in Fig. 3(c). The flat band potentials of g-C3N4 and Mg-CN-4% were confirmed as −0.97 V and −1.02 V vs. SCE, which correspond to −0.73 V and −0.78 V vs. NHE, respectively. According to the rule of thumb, the conduction band (CB) is more negative by about −0.3 eV than the flat band potential.42 The CB of g-C3N4 and Mg-CN-4% could be estimated to be −1.03 V and −1.08 V. According to their band gap, the valence band (VB) position of g-C3N4 and Mg-CN-4% can be calculated as 1.67 V and 1.57 V, respectively. Combined UV-vis spectrum with the Mott–Schottky curves, Fig. 3(d) shows the VB and CB positions of Mg-CN-4%. The midgap states energy from VB to midgap states for Mg-CN-4% was determined to be 2.16 eV. Therefore, the exact position of midgap states for Mg-CN-4% was calculated as −0.59 V, which is higher than CO2 reduction level (CO2/CO, −0.53 V vs. NHE; CO2/CH4, −0.24 V vs. NHE). Due to the presence of midgap states, Mg-CN-4% could harvest long-wavelength visible light to stimulate electrons in the VB to midgap states.55,56 Moreover, the excited electrons in CB could be temporarily trapped by midgap states to suppress electron–hole pairs recombination.57,58
Fig. 3. (a) UV-vis diffuse reflectance spectra, (b) the plots of (ahν)2versus hν for the band gap energies, (c) Mott–Schottky plots, (d) band gap structure of g-C3N4 and Mg-CN-4%.
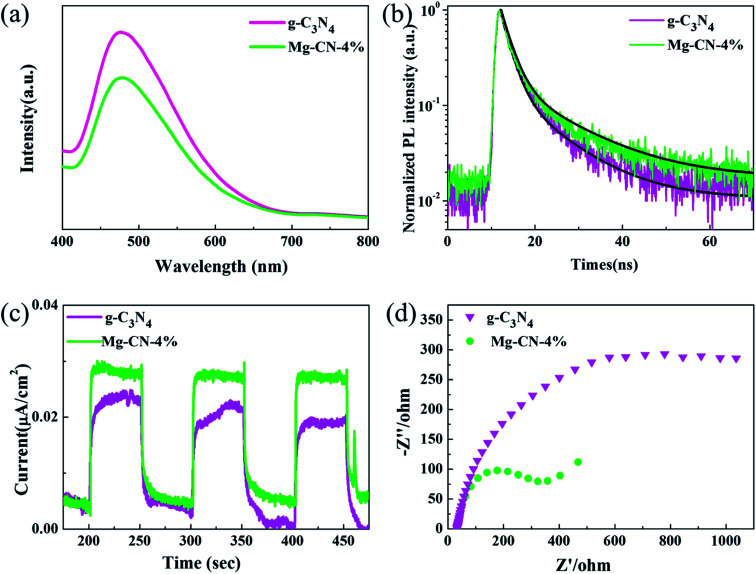
Fig. 4. (a) Photoluminescence spectra, (b) time-resolved PL spectra, (c) transient photocurrent–time curves, (d) electrochemical impedance spectra of g-C3N4 and Mg-CN-4%.
PL analysis is commonly performed to study the migration, transfer and recombination of electron–hole pairs produced by the photocatalyst. The PL spectra of g-C3N4 and Mg-CN-4% with excitation wavelength of 325 nm are shown in Fig. 4(a). It can be seen that the spectra of Mg-CN-4% is similar to g-C3N4 with a strong peak around 465 nm. When Mg was added, the PL intensity clearly decreases, indicating that Mg-doped g-C3N4 can suppress the recombination of photo-generated electron–hole pairs. The midgap states might act as the center for entrapment of electrons, and enhances photocatalytic activity of catalyst.35 As displayed in Fig. 4(b), a longer recombination lifetime of Mg doped g-C3N4 was examined by time-resolved photoluminescence, indicating that the recombination of carriers was suppressed, which is consistent with the PL results.
Fig. 4(c) shows the transient photocurrent–time (I–t) curves for two samples with interval 50 s light on/off cycle of visible light irradiation. Notably, photocurrent intensity of Mg-CN-4% reached 0.028 μA cm−2, which is higher than that of g-C3N4. The photocurrent intensity sharply increased from the light-off to light-on state, which is attributed to fast photo-generated electrons transport on the sample surface.59 Hence, a higher photocurrent response indicates a lower electron–hole recombination. Fig. 4(d) shows electrochemical impedance spectroscopy of g-C3N4 and Mg-CN-4%. It can be clearly observed that the arc radius of EIS Nyquist plot become smaller after doping Mg, which reflects more effective separation of electron–hole pairs.60
Evaluation of photocatalytic activity
The ultraviolet photocatalytic activity of g-C3N4 and g-C3N4 doped with different magnesium amount are shown in Fig. 5(a) and (b). Under the combined action of ultraviolet irradiation, water vapor and carbon dioxide, the products of CO and CH4 were detected by gas chromatography after 8 h photocatalytic reaction, and the accumulation of CO was much higher than that of CH4. The optimum doping amount of the samples is Mg-CN-4%, and the yield of CO and CH4 can reach up to 57.90 and 9.12 μmol g−1, which is 5.1 and 3.8 times of that produced by g-C3N4. When Mg-CN-2%, Mg-CN-3%, Mg-CN-5% were used as catalysts, the accumulation of CO can reach to 25.35, 47.23, 26.54 μmol g−1, and the yield of CH4 is 4.66, 8.25, 5.49 μmol g−1. The visible light photocatalytic activity of g-C3N4 and Mg-CN-4% is shown in Fig. 5(c). After 8 h of visible light irradiation, the yield of CO were 6.35, 12.97 μmol g−1, and yield of CH4 were 2.01 and 7.62 μmol g−1, respectively.
Fig. 5. UV-light photocatalytic activity of g-C3N4 and Mg-doped g-C3N4 samples (a) the yield of CO, (b) the yield of CH4; (c) visible-light activity of g-C3N4 and Mg-CN-4%.
According to the analysis above, the light utilization efficiency of the g-C3N4 has been improved after Mg doping, which could due to the narrowed down band gap and introduced midgap states. The proper amount of Mg doping can suppress the recombination of photo-induced electron–hole pairs, thus improving photocatalytic activity.
Conclusion
In summary, a facile one-pot strategy is used for the fabrication of Mg-doped g-C3N4 which exhibit considerable UV-light and visible-light photocatalytic CO2 reduction activity. The optimum amount of the dopant was discovered to be 4 wt%, and its yield of CO and CH4 were about 5.1 and 3.8 times that of pristine g-C3N4 under UV-light, and reached 12.97 and 7.62 μmol g−1 under visible light irradiation. Such kind of enhancement could be attributed to the increased light utilization efficiency as well as the promoted photo-induced charge carrier separation due to the narrowed down band gap and introduced midgap states after effective Mg doping. This work is expected to open up a new insight to design highly active metal-free photocatalysts for solar-light-driven CO2 reduction.
Experimental
Preparation of bulk g-C3N4
A certain amount of melamine was weighed into a crucible, and calcined in a muffle furnace at 550 °C for 4 h at a heating rate of 2.5 °C min−1. After cooling to room temperature, the yellow-colored product was grounded into powder.
Synthesis of Mg-doped g-C3N4 catalysts
6.3 g of melamine and a certain amount of MgCl2·6H2O were dissolved in 80 mL of an alcohol–water mixed solution (2 : 1 by volume), and ultrasonically dispersed for 1 h, followed by 3 h stirring. The mixture was then dried at 80 °C to remove the solvent. Finally, the solid mixture was placed in a crucible and calcined at 550 °C for 4 h in a muffle furnace. After cooling to room temperature, it was grounded into powder. The synthesized product is labeled as Mg-CN-X, where X is the molar ratio of Mg to melamine (X = 2%, 3%, 4%, 5%).
Characterization
X-Ray diffraction (XRD) patterns were carried out by an Ultima IV X-ray diffractometer. The scanning electron microscopy (SEM) analyses were conducted using a Quanta 3D FEG apparatus. Transmission electron microscopy (TEM) image was obtained by a JEM-2100 microscope. Fourier transform infrared (FTIR) spectrum was performed on a Nicolet iS50. X-ray photoelectron spectroscopy (XPS) was acquired in Thermo scientific ESCALAB 250Xi X-ray photoelectron spectrometer. The UV-vis diffuse reflectance spectroscopy (DRS) of the samples was measured using an Agilent Cary 5000 spectrometer. The photoluminescence (PL) spectrum of the samples were measured with an F-4600 fluorometer at excitation wavelength of 325 nm. Time-resolved photoluminescence spectra of samples were recorded on a FLS920 Full-featured fluorescence spectrometer at excitation wavelength of 330 nm.
Photoelectrochemical measurements
The photocurrent was measured by using a CHI1030B electrochemical workstation in a standard three-electrode system. A 300 W xenon lamp was used to provide visible light. For the prepared working electrode, 10 mg of the obtained sample was dispersed in ultrapure water, then 1 mL of Nafion solution (0.5 wt%) was added. 10 μL of the suspension was dropped on fluorine-doped tin oxide (FTO) glass, and dried at room temperature. Mott–Schottky plots were measured on the above-mentioned three-electrode system with a frequency of 1000 Hz. The electrochemical impedance spectroscopy (EIS) of samples was performed by using a CHI760D with potassium ferricyanide solution as electrolyte solution.
Photocatalytic experiment
The photocatalytic CO2 reduction of the samples was carried out in a self-made rectangular reactor. Firstly, 20 mg of the catalyst was plated on the bottom of the reactor, then high purity CO2 (99.999%) was passed through a water vapor reactor at a flow rate of 15 ml min−1. In order to exhaust air, the mixed gas (CO2, H2O) was passed through the photocatalytic reactor for 20 minutes. Finally, close the air outlet, then reduce the flow rate and stop ventilation after 10 minutes. The 300 W xenon lamp was used to provide the UV light and visible light. After irradiation for 8 h, the mixed gas in the reactor was analyzed by a gas chromatograph.
Conflicts of interest
There are no conflicts to declare.
Supplementary Material
Acknowledgments
This work was supported by the National Natural Science Foundation of China (No. 51702014) and the Fundamental Research Funds for the Central Universities (FRF-AS-17-002).
Electronic supplementary information (ESI) available. See DOI: 10.1039/c9ra04606b
References
- Hu C. Hung W. Wang M. Lu P. Carbon. 2018;127:374. doi: 10.1016/j.carbon.2017.11.019. [DOI] [Google Scholar]
- Sun Z. Wang H. Wu Z. Wang L. Catal. Today. 2018;300:160. doi: 10.1016/j.cattod.2017.05.033. [DOI] [Google Scholar]
- Liao G. Fang J. Li Q. Li S. Xu Z. Fang B. Nanoscale. 2019;11:7062. doi: 10.1039/C9NR01408J. [DOI] [PubMed] [Google Scholar]
- Fujishima A. Honda K. Nature. 1972;238:37. doi: 10.1038/238037a0. [DOI] [PubMed] [Google Scholar]
- Khalilzadeh A. Shariati A. Sol. Energy. 2018;164:251. doi: 10.1016/j.solener.2018.02.063. [DOI] [Google Scholar]
- Li W. Wang G. Feng Y. Li Z. Appl. Surf. Sci. 2018;428:154. doi: 10.1016/j.apsusc.2017.09.049. [DOI] [Google Scholar]
- Hu J. Li H. Huang C. Liu M. Qiu X. Appl. Catal., B. 2013;598:142. [Google Scholar]
- Wen J. Xie J. Chen X. Li X. Appl. Surf. Sci. 2017;391:72. doi: 10.1016/j.apsusc.2016.07.030. [DOI] [Google Scholar]
- Zhou M. Chen J. Hou C. Liu Y. Xu S. Yao C. Li Z. Appl. Surf. Sci. 2019;470:908. doi: 10.1016/j.apsusc.2018.11.207. [DOI] [Google Scholar]
- Zhang M. Luo Z. Zhou M. Zhang G. Alamry K. A. Taib L. A. Asiri A. M. Wang X. Appl. Catal., B. 2017;210:454. doi: 10.1016/j.apcatb.2017.03.080. [DOI] [Google Scholar]
- Fang B. Bonakdarpour A. Reilly K. Xing Y. Taghipour F. Wilkinson D. P. ACS Appl. Mater. Interfaces. 2014;6:15488. doi: 10.1021/am504128t. [DOI] [PubMed] [Google Scholar]
- Liao G. Gong Y. Zhang L. Gao H. Yang G. Fang B. Energy Environ. Sci. 2019 doi: 10.1039/C9EE00717B. [DOI] [Google Scholar]
- Huang D. Li Z. Zeng G. Zhou C. Xue W. Gong X. Yan X. Chen S. Wang W. Cheng M. Appl. Catal., B. 2019;240:153. doi: 10.1016/j.apcatb.2018.08.071. [DOI] [Google Scholar]
- Hu S. Ma L. You J. Li F. Fan Z. Lu G. Liu D. Gui J. Appl. Surf. Sci. 2014;311:164. doi: 10.1016/j.apsusc.2014.05.036. [DOI] [Google Scholar]
- Zeng Y. Li H. Luo J. Yuan J. Wang L. Liu C. Xia Y. Liu M. Luo S. Cai T. Liu S. Crittenden J. C. Appl. Catal., B. 2019;249:275. doi: 10.1016/j.apcatb.2019.03.010. [DOI] [Google Scholar]
- Tang J. Guo R. Zhou W. Huang C. Pan W. Appl. Catal., B. 2018;237:802. doi: 10.1016/j.apcatb.2018.06.042. [DOI] [Google Scholar]
- Zhou M. Dong G. Yu F. Huang Y. Appl. Catal., B. 2019;256:1037. [Google Scholar]
- Li G. Wang B. Zhang J. Wang R. Liu H. Appl. Surf. Sci. 2019;478:1056. doi: 10.1016/j.apsusc.2019.02.035. [DOI] [Google Scholar]
- Xiong Z. Wang H. Xu N. Li H. Fang B. Zhao Y. Zhang J. Zheng C. Int. J. Hydrogen Energy. 2015;40:10049. doi: 10.1016/j.ijhydene.2015.06.075. [DOI] [Google Scholar]
- Wu J. Li N. Zhang X. Fang H. Zheng Y. Tao X. Appl. Catal., B. 2018;226:61. doi: 10.1016/j.apcatb.2017.12.045. [DOI] [Google Scholar]
- Wang Y. Zhao S. Zhang Y. Fang J. Zhou Y. Yuan S. Zhang C. Chen W. Appl. Surf. Sci. 2018;440:258. doi: 10.1016/j.apsusc.2018.01.091. [DOI] [Google Scholar]
- Le S. Jiang T. Zhao Q. Liu X. Li Y. Fang B. Gong M. RSC Adv. 2016;6:38811. doi: 10.1039/C6RA03982K. [DOI] [Google Scholar]
- Wang N. Wang J. Hu J. Lu X. Sun J. Shi F. Liu Z. Lei Z. Jiang R. ACS Appl. Energy Mater. 2018;1:2866. doi: 10.1021/acsaem.8b00526. [DOI] [Google Scholar]
- Wang J. Cui C. Kong Q. Ren C. Li Z. Qu L. Zhang Y. Jiang K. Chem. Eng. J. 2019;359:723. doi: 10.1016/j.cej.2018.11.165. [DOI] [Google Scholar]
- Yan S. C. Li Z. S. Zou Z. G. Langmuir. 2010;26:3894. doi: 10.1021/la904023j. [DOI] [PubMed] [Google Scholar]
- Zhou Y. Zhang L. Huang W. Kong Q. Fan X. Wang M. Shi J. Carbon. 2016;99:111. doi: 10.1016/j.carbon.2015.12.008. [DOI] [Google Scholar]
- Liu G. Niu P. Sun C. Smith S. C. Chen Z. Lu G. Cheng H. J. Am. Chem. Soc. 2010;132:11642. doi: 10.1021/ja103798k. [DOI] [PubMed] [Google Scholar]
- Bellardita M. García-López E. I. Marcì G. Krivtsov I. García J. R. Appl. Catal., B. 2018;220:222. doi: 10.1016/j.apcatb.2017.08.033. [DOI] [Google Scholar]
- Hong Y. Jiang Y. Li C. Fan W. Yan X. Yan M. Shi W. Appl. Catal., B. 2016;180:663. doi: 10.1016/j.apcatb.2015.06.057. [DOI] [Google Scholar]
- Wang M. Shen M. Zhang L. Tian J. Jin X. Zhou Y. Shi J. Carbon. 2017;120:23. doi: 10.1016/j.carbon.2017.05.024. [DOI] [Google Scholar]
- Li M. Zhang L. Wu M. Du Y. Fan X. Wang M. Zhang L. Kong Q. Shi J. Nano Energy. 2016;19:145. doi: 10.1016/j.nanoen.2015.11.010. [DOI] [Google Scholar]
- Zhou L. Wang L. Lei J. Liu Y. Zhang J. Catal. Commun. 2017;89:125. doi: 10.1016/j.catcom.2016.09.022. [DOI] [Google Scholar]
- Fang B. Xing Y. Bonakdarpour A. Zhang S. Wilkinson D. P. ACS Sustainable Chem. Eng. 2015;3:2381. doi: 10.1021/acssuschemeng.5b00724. [DOI] [Google Scholar]
- Ye L. Wu D. Chu K. H. Wang B. Xie H. Yip H. Y. Wong P. K. Chem. Eng. J. 2016;304:376. doi: 10.1016/j.cej.2016.06.059. [DOI] [Google Scholar]
- Kumar A. Yadav R. K. Park N. Baeg J. ACS Appl. Nano Mater. 2018;1:47. doi: 10.1021/acsanm.7b00024. [DOI] [Google Scholar]
- Tang J. Zhou W. Guo R. Huang C. Pan W. Catal. Commun. 2018;107:92. doi: 10.1016/j.catcom.2018.01.006. [DOI] [Google Scholar]
- Liu S. Zhu H. Yao W. Chen K. Chen D. Appl. Surf. Sci. 2018;430:309. doi: 10.1016/j.apsusc.2017.07.108. [DOI] [Google Scholar]
- Yan Q. Huang G. Li D. Zhang M. Pan A. Huang W. Mater. Sci. Technol. 2018;34:2515. doi: 10.1016/j.jmst.2017.06.018. [DOI] [Google Scholar]
- Wu X. Cheng J. Li X. Li Y. Lv K. Appl. Surf. Sci. 2019;465:1037. doi: 10.1016/j.apsusc.2018.09.165. [DOI] [Google Scholar]
- Guo F. Shi W. Zhu C. Li H. Kang Z. Appl. Catal., B. 2018;226:412. doi: 10.1016/j.apcatb.2017.12.064. [DOI] [Google Scholar]
- Fang W. Liu J. Yu L. Jiang Z. Shangguan W. Appl. Catal., B. 2017;209:631. doi: 10.1016/j.apcatb.2017.03.041. [DOI] [Google Scholar]
- Li Q. Sun Z. Wang H. Wu Z. J. CO2 Util. 2018;28:126. doi: 10.1016/j.jcou.2018.09.019. [DOI] [Google Scholar]
- Hua S. Ma L. You J. Li F. Fan Z. Lu G. Liu D. Gui J. Appl. Surf. Sci. 2014;311:164. doi: 10.1016/j.apsusc.2014.05.036. [DOI] [Google Scholar]
- Sun Z. Theresa Agatha Fischer J. M. Li Q. Hu J. Tang Q. Wang H. Wu Z. Hankel M. Searles D. J. Wang L. Appl. Catal., B. 2017;216:146. doi: 10.1016/j.apcatb.2017.05.064. [DOI] [Google Scholar]
- Oh W. Chang V. W. C. Hu Z. Goei R. Lim T. Chem. Eng. J. 2017;323:260. doi: 10.1016/j.cej.2017.04.107. [DOI] [Google Scholar]
- Yue B. Li Q. Iwai H. Kako T. Ye J. Sci. Technol. Adv. Mater. 2011;12:034401. doi: 10.1088/1468-6996/12/3/034401. [DOI] [PMC free article] [PubMed] [Google Scholar]
- Liu E. Chen J. Ma Y. Feng J. Jia J. Fan J. Hu X. J. Colloid Interface Sci. 2018;524:313. doi: 10.1016/j.jcis.2018.04.038. [DOI] [PubMed] [Google Scholar]
- Raziq F. Qu Y. Humayun M. Zada A. Yu H. Jing L. Appl. Catal., B. 2017;201:486. doi: 10.1016/j.apcatb.2016.08.057. [DOI] [Google Scholar]
- Behnajady M. A. Alizade B. Modirshahla N. Photochem. Photobiol. 2011;87:1308. doi: 10.1111/j.1751-1097.2011.01002.x. [DOI] [PubMed] [Google Scholar]
- Liu J. Yang H. Tan W. Zhou X. Lin Y. Electrochim. Acta. 2014;129:459. doi: 10.1016/j.electacta.2014.02.129. [DOI] [Google Scholar]
- Huang H. Xiao K. Tian N. Dong F. Zhang T. Du X. Zhang Y. J. Mater. Chem. A. 2017;5:17452. doi: 10.1039/C7TA04639A. [DOI] [Google Scholar]
- Pany S. Parida K. M. Phys. Chem. Chem. Phys. 2015;17:8070. doi: 10.1039/C4CP05582A. [DOI] [PubMed] [Google Scholar]
- Wang X. Blechert S. Antonietti M. ACS Catal. 2012;2:1596. doi: 10.1021/cs300240x. [DOI] [Google Scholar]
- Yaghoubi H. Li Z. Chen Y. Ngo H. T. Bhethanabotla V. R. Joseph B. Ma S. Schlaf R. Takshi A. ACS Catal. 2015;5:327. doi: 10.1021/cs501539q. [DOI] [Google Scholar]
- Jiang L. Yuan X. Zeng G. Liang J. Wu Z. Yu H. Mo D. Wang H. Xiao Z. Zhou C. J. Colloid Interface Sci. 2019;536:17. doi: 10.1016/j.jcis.2018.10.033. [DOI] [PubMed] [Google Scholar]
- Ran J. Ma T. Y. Gao G. Du X. Qiao S. Z. Energy Environ. Sci. 2015;8:3708. doi: 10.1039/C5EE02650D. [DOI] [Google Scholar]
- Ding R. Cao S. Chen H. Jiang F. Wang X. Colloids Surf., A. 2019;563:263. doi: 10.1016/j.colsurfa.2018.12.020. [DOI] [Google Scholar]
- Tu W. Xu Y. Wang J. Zhang B. Zhou T. Yin S. Wu S. Li C. Huang Y. Zhou Y. Zou Z. Robertson J. Kraft M. Xu R. ACS Sustainable Chem. Eng. 2017;5:7260. doi: 10.1021/acssuschemeng.7b01477. [DOI] [Google Scholar]
- Zhang J. Liu S. Yu J. Jaroniec M. J. Mater. Chem. 2011;21:14655. doi: 10.1039/C1JM12596F. [DOI] [Google Scholar]
- Yang L. Huang J. Shi L. Cao L. Liu H. Liu Y. Li Y. Song H. Jie Y. Ye J. Appl. Catal., B. 2018;221:670. doi: 10.1016/j.apcatb.2017.09.041. [DOI] [Google Scholar]
Associated Data
This section collects any data citations, data availability statements, or supplementary materials included in this article.


