

Abstract
Mutations in the mitochondrial protein CHCHD2 cause autosomal dominant Parkinson’s disease characterized by the preferential loss of substantia nigra dopamine (DA) neurons. Therefore, understanding the function of CHCHD2 in neurons may provide vital insights into how mitochondrial dysfunction contributes to neurodegeneration in PD. To investigate the normal requirement and function of CHCHD2 in neurons, we first examined CHCHD2 levels and showed that DA neurons have higher CHCHD2 levels than other neuron types, both in vivo and in co-culture. We then generated mice with either a targeted deletion of CHCHD2 in DA neurons or a deletion in the brain or total body. All three models were viable, and loss of CHCHD2 in the brain did not cause degeneration of DA neurons. Mice lacking CHCHD2 in DA neurons did display sex-specific changes to locomotor activity, but we did not observe differences in assays of muscle strength, exercise endurance or motor coordination. Furthermore, mitochondria derived from mice lacking CHCHD2 did not display abnormalities in OXPHOS function. Lastly, resilience to CHCHD2 deletion could not be explained by functional complementation by its paralog CHCHD10, as deletion of both CHCHD10 and CHCHD2 did not cause degeneration of DA neurons in the midbrain. These findings support the hypothesis that pathogenic CHCHD2 mutations cause PD through a toxic gain-of-function, rather than loss-of-function mechanism.
Introduction
Mutations in the mitochondrial protein PINK1, and the mitochondria-associated proteins Parkin and DJ-1, cause autosomal recessive forms of Parkinson’s disease (PD) (1–4), providing near-definitive evidence that deficits in mitochondrial function can cause PD. However, these familial forms of PD usually manifest at a younger age than sporadic PD, and most patients with Parkin mutations lack Lewy bodies, raising the possibility that their pathophysiology differs from sporadic PD (5).
The evidence for mitochondrial dysfunction causing sporadic PD was strengthened by the recent discovery that mutations in the mitochondrial protein coiled-coil-helix-coiled-coil-helix domain-containing protein 2 (CHCHD2) produce an autosomal dominant form of typical, levodopa-responsive PD, with extensive synuclein aggregation, including Lewy bodies and Lewy neurites (6,7). More than 20 variants of CHCHD2, mostly arising from missense mutations, have been putatively associated with PD (8), although the significance and pathogenicity of many of these variants are still unknown. The first two CHCHD2 missense mutations (T61I and R145Q) were reported in studies of Chinese and Japanese families with late-onset autosomal dominant PD (6,9,10). Several variants of CHCHD2 found in sporadic PD patients, mostly from Asian populations, are also predicted to be pathogenic. Many of them are in the predicted mitochondrial targeting sequence and the conserved helix domain of CHCHD2 and therefore could change its localization and function in mitochondria (8). Other mutations are in splice sites or non-coding regions and may reduce CHCHD2 expression (6). The T61I mutation is best established as being pathogenic, with studies in human cells and Drosophila showing that it can impair mitochondrial cristae structure and disrupt CHCHD2 localization, solubility and neuronal survival (7,11). Moreover, brain autopsy from a PD patient with the T61I mutation showed extensive α-synuclein pathology (7).
Nearly all PD-linked CHCHD2 mutations are heterozygous, suggesting that they may cause disease through the gain of a toxic function. However, in vitro studies have suggested that PD-linked mutations can lead to reduced solubility of CHCHD2, reduced CHCHD2 levels overall and abrogation of protective functions related to cellular stress response (12–14). Furthermore, Drosophila and Caenorhabditis elegans models expressing PD-linked variants or lacking their homolog of human CHCHD2 have similar defects (7,15). While these studies suggest that loss of normal CHCHD2 function may also play a role in disease, the translation of the results to humans is complicated by significant differences between the genetics of these species and mammals, and by the fact that in vivo studies on the effect of CHCHD2 loss in mammals are still limited.
CHCHD2 encodes a 151 amino acid protein localized in the mitochondrial intermembrane space (16). Primary amino acid sequence analysis reveals a positively charged N-terminal mitochondrial targeting sequence, a highly conserved hydrophobic α-helical region hypothesized to mediate mitochondrial inner membrane interactions, and two cysteine-x9-cysteine (Cx9C) motifs at the C-terminus. The latter enables oxidative folding of the protein and subsequent trapping in the intermembrane space (17,18). The primary functions of CHCHD2 remain poorly understood. Results from bioinformatics studies, cell culture models and invertebrate models suggest that it may be involved in modulating mitochondrial respiration, ATP production, mitochondrial morphology and multiple intracellular signaling events initiated within mitochondria (8). However, experiments using different model systems have shown discordant bioenergetics results; for example, some studies show that loss of CHCHD2 impairs mitochondrial respiration (11,19) while others demonstrate no change (20) or even enhanced respiration (21). These differences may be explained by differences in experimental systems and methods, and it remains to be tested whether in vivo loss of CHCHD2 affects mitochondrial bioenergetics in mammals. Furthermore, it is unknown which CHCHD2 functions are critical to its physiological role in the brain or contribute to PD pathophysiology.
Both mice and humans carry a CHCHD2 paralog, CHCHD10, and these two proteins have been found to interact (22,23). Interestingly, mutations in CHCHD10 cause an autosomal dominant form of frontotemporal dementia (FTD) and amyotrophic lateral sclerosis (ALS) (24,25), suggesting that the CHCHD2/D10 interaction may represent a point of convergence in the pathophysiology of PD and ALS/FTD. Evolutionary analyses, functional studies and genetic studies suggest that CHCHD2 and CHCHD10 may be at least partially functionally redundant or play similar roles in a common pathway (18), and it has been hypothesized that loss of one or the other protein may be compensated by its paralog (23,26–28). However, the role of CHCHD2/D10 interactions in the brain has not been investigated, and whether functional complementation by CHCHD10 can protect against the pathological consequences of CHCHD2 mutation, and vice versa, is unknown.
To study the normal requirement and functions of CHCHD2 in vivo, we investigated the effects of CHCHD2 ablation in three novel mouse models with either targeted deletion of CHCHD2 in DA neurons or deletion in the brain or total body and studied the impact of concurrent loss of CHCHD2 and CHCHD10. We find that loss of CHCHD2 is insufficient to cause PD-like disease, supporting the hypothesis that mutant CHCHD2 may act through a toxic gain of function.
Results
Midbrain dopamine neurons have higher levels of CHCHD2 and CHCHD10 than other neuron types
Mutations in CHCHD2 cause PD, which is defined by the preferential degeneration of midbrain dopamine (DA) neurons, suggesting that DA neurons may be particularly reliant on CHCHD2. To determine if midbrain DA neurons express higher levels of CHCHD2 than neurons in other brain regions, we performed immunofluorescence on brain sections isolated from 6- and 14-month-old wild-type (WT) mice. At both time points, CHCHD2 levels were higher in midbrain DA neurons than in cerebellar Purkinje or CA1 hippocampal neurons, or striatal cholinergic interneurons (Fig. 1A and B). Moreover, at both ages, levels of the CHCHD2 paralog CHCHD10 were similarly higher in midbrain DA neurons than in the other neuron types (Fig. 1C and D).
Figure 1.
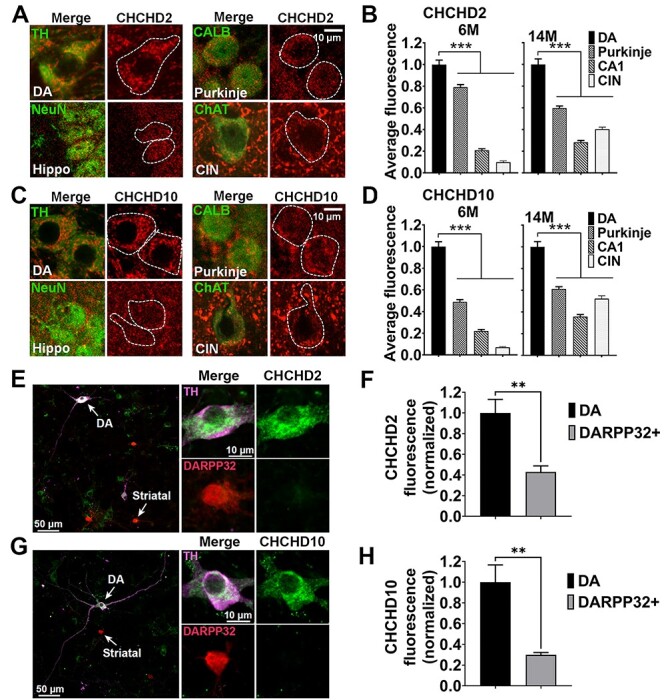
Midbrain DA neurons have higher levels of CHCHD2 and CHCHD10 relative to other neuronal types. (A–D) Representative immunofluorescence images (A, C) and relative quantitation (B, D) of CHCHD2 and CHCHD10 expression level in midbrain (VTA and SN) DA neurons (identified based by TH staining), Purkinje neurons [Calbindin 1 (CALB)], CA1 hippocampal neurons (NeuN) and striatal cholinergic interneurons [choline acetyltransferase (ChAT)] (CIN) in brain sections. The images are from 14-month-old WT mice. Scale bars are 10 μm. Quantifications are from 6-month-old and 14-month-old WT mice. Data show mean ± SEM; n = 57–150 (CHCHD2) and n = 63–145 (CHCHD10) cells per neuronal type from three mice per group (6-month-old); n = 95–155 (CHCHD2) and n = 92–151 (CHCHD10) cells per neuronal types from five mice per group (14-month-old). ***P < 0.001 by one-way ANOVA with Dunnett’s post hoc test. Scale bar is 10 μm. (E–H) Representative images (E, G) of co-cultured primary DA and striatal neurons immunostained for DARPP32 (red), TH (purple) and CHCHD2/CHCHD10 (green). The cell bodies identified by the arrows show DA and striatal neurons, respectively, and are enlarged in the upper right (DA) and lower right (striatal) panels. Scale bars are 50 μm (left panel) and 10 μm (right panels). TH+ neurons have higher levels of both CHCHD2 and CHCHD10 than DARPP32+ neurons do. Values are normalized to the mean cytosolic level in TH+ neurons (F, H). Data represent mean ± SEM. n = 4 coverslips/group, **P < 0.01 by unpaired two-tailed t-test.
To determine if substantia nigra pars compacta (SNc) DA neurons have intrinsically increased levels of CHCHD2 and CHCHD10, independent of their local in vivo environment and circuitry, we also examined CHCHD2 and CHCHD10 levels in SNc DA neurons grown in co-cultures with striatal target neurons. Indeed, CHCHD2 and CHCHD10 levels were both markedly increased in SNc DA versus DARPP32+ striatal neurons (Fig. 1E–H). These findings raise the possibility that DA neurons may be more reliant on CHCHD2 and CHCHD10 than other neuron types and thus more sensitive to mutations in those genes. Considering that aging is the strongest risk factor for PD, we also assessed if CHCHD2 and CHCHD10 protein levels change with age. However, no differences in CHCHD2 or CHCHD10 levels were found in isolated brain mitochondria at different ages (1 month, 6 months and 11 months old) (Supplementary Material, Fig. S1A and B).
Mice with CHCHD2 deleted from DA neurons show sex-specific hyperactivity but normal motor function and survival
To investigate the function and requirement of CHCHD2 specifically in DA neurons, we used a Cre-Lox/P strategy to ablate CHCHD2 in cells expressing the dopamine transporter (DAT, Slc6a3) (Fig. 2A and B). CHCHD2_DATcKO (CHCHD2lox/lox DATcre/wt) mice were then bred with CHCHD2lox/lox mice to create CHCHD2_DATcKO (CHCHD2lox/lox_DATcre/wt) and controls (CHCHD2lox/lox). Mice were born in roughly normal Mendelian proportions (control 46%, CHCHD2_DATcKO 54%, n = 50). CHCHD2_DATcKO mice had similar body weights compared to controls through 13 months of age (Fig. 2C) and normal survival through 14 months (Fig. 2D). Loss of CHCHD2 expression in midbrain DA neurons was confirmed in CHCHD2_DATcKO mice by immunofluorescence (Fig. 2E).
Figure 2.
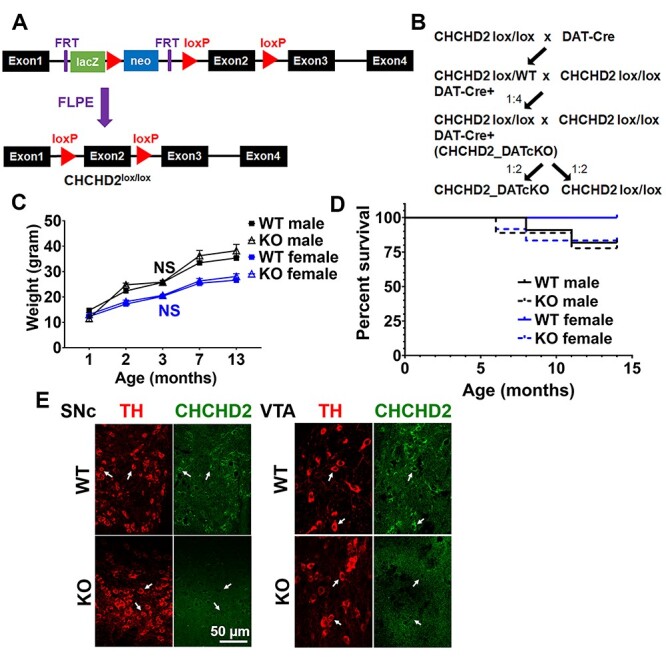
Mice with targeted CHCHD2 deletion in dopamine neurons are viable. (A) Generation of CHCHD2lox/lox mice. Genetically modified ES cells, with two flp recombination target (FRT) sites flanking the lacZ and neomycin cassette, together with loxP sites flanking exon 2 of CHCHD2, were injected into E3.5 blastocysts. The blastocysts were then transferred to pseudopregnant recipient females. The progenitors were crossed with FLPE mice to remove the lacZ-neomycin cassette and intercrossed to generate CHCHD2lox/lox mice. (B) CHCHD2lox/lox mice were crossed with DAT-Cre mice. Pups heterozygous for both DAT-Cre and floxed CHCHD2 were crossed again with CHCHD2lox/lox mice, and one quarter of the progenitors were CHCHD2lox/lox_DATCre/wt (CHCHD2_DATcKO) mice. CHCHD2_DATcKO mice were then crossed again with CHCHD2lox/lox mice to generate the mice used in experiments. (C) CHCHD2_DATcKO mice had similar body weights compared to controls through 13 months of age. Graph shows average mouse weights as a function of genotype and age. Data show means ± SEM, n = 17–28 mice for each genotype and sex. NS = not significant by one-way ANOVA with Tukey post hoc test. (D) Kaplan–Meier survival curve of CHCHD2_DATcKO and WT mice, separated by sex. CHCHD2_DATcKO mice had normal survival compared to controls through 14 months of age (Male: n = 11 WT or 9 KO, hazard ratio 0.7857, 95% confidence interval: 0.1091–5.658, P > 0.05; Female: n = 9 WT or 12 KO, hazard ratio 0.0, 95% confidence interval: −1.000 to −1.000, P > 0.05 by log-rank (Mantel–Cox) test). (E) Representative immunofluorescence images showing loss of CHCHD2 expression in midbrain DA neurons in CHCHD2_DATcKO mice. Scale bar is 50 μm.
To determine if CHCHD2 is required for normal DA neuron function, we first assessed the motor function of CHCHD2_DATcKO mice. Compared to controls, CHCHD2_DATcKO males and females had similar activity in the open field at 3 months; at 7 and 13 months, females showed increased total movement, and males had decreased total movement at 13 months (Fig. 3A). However, CHCHD2_DATcKO males and females both performed equally well on the rotarod (Fig. 3B) and inverted grid hang test (Fig. 3C) at all three time points, indicating that changes in open field locomotor activity were not due to abnormalities in motor function or strength.
Figure 3.
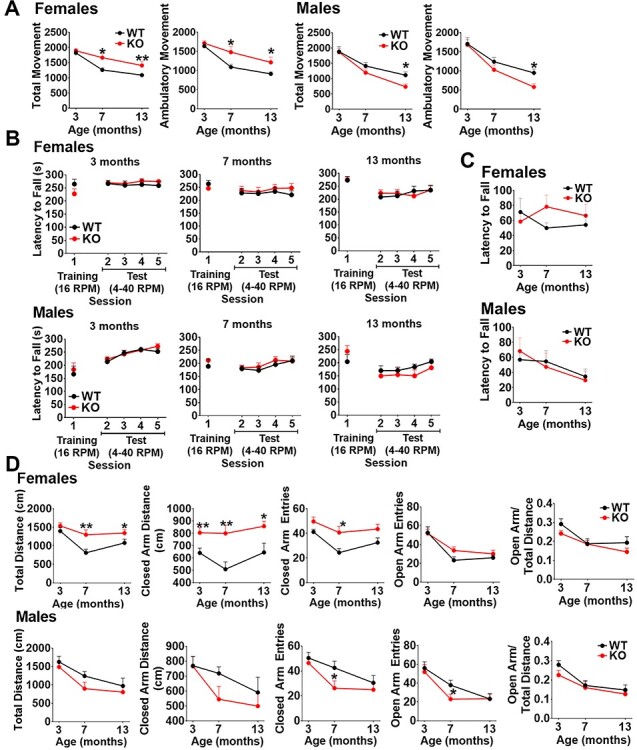
CHCHD2_DATcKO female mice are hyperactive but both sexes exhibit normal motor function and survival. (A) Open field locomotor activity: Movement was recorded over 15 min and calculated based on photobeam breaks. Ambulatory movement is defined as three beam breaks in succession. (B) Rotarod performance: Mice are given three practice trials on a fixed speed rotarod (16 rpm/5 min max), then placed on the accelerated rotarod test (4–40 rpm/5 min max). Two sessions of two accelerating trials were performed each day. The latency to fall off the rotarod was recorded. (C) Inverted Grid Hang: Grip strength was assessed using a wire grid turned upside down. The latency to fall off the wire grid was recorded. Mice are tested for a total of three trials with a 180 s cutoff time. (D) Elevated plus maze: Mice are placed in an elevated plus maze at the intersection of the open and closed arms and allowed to freely explore for 10 min. The total distance traveled in the open arms and closed arms and the number of arm entries are calculated based on infrared photobeam breaks. In all the tests, data show mean ± SEM, n = 9 control, 13 CHCHD2_DATcKO (female) or n = 11 control, 9 CHCHD2_DATcKO (male), *P < 0.05, **P < 0.01 by unpaired t-test with Welch’s correction.
To gain insight into the increased movement in the open field in CHCHD2_DATcKO female mice, we assessed their anxiety using the elevated plus maze (Fig. 3D). The open arm entries and open arm/total distance movement of CHCHD2_DATcKO females were similar to those of controls, indicating their hyperactivity is not caused by anxiety. However, the hyperactivity in the open field persisted. CHCHD2_DATcKO females demonstrated greater total distance travelled and increased distance and entries into the closed arm. In contrast, CHCHD2_DATcKO male mice had fewer open and closed arm entries at 7 months and decreased movement in the open field at 13 months, indicating they may be slightly hypoactive.
Deletion of CHCHD2 does not cause neurodegeneration or mitochondrial pathology in 14-month-old mice
To compare the requirement for CHCHD2 in different neuron types and brain regions, we also generated whole-brain CHCHD2 knockout mice using the same Cre-Lox/P approach to target the CHCHD2 deletion to cells expressing Nestin (Nes) (Supplementary Material, Fig. S2A), which includes all neural stem cells and intermediate neural progenitor cells from E12.5 (29–31). Similar to CHCHD2_DATcKO mice, CHCHD2_NEScKO mice were viable and born in roughly Mendelian proportions (control 43%, CHCHD2_NEScKO 57%, n = 48). Loss of CHCHD2 expression was confirmed in four neuron types by immunofluorescence and in total brain by western blot (Supplementary Material, Fig. S2B and C). In contrast, CHCHD2_NEScKO mice had normal levels of CHCHD2 in the liver (Supplementary Material, Fig. S2C), and the levels of CHCHD10 in the brain were unchanged (Supplementary Material, Fig. S2D).
We next assessed how CHCHD2 deletion in the brain affects the viability of neurons within the nigrostriatal and mesolimbic pathways of 14-month-old mice. We first assessed the integrity of DA terminals by measuring the optical density of tyrosine hydroxylase (TH) immunostaining and found no difference between CHCHD2_NSEcKO mice and controls (Fig. 4A). There was also no loss of midbrain DA neurons in CHCHD2_DATcKO mice, as assessed by stereology to quantify the survival of DA neurons in the SNc (Fig. 4B). Consistent with the integrity of the nigrostriatal pathway, levels of striatal DA and DA metabolites were also unchanged in CHCHD2_NEScKOmice (Fig. 4C). As a recent study showed DA neuron loss in CHCHD2 knockout mice aged ~2.3 years (32), we also assessed the integrity of DA neurons at older age. We found no difference in either striatal optical density or cell body morphology in either CHCHD2_DATcKO mice at 16 months or CHCHD2_NEScKO mice at 19 months relative to controls (Supplementary Material, Fig. S3).
Figure 4.
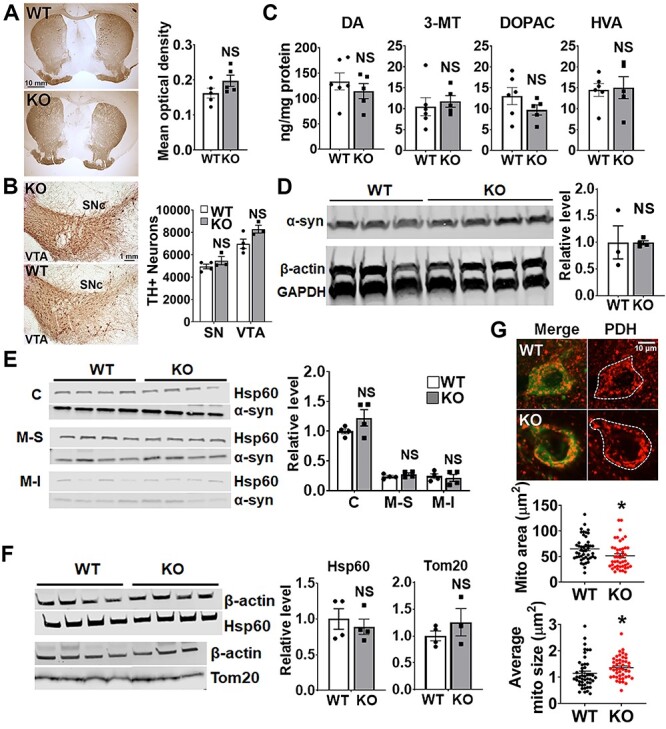
Deletion of CHCHD2 in DA neurons or the whole brain does not cause neurodegeneration at 14 months. (A) Representative images of TH staining of brain sections from 14-month-old control and CHCHD2_NEScKO mice. Striatal terminals are preserved in CHCHD2_NEScKO versus control mouse brains. Graph shows quantification of TH+ optical density in the caudate putamen (CPu). Scale bar is 10 mm. Data show mean ± SEM, n = 5 mice per group from 5-9 striatal sections per animal, NS = not significant by unpaired t-test with Welch’s correction. (B) Representative images of TH staining of brain sections from 14-month-old control and CHCHD2_DATcKO mice. DA neuron cell bodies in the SNc and VTA (right) are preserved in CHCHD2_DATcKO versus control mouse brains. Scale bar is 1 mm. Quantification of TH+ neuron number by stereology (right). n = 4 control and 3 CHCHD2_DATcKO, NS = not significant by unpaired t-test with Welch’s correction. (C) HPLC of CPu dissected from fresh-frozen brain tissues from 14-month-old mice shows no change in DA in CHCHD2-NEScKO mice. n = 5–6 mice per group, NS = not significant by unpaired t-test with Welch’s correction. (D) Representative western blot shows that total α-synuclein level is similar in 14-month-old CHCHD2_NEScKO and control mouse brains. α-synuclein levels are normalized to GAPDH level from the same sample. n = 3–4 mice per group, NS by unpaired t-test with Welch’s correction. (E) Western blot of total α-synuclein level in different fractions extracted from 14-month-old CHCHD2_NEScKO and control mouse brains. C, cytosol; M-S, mitochondrial soluble fraction; M-I, mitochondrial insoluble fraction. n = 4 mice per group; NS versus respective control by two-way ANOVA with Sidak post hoc test. (F) Hsp60 (mitochondrial matrix protein) and Tom20 (mitochondrial outer membrane protein) protein levels are similar in 14-month-old CHCHD2_NEScKO and control mouse brains. n = 3–4 mice per group, NS by unpaired t-test with Welch’s correction. (G) Immunofluorescence images and quantitation of average mitochondrial size and content in cell bodies of DA neurons from 14-month-old CHCHD2_NEScKO mice and controls. Mitochondria are identified by PDH (red) and DA neurons are identified by TH (green). n = 45 cells per group, from 2–3 brain slices per animal and 3 animals per group), *P < 0.05 by unpaired t-test with Welch’s correction. Data show mean ± SEM. Scale bar is 10 μm.
Neuropathology from a patient with familial PD due to mutation in CHCHD2 showed prominent, widespread α-synuclein aggregation in the brain (7). Therefore, we next examined if CHCHD2 normally influences α-synuclein levels. However, the brains from 14-month-old CHCHD2_NEScKO mice had similar levels of total α-synuclein levels to controls as determined by western blot (Fig. 4D). Since a fraction of α-synuclein binds to mitochondria (33,34) and α-synuclein aggregates may have particularly high affinity for mitochondria (35), we also looked at α-synuclein levels specifically in mitochondrial soluble and insoluble protein fractions (Fig. 4E). However, we did not detect an increase in α-synuclein in either mitochondrial fraction in CHCHD2_NEScKO mice.
CHCHD2 localizes to the mitochondrial intermembrane space, can regulate mitochondrial morphology and cristae structure (27,36) and might also influence mitochondrial content. However, CHCHD2_NEScKO and control brain lysates had similar levels of both Tom20 (translocase of the outer mitochondrial membrane) and Hsp60 (Heat shock protein 60, located in the mitochondrial matrix) by western blot (Fig. 4F), suggesting that CHCHD2 deletion did not significantly impact the overall content of mitochondria in the brain.
Interestingly, DA neurons in CHCHD2_NEScKO mice had slightly larger mitochondria, but slightly lower mitochondrial content than control neurons, as assessed by immunofluorescence against the mitochondrial matrix protein pyruvate dehydrogenase (PDH) (Fig. 4G).
Whole-body CHCHD2 deletion does not impair motor function
Our findings that CHCHD2_DATcKO mice have grossly normal motor function and survival, and that CHCHD2_NEScKO mice do not show evidence of neurodegeneration, raise the possibility that non-neuronal effects of CHCHD2 loss might contribute to the development of motor impairments in PD patients. To assess this possibility, we generated mice with total body CHCHD2 knockout by crossing CHCHD2lox/lox mice to hemizygous female Edil3Tg(Sox2-cre)1Amc/J mice (37) to delete one CHCHD2 allele in epiblast cells at embryonic day 6.5 (CHCHD2+/−). CHCHD2+/− males were then bred with CHCHD2+/− females to generate CHCHD2−/− (CHCHD2KO) mice and their WT littermate controls (CHCHD2+/+) (Fig. 5A). We confirmed total body deletion of CHCHD2 genetically using both traditional PCR-based and TaqMan Assay-based genotyping methods on tail biopsies (data not shown). We then assessed CHCHD2 expression in mitochondrial fractions from tissues known to express high levels of CHCHD2 (brain, heart and skeletal muscle) by western blot. As expected, we observed a complete absence of CHCHD2 in all three tissues of CHCHD2KO mice (Fig. 5B). CHCHD2KO mice were viable and born at normal Mendelian ratios (WT/WT 21%, WT/KO 57%, KO/KO 22%, n = 138). We assessed mean body weight over time and survival up to 11 months of age and found no differences in either parameter between CHCHD2KO mice and their WT littermates (Fig. 5C and D).
Figure 5.
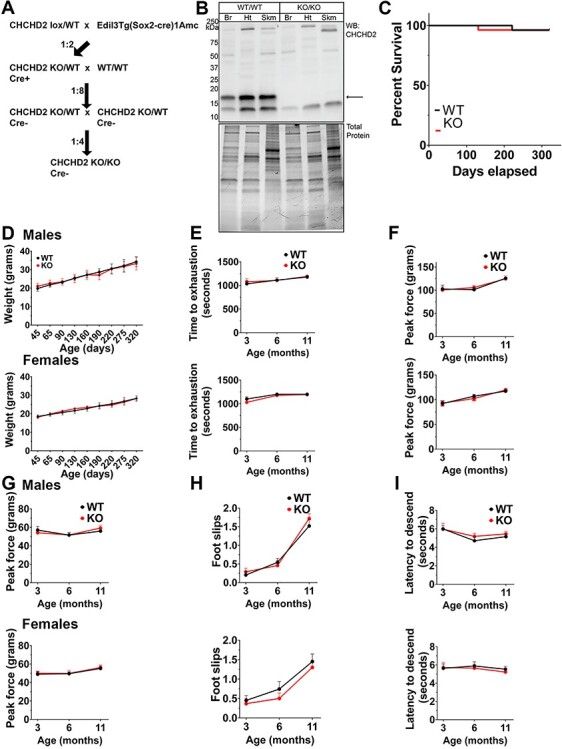
Whole-body CHCHD2 deletion does not disrupt motor function in vivo. (A) Breeding schematic for creation of CHCHD2 whole body knockouts. Exon 2-floxed mice were bred with hemizygous Sox2-Cre transgenics to generate a whole body CHCHD2 knockout. CHCHD2 heterozygotes were backcrossed to WT mice to remove the Cre allele before crossing heterozygotes to generate homozygous CHCHD2 knockouts and WT littermate controls. (B) Top: Full-length western blot showing CHCHD2 in mitochondria-enriched fractions from whole brain (Br), heart (Ht) or skeletal muscle (Skm; gastrocnemius). Bottom: Total protein stain serves as the loading control. (C) Kaplan–Meier survival probability plot of CHCHD2KO and WT controls up to 1 year of age. n = 20. Survival curves were compared by Mantel–Cox test and Gehan–Breslow–Wilcoxon test. (D) Mean weight in grams of CHCHD2KO and WT controls over time. Top: Males. Bottom: Females. n = 8 per sex, per group. (E) Treadmill running endurance of CHCHD2KO and WT controls over time. Top: Males. Bottom: Females. n = 8 per sex, per group. (F, G) Muscle strength of CHCHD2KO and WT controls over time measured by digital grip strength meter for forelimb (F) and hind limb (G). Top: Males. Bottom: Females. n = 8 per sex, per group. (H) Horizontal balance beam assay of CHCHD2KO and WT controls over time. The number of foot slips as the mice traverse a narrow beam is recorded. Top: Males. Bottom: Females. n = 8 per sex, per group. (I) Vertical beam descending climbing assay of CHCHD2KO and WT controls over time. The time to reach the bottom of a vertical beam is recorded. Top: Males. Bottom: Females. n = 8 per sex, per group. For B–I: Error bars show ± SEM. Significance testing by Student’s t-test. n = 8.
To determine whether whole-body deletion of CHCHD2 causes motor abnormalities, we conducted a panel of motor tests at 3, 7 and 11 months of age. Specifically, we measured exercise endurance by treadmill exhaustion test (Fig. 5E), muscle strength by tests of hindlimb and forelimb grip strength using a digital force meter (Fig. 5F and G), and fine motor coordination by horizontal balance beam and vertical pole climbing assays (Fig. 5H and I). CHCHD2KO mice did not show any deficits in these tests compared to controls, at any time point. These results indicate that up to 11 months of age, CHCHD2KO mice do not display gross motor impairments or motor impairments commonly observed in other mouse models of PD and mitochondrial myopathies.
CHCHD2 deletion does not impair mitochondrial OXPHOS function in brain mitochondria
We next asked whether whole-body CHCHD2 deletion had any effect on mitochondrial measures of oxidative phosphorylation (OXPHOS). We extracted mitochondrial-enriched fractions from homogenized brains of CHCHD2KO and control mice at 11 months of age and quantified oxygen consumption rate (OCR) (Fig. 6A–C), ATP synthesis rate (Fig. 6D) and reactive oxygen species production rate (Fig. 6F and G). Mean State III OCR was unchanged in CHCHD2KO mice versus controls (Fig. 6B). Similarly, state IVo OCR measured in the presence of the ATP synthase inhibitor oligomycin was unchanged between CHCHD2KO and controls (Fig. 6B). We then measured maximal respiration (State IIIu) using a titrated dose of the uncoupler SF-6847. We found no differences in State IIIu activity between CHCHD2KO and WT mice (Fig. 6B). Next, we assessed respiratory control ratio (the increase in respiration in response to ATP) by calculating State III/state IVo and found no differences between CHCHD2KO mice and controls (Fig. 6C). ATP synthesis rate was measured by luciferase–luciferin-based assay under similar conditions as State III OCR, and there were no differences between genotypes (Fig. 6D). We then assessed the P/O ratio by calculating ATP synthesis rate/State III OCR and found no differences (Fig. 6E). Lastly, we measured complex-II stimulated hydrogen peroxide (H2O2) production in the presence of 5 mm succinate and 2 mm glutamate. There were no differences in H2O2 production between CHCHD2KO mice and controls (Fig. 6G). Taken together, these results indicate that CHCHD2 deletion does not impair overall OXPHOS function in mouse brain, suggesting that CHCHD2 is not essential for OXPHOS function in this context.
Figure 6.

CHCHD2 deletion does not impair mitochondrial OXPHOS function in brain mitochondria. (A) Representative oxygraph traces on brain-derived mitochondria-enriched fractions. Labels denote the sequentially added substrates. ADP = 200 nm adenosine diphosphate; Omy = 2 nm oligomycin; SF = 8 nm SF-6847; KCN = 1 mm potassium cyanide. (B) Quantification of OCRs of brain-derived mitochondria-enriched fractions. Rates shown for respiration after addition of ADP (high substrate, coupled/State III), oligomycin (leak/state IVo) and SF-6847 (uncoupled/State IIIu). Dots represent individual mice, error bars = SEM, significance testing by Student’s t-test. n = 4. State III, P = 0.753; State IV0,P = 0.845; State IIIu, P = 0.603. (C) Respiratory control ratio of brain-derived mitochondria-enriched fractions. RCR = State III/State IIIu. Dots represent individual mice, error bars = SEM, significance testing by Student’s t-test. n = 4. P = 0.923. (D) ATP synthesis rates from brain-derived mitochondria-enriched fractions. Dots represent individual mice, error bars = SEM, significance testing by Student’s t-test. n = 5. P = 0.942. (E) P/O ratio of brain-derived mitochondria-enriched fractions. P/O ratio = ATP synthesis rate/OCR. Dots represent individual mice, error bars = SEM, significance testing by Student’s t-test. n = 4. P = 0.557. (F) Representative traces from ROS production assay. Labels denote the sequentially added substrates. Succ, succinate; ADP, adenosine diphosphate; Omy, oligomycin; Rot, rotenone; Ama, antimycin A. (G) Hydrogen peroxide production rate of mitochondria fractions from whole brain. Dots represent individual mice, error bars = SEM, significance testing by Student’s t-test. n = 4. P = 0.275. (H) Quantification of mitochondrial membrane potential (TMRM) of mitochondria in CHCHD2 KO hippocampal neurons before and after the sequential addition of oligomycin (5 μm, 5 min) and FCCP (10 μm, 5 min). TMRM fluorescence was not affected by oligomycin, but markedly decreased by FCCP. n = 84 (control) and 117 (KO) cells from 11 coverslips per group, three experiments. NS = not significant; ***P < 0.001, by two-way ANOVA with Tukey post hoc test. Data show mean ± SEM. (I) FRET emission in synaptic boutons of CHCHD2KO hippocampal neurons expressing the ATP FRET sensor and subjected to electical field stimulation (5 Hz for 7 min, blue bar). Simultaneously inhibiting glycolysis with 2-deoxy-d-glucose (2DG, 5 mm) and iodoacetate (IA, 1 mm) (orange bar) rapidly decreases ATP levels. NS = not significant by two-way ANOVA with Sidak post hoc test; n = 8 (control) and 11 (KO) coverslips, 2–8 boutons per coverslip, from two experiments. Data show mean ± SEM. (J) Quantification of CHCHD2KO hippocampal neurons expressing mitoKeima. CHCHD2KO and control mitochondria have similar fluorescence in the acidic, lysosomal (FLlyso) versus mitochondrial (FLmito) channel. NS = not significant by unpaired t-test, n = 30 cells from two coverslips per group. Data show mean ± SEM.
Next, we assessed whether loss of CHCHD2 affects mitochondrial bioenergetics in cultured neurons. First, we examined mitochondrial membrane potential by tetramethylrhodamine methyl ester (TMRM) fluorescence before and after treatment with FCCP (38). CHCHD2KO neurons had similar basal mitochondrial membrane potential to controls and maintained their membrane potential even after treatment with oligomycin (Fig. 6H), indicating that membrane potential was not supported by reversal of the mitochondrial ATPase with ATP hydrolysis (39). We then assessed if CHCHD2 is required to maintain mitochondrial-derived ATP levels in individual hippocampal neurons, focusing on synaptic boutons, which are particularly vulnerable to energy failure (40–42). CHCHD2lox/lox neurons were co-transfected with either Cre or empty vector, and an fluorescence resonance energy transfer (ATP-FRET) sensor made of the ε subunit of the bacterial F0F1-ATP synthase (an ATP-binding protein) flanked by mApple and mClover (43,44). In this setting, we found that CHCHD2 loss had no impact on ATP levels in the presence of glucose and pyruvate, where cells could derive ATP from both glycolysis and OXPHOS. In addition, even under respiratory conditions where all ATP comes from OXPHOS [pyruvate with 2-deoxy-d-glucose (2DG) and iodoacetate to block glycolysis], ATP levels dropped at a similar rate in synaptic boutons of both control and CHCHD2KO neurons during sustained electrical field stimulation (5 Hz, 7 min), used to increase energy requirements (45) (Fig. 6I). In agreement with the results from isolated mitochondria, these data indicate that CHCHD2 is not required to maintain mitochondrial-derived ATP levels in neurons and suggest that CHCHD2KO neurons maintain normal respiration.
Lastly, we assessed mitochondrial turnover to determine if mitochondrial defects might be masked by an upregulation of mitochondrial quality control mechanisms. However, mitochondrial targeting to lysosomes, as assessed by measurement of mitochondrial acidification using the pH-sensitive, mitochondria-targeted Keima probe (mtKeima) (46), was not different between genotypes (Fig. 6J). Taken together, these results suggest that CHCHD2KO does not adversely impact mitochondrial respiratory function or alter mitochondrial turnover.
CHCHD2 and CHCHD10 are dispensable for DA neuron viability in vivo
As loss of CHCHD2 did not cause detectable pathology within the midbrain of mice up to 19 months of age and did not impair bioenergetics in mouse neurons or isolated brain mitochondria, we hypothesized that its paralog, CHCHD10, may functionally compensate for CHCHD2 loss. However, we found no differences in CHCHD10 expression levels between CHCHD2KO mice and controls by western blot in whole-brain mitochondrial fractions (Fig. 7A and B). Similarly, deletion of CHCHD2 in the brain in CHCHD2_NEScKO mice had no impact on CHCHD10 levels in individual DA, hippocampal, Purkinje or cholinergic interneurons, as assessed by immunofluorescence (Fig. 7C).
Figure 7.
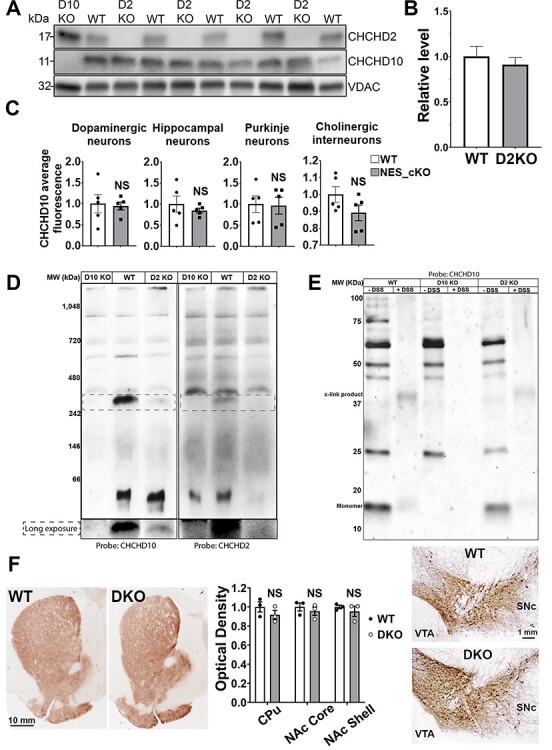
Both CHCHD2 and CHCHD10 are dispensable for DA neuron viability in vivo. (A) Western blot of CHCHD10 levels in CHCHD2KO mice versus WT controls. Samples were prepared using isolated mitochondria from whole brain homogenates. CHCHD10KO samples were used as a negative control for blotting. VDAC levels were used to control for mitochondrial loading. (B) Quantification of (A). CHCHD10 levels were normalized to VDAC and expressed as relative difference from WT control. Densitometry was performed using ImageJ gel analysis functions. Error bars = SEM. Significance testing by Student’s t-test. n = 4–5 mice per group. (C) Quantification of CHCHD10 expression level in DA neurons, Purkinje neurons, hippocampal neurons and striatal cholinergic interneurons in brain sections from 14-month old CHCHD2_NEScKO and control mice. Data shows mean ± SEM (NS = not significant by unpaired t-test with Welch’s correction; average of 118–186 cells per neuronal types, n = 5 mice per group). (D) NativePAGE immunoblot of CHCHD10 knockout, WT and CHCHD2 knockout mitochondrial samples from whole brain homogenates. Molecular weight is inferred using the NativeMark protein ladder standard. Left: Probed with and antibody against CHCHD10. Right: Stripped and re-probed with an antibody against CHCHD2. (E) Western blot of mitochondrial fractions incubated with cross-linking agents prior to lysis. WT and CHCHD2 knockout samples incubated with lipid soluble DSS are compared. Cross-linked complexes containing CHCHD10 found in WT samples are also present in CHCHD2 knockout samples. (F) Representative images and quantification of TH staining of brain sections from control and CHCHD2/CHCHD10 double knockout mice. Striatal terminals in the caudate putamen (CPu), and nucleus accumbens (NAc) core and shell (left montage), and DA neuron cell bodies in the SNc and VTA (right montage) are preserved in 13-month-old mice CHCHD2/CHCHD10 DKO versus control mouse brains. Quantitation of striatal OD (middle graph), data shows mean ± SEM, n = 3 mice per group, NS = not significant by unpaired t-test with Welch’s correction (optical density). Scale bars are 10 mm (left) and 1 mm (right).
As CHCHD2 and CHCHD10 are known to interact and have been found to migrate together in higher molecular weight assemblies (26), we next queried the higher molecular weight assemblies of CHCHD2 and CHCHD10, to determine whether the absence of CHCHD2 affects CHCHD10 localization to these complexes or whether any unique assemblies containing CHCHD10 may be observed in the absence of CHCHD2. First, we separated mitochondrial fractions from 320-day mouse brains via native-PAGE and immunoblotted with either CHCHD10 or CHCHD2 antibodies. In WT samples, we observed a specific complex of ~330 kDa that is recognized by both CHCHD10 and CHCHD2 antibodies. Intriguingly, this complex was not detected in CHCHD10KO samples and was present at lower levels in CHCHD2KO samples (Fig. 7D). We did not observe any new CHCHD10-containing assemblies in CHCHD2KO samples compared to WT. These results suggest that in the absence of CHCHD2, CHCHD10 does not maintain any higher molecular weight assemblies at WT levels and does not localize in abundance to any additional complexes. Next, to further examine CHCHD10-containing complexes, we subjected intact, enriched mitochondria to DSS crosslinking prior to RIPA lysis, SDS-PAGE, and immunoblotting (Fig. 7E). Incubation with DSS yielded a CHCHD10-containing band of ~37 kDa that was present in both CHCHD2KO and control samples. We did not detect any CHCHD10-containing assemblies that were present in CHCHD2KO samples but not in control samples, and we did not detect any upregulation of CHCHD10-containing complexes. Taken together, these results do not suggest any unique compensatory regulation of CHCHD10 levels, or its higher molecular weight assemblies, in the absence of CHCHD2. One possible explanation is that normal levels of CHCHD10 are sufficient to functionally compensate for the loss of CHCHD2.
To test this hypothesis, we crossed CHCHD2KO mice to CHCHD10KO mice to generate whole-body double-KO mice (CHCHD2/D10KO) and assessed the integrity of DA terminals at 13–14 months of age. However, there was no difference in the optical density of TH immunostaining in the striatum between CHCHD2/D10KO and WT controls, indicating that the DA terminals in the striatum are intact (Fig. 7F). Consistent with this finding, DA cell bodies in the SN and VTA were also grossly unchanged from controls. Taken together, these results suggest that CHCHD2 is not essential for DA neuron viability within the mouse nigrostriatal pathway and that functional complementation by CHCHD10 is not required to maintain neuronal viability.
Discussion
A key question for understanding the role of CHCHD2 in disease is whether mutations of CHCHD2 produce PD due to loss of normal function. Our finding that DA neurons have particularly high levels of CHCHD2 versus other neuron types might suggest that DA neurons have a greater requirement for CHCHD2 and hence might be particularly vulnerable to loss of CHCHD2 function. This led us to hypothesize that loss of CHCHD2 would be deleterious for midbrain function. However, we found no adverse impact of CHCHD2 genetic ablation on motor function through 12 months of age or on mouse survival or the number of nigrostriatal DA neurons up to at least 14 months of age. Moreover, there was no loss of DA terminals in the striatum through 19 months of age. Loss of DA terminals in the striatum is a sensitive indicator of DA neuron degeneration that precedes DA neuron death in PD and in mouse models of PD (47,48). Therefore, our findings do not support a loss-of-function mechanism in human CHCHD2 PD. Nevertheless, they cannot exclude this possibility: mice and humans may have different requirements for CHCHD2, and the toxic effects of CHCHD2 loss may require a second hit (49) or a longer time to develop in mice. Notably, a recent study found that CHCHD2KO mice developed increased hindlimb slips and a subtle decrease in latency to fall from rotarod starting at ~2.3 years of age. The motor changes were accompanied by a mild decrease in the number of TH+ neurons, specifically in the central (but not lateral) aspect of the SN. However, the neuronal loss was only observed at an extremely advanced age within the mouse lifespan, at which point ~50% of both control and CHCHD2 KO mice had already died (32). Further investigation is required to assess the impact of CHCHD2 loss in aged animals, while also considering the alternative possibility that PD mutants produce disease through either a toxic gain of function or dominant negative function (12). Interestingly, CHCHD10 KO mice also fail to exhibit morbidity by 1 year of age (23), whereas mice harboring CHCHD10 point mutants exhibit disease phenotypes at an early age that are uniformly lethal by 13 months (50). Thus, these findings suggest that mutant CHCHD10 produces toxicity through a toxic gain-of-function mechanism and that CHCHD2 mutations may behave similarly.
We also failed to observe accumulation of total soluble and insoluble α-synuclein in CHCHD2KO mice, in contrast to the extensive accumulation of aggregated α-synuclein in a patient with a T61I CHCHD2 mutation, and unlike the accumulation of soluble and insoluble α-synuclein observed in a Drosophila KO model (7). CHCHD2 and α-synuclein may have a reciprocal interaction, since increased α-synuclein decreases CHCHD2 levels in mice, and CHCHD2 levels are also decreased in SN DA neurons in sporadic PD patients (51). However, while these observations could suggest that increased α-synuclein produces toxicity by decreasing CHCHD2 levels, our findings in CHCHD2KO mice do not support this hypothesis.
There are multiple lines of evidence indicating that mitochondrial dysfunction is a key pathogenic mechanism in PD, and it seems likely that different mitochondrial insults associated with PD converge to disrupt specific mitochondrial pathways, in particular OXPHOS and mitochondrial quality control (52,53). Although CHCHD2 has been reported to be required for respiration in HEK 293 cells and in Drosophila (11,16), we found no impact of CHCHD2 deletion on ATP production in brain mitochondria or in individual neurons, including at the synapse. Since the physiological function of CHCHD2 remains largely unknown, further investigation is required to dissect whether CHCHD2 simply does not contribute to these key mitochondrial functions implicated in PD pathogenesis, or if other proteins compensate for the loss of CHCHD2 in neurons. It is likely that CHCHD10 can compensate for the loss of CHCHD2 in some tissues, as double CHCHD10 and CHCHD2 KO in mice lead to mitochondrial abnormalities in the heart (20). However, we found that concurrent loss of CHCHD2 and CHCHD10 fails to disrupt the integrity of DA neurons. The finding that DA neurons express high levels of CHCHD10 and that CHCHD2 and CHCHD10 coexist in multi-protein complexes in these cells does suggest an important role for CHCHD2–10 interaction, although additional research is required to elucidate these functions.
In summary, our findings in mice suggest that haploinsufficiency or dominant negative mechanisms are unlikely to be the cause of disease in PD patients with heterozygous CHCHD2 mutations. Instead, we propose that gain of toxic functions, like those shown for CHCHD10 mutants (50), could underlie the mitochondrial damage and DA neuron pathology in these genetic forms of PD. The higher expression of CHCHD2 in DA neurons, relative to other neuronal populations, could in fact make these neurons more susceptible to the toxicity of the mutant protein. This hypothesis will have to be tested directly in vivo in mice expressing mutant CHCHD2, but if correct it would support the development of therapeutic strategies to downregulate the expression of CHCHD2 in affected DA neurons, either genetically (e.g. with antisense oligonucleotides) or pharmacologically.
Materials and Methods
Animals
CHCHD2 lox/lox mice were generated using EUCOMM’s conditional-ready embryonic stem (ES) cells. Two flippase recognition target (FRT) sites (one upstream of the lacZ gene and one downstream of the neomycin-resistance gene) and three loxP sites (one between the lacZ and neomycin-resistance genes, and the others immediately before and after exon 2) are inserted in the CHCHD2 allele (targeted mutation 1a—tm1a). ES cells were injected to blastocysts and then transferred to recipient females. Tm1a mice were then crossed with FLPE mice that express FLP1 recombinase under the β-actin promoter (B6.Cg-Tg(ACTFLPe)9205Dym/J; Jackson Laboratory #005703) to remove the FRT-flanked region and restore CHCHD2 expression. Mice carrying this allele are referred to as tm1c or ‘floxed’ mice. Crossing floxed mice to Cre-expressing mice removes exon 2 of CHCHD2, causing a loss of protein expression.
To generate DA neuron-specific CHCHD2_DATcKO mice, CHCHD2lox/lox mice were crossed with DATCre/Cre transgenic mice that express Cre recombinase under the control of the DAT promoter (B6.SJL-Slc6a3tm1.1(cre)Bkmn/J; Jackson Laboratory #006660). The progenitors (CHCHD2lox/wt; DATcre/wt) were then backcrossed with CHCHD2lox/lox mice to generate CHCHD2lox/lox; DATcre/wt (CHCHD2_DATcKO) mice. To generate mice lacking CHCHD2 in the brain (CHCHD2_NEScKO mice), CHCHD2lox/lox mice were crossed with Nestin-Cre transgenic mice (B6.Cg-Tg (Nes-cre)1Kln/J; Jackson Laboratory #003771), expressing Cre recombinase under the control of the Nestin promoter. The progeny (CHCHD2lox/wt;NestinCre/wt) was then backcrossed with CHCHD2lox/lox mice to generate CHCHD2lox/lox;NestinCre/wt (CHCHD2_NEScKO) mice.
CHCHD2KO mice (total body deletion of CHCHD2) were generated by crossing male CHCHD2lox/lox mice to hemizygous female Edil3Tg(Sox2-cre)1Amc/J mice (Jackson Laboratory Stock #008454) to obtain mice with one copy of CHCHD2 deleted (CHCHD2+/−) in all cells after embryonic day 6.5. CHCHD2+/− mice were inbred to generate CHCHD2−/− (CHCHD2KO) mice.
Mice were group-housed in a colony maintained with a standard 12 h light/dark cycle and given food and water ad libitum. Experiments were conducted according to the Guidelines for the Care and Use of Laboratory Animals, as adopted by the National Institutes of Health, and with approval of the University of California, San Francisco, Institutional Animal Care and Use Committee (CHCHD2lox/lox, CHCHD2_DATcKO and CHCHD2_NEScKO) and the Weill Cornell Medicine Animal Care and Use Committee (CHCHD2KO, CHCHD10KO and CHCHD2/D10KO mice).
Genotyping
For CHCHD2lox/lox genotyping: PCR amplification was done using primer pair 5′ arm (5′-CGTTACTGCTTCCTGAGTGTGCAC-3′) and 3′ arm (5′-GTGCTCCTGCTTCCGAATTAGTTGC-3). A product size of 419 bp was obtained for the WT allele and 650 bp for the floxed allele. For DAT-Cre and Nestin-Cre genotyping, Cre-recombinase (100 bp) was detected using primer pair olMR1084 (5′-GCGGTCTGGCAGTAAAAACTATC-3′) and olMR1085 (5′-GTGAAACAGCATTGCTGTCACTT-3′), together with internal control (324 bp) detected using primer pair olMR7338 (5′-CTAGGCCACAGAATTGAAAGATCT-3′) and olMR7339 (5′-GTAGGTGGAAATTCTAGCATCATCC-3′). For CHCHD2KO, TaqMan assay primers used: WT fwd (5′-ATCACTGTATAGAGCAAGGATGAGAGT-3′); WT rev (5′-GAGGTCTGTGGACTTTTCACTGT-3′); WT reporter (5′-ACAGCACAGTACAGTTTG-3′); KO fwd (5′-GCGCCGGAACCGAAGT-3′); KO rev (5′-GACCACTCTATGTGGCTTTGTGT-3′); KO reporter (5’-ATGCTCCCATGATGAACTG-3′). For CHCHD10KO, TaqMan assay primers used: fwd (5′-CTTGTTTCTCTCCTCTTGCTTCCT-3′); rev (5′-GCTGAGGGTGGTGGGT-3′); reporter 1 (5′-CCGCCCAGCCCCG-3′); reporter 2 (5′-CGCCCAAGCCCCG-3′).
Behavioral testing
General locomotor activity was measured by the open field test, using standard procedures, as previously described (54). Mice are placed in the center of the activity chamber and allowed to explore freely for 15 min. The chamber detects horizontal and vertical movement. The chambers are located inside sound and light attenuating shells so that their spontaneous locomotor activity is not affected by external stimuli. Ambulatory and fine movements are recorded separately. Fine movements are defined as breaking the same two beams repeatedly, while ambulatory movements are defined as having broken three or more consecutive photobeams.
Anxiety-related locomotion was measured using an elevated plus maze (Kinder Scientific) as previously described (55). Briefly, mice are placed on a maze at the intersection of open and closed arms and allowed to explore the maze freely for 10 min. The total distance traveled in the closed arms and the number of closed arm entries are calculated based on infrared photobeam breaks.
Muscle strength was measured by the inverted grid hang and grip strength test. For the inverted grid hang assay, each mouse was first placed with all four paws firmly grasping on a wire grid. The grid was then carefully inverted so that the mouse is hanging over a cage filled with bedding. The latency to fall was recorded. The maximum latency is 180 s. Mice are tested for a total of three trials, with 1 h between each trial. For grip strength, forelimb and hindlimb grip strength was measured via a digital force meter (Columbus Instruments 1027SM) attached to a triangular pull bar. Briefly, each mouse was allowed to grab on to the pull bar with both paws. After establishing an even grip, mice are pulled in a straight line away from the pull bar and the force applied by the mouse while being pulled away was recorded. For each data point, three trials were performed, and the peak value was retained.
Motor coordination on a moving apparatus was measured using a rotarod (Med Associates Inc., Vermont, USA) as previously described (56). The apparatus is equipped with infrared beams that automatically detect when the mouse has fallen off the rotating rod. On the first day (training), up to five mice of the same sex are simultaneously placed on the rotarod apparatus with the rod already rotating at the constant speed of 16 rpm (rotations per minute). The trial ends when the mouse falls off the rod or when 5 min has elapsed. The mice are tested on three individual trials with an inter-trial interval between 15 and 20 min. On the second and third day of testing, five mice of the same sex are simultaneously placed on the rotarod apparatus with the rod rotating at an accelerated speed, from 4 to 40 rpm. The rotation speed increases by 4 rpm every 30 s. The trial ends when the mouse falls off the rod or when 5 min have elapsed. The mice are given two sessions of three trials for the 3-month group and two sessions of two trials for the 7- and 13-month-old mice. The 3-month-old mice had six trials total and the 7- and 13-month groups had four trials total. The intertrial interval is between 15 and 20 min, and there is a 2h interval between the AM and PM sessions.
Motor coordination on a static apparatus was assessed using a horizontal balance beam assay. Mice were coaxed to traverse an elevated acrylic beam of ½ inch diameter and 2 feet in length. On one side of the beam is an open platform and on the other end is a covered escape box. Mice were initially trained to traverse the beam with two assisted trials. To assess motor coordination, mice were monitored for three trials of beam crossing at each time point. The number of paw slips and falls off the beam were counted, along with the time it took traverse the beam. The three trials were then averaged together for each time point.
A combination of motor coordination and strength was assessed using a vertical pole climbing assay as previously described (50). Mice were placed on top of an acrylic pole measuring 3/8 inch in diameter and 18 inches in height sitting in their home cage. Mice should instinctively climb down back to their home cage. To measure motor coordination using this assay, we calculated the amount of the time it took to reach the bottom of the pole. For each time point, three trials were recorded and the mean time was used. Trials with overt freezing behavior were rare for both genotypes, but when they occurred, these trials were removed.
Exercise endurance was measured using a treadmill running assay. Mice were placed on a treadmill (Columbus Instruments) with a speed starting at a 10 m/min increasing incrementally by 1 m/min every 3 min to a maximum of 18 m/min, at a fixed incline of 5%. The treadmill was equipped with a motivational grid. The test ended if mice were able to run for 20 min. The time to fatigue (i.e. if mice stop running before 20 min) was measured.
Histology and immunocytochemistry
For histology experiments, mice were anaesthetized and perfused with cold phosphate-buffered saline (PBS) and then 4% paraformaldehyde (PFA). Brains were then removed, postfixed in PFA overnight and cryoprotected in 30% sucrose. Coronal brain slices (30 μm) were prepared using a sliding microtome (Leica SM2000R).
For immunostaining of tissue, sections and coverslips were blocked for 1 h in PBS with 0.2% Triton X-100 and 10% bovine calf serum and then incubated with primary antibodies overnight at RT. For immunocytochemistry experiments, neuronal cultures were prepared similarly after fixation in 4% PFA for 15 min. For labeling, the following primary antibodies were used: mouse and rabbit anti-CHCHD2 (Proteintech 19424-1-AP and 66302-1-Ig, 1:1000,); rabbit anti-CHCHD10 (Proteintech 25671-1-AP, 1:1000); mouse anti-NeuN (Millipore MAB377 1:1000); mouse anti-PDH (Abcam 110333, 1:1000); mouse, rabbit and sheep anti-Tyrosine hydroxylase (Millipore MAB152, MAB318 and MAB1542, 1:500-1000); mouse anti-Calbindin (Millipore C9848, 1:1000); goat anti-ChAT (Abcam AB144P, 1:1000); mouse anti-DARPP32 (BD Biosciences BDB611520, 1:1000). Sections and coverslips were then washed with PBS with 0.2% Triton X-100 and incubated for 2 h at RT with the corresponding secondary antibodies: Alexa Fluor 488, 594 or 647 anti-mouse, anti-rabbit or anti-sheep IgG (1:500-1000; Invitrogen). For peroxidase staining, sections were quenched with 3% H2O2 and 10% methanol in PBS and blocked in 10% bovine calf serum and 0.2% gelatin in PBS with 0.5% Triton X-100. They were incubated with rabbit anti-TH (1:1000) followed by biotinylated goat anti-rabbit IgG (1:500; Vector Laboratories, Burlingame, CA; BA-1000, RRID: AB2313606) and subsequently streptavidin-conjugated horseradish peroxidase (HRP) (1:500; Vectastain ABC kit, Vector Laboratories). Immunostaining was visualized with hydrogen peroxide and 3,3′-diaminobenzidine (DAB, Sigma). Brain sections and coverslips were imaged with a laser scanning confocal microscope (Zeiss LSM510-Meta, Zeiss LSM780-NLO FLIM). Quantification of fluorescence and area was performed blinded to genotype with Zen 2.3 software (Carl Zeiss Microscopy GmbH), MetaMorph software (version 7.7.3.0; Universal Imaging) or ImageJ (imagej.nih.gov).
Stereology
Total numbers of TH-positive neurons were quantified with the examiners blind to the genotype. Brain slides (40 μm thickness) were first examined under 5× magnification for region selection of SNc and VTA, and imaged under 63× magnification by a Zeiss Imager A2 microscope (Carl Zeiss AG, Oberkochen, Germany) equipped with an XYZ computer-controlled motorized stage and an EOS rebel T5i Digital Camera (Cannon, Inc., Tokyo, Japan). TH-stained neurons were counted using the software Stereo Investigator (MBF Stereo Investigator version 2018; MBF Bioscience, Williston, VT, USA). Section interval was 6, and the counting frame was 60 × 60 μm. The procedure was adapted from Ehrenberg et al. (57).
Measurement of striatal catecholamine levels
Mice were terminally anesthetized and perfused with ice-cold PBS for 2 min, then their brains were rapidly removed and immediately frozen in a dry ice ethanol bath. Frozen brains were stored at −80°C before further processing. Coronal sections of 300 μm thickness were cut in a cryostat, and punches were made from the dorsal striatum (using a pipette tip cut to 1 mm in diameter) and stored at −80°C. Catecholamine levels were measured by the Vanderbilt Neurochemistry Core by HPLC coupled to an electrochemical detector (58).
Mitochondrial fractionation
Mitochondria-enriched fractions for western blotting and mitochondrial functional assays were prepared as follows. Mice were euthanized by cervical dislocation. Tissues were dissected and placed in cold, freshly prepared mitochondrial isolation buffer containing 225 mm d-mannitol, 75 mm sucrose, 20 mm HEPES, 1 mm EGTA, 1 mg/ml fatty acid-free BSA, pH 7.4. Tissues were then homogenized on ice, in buffer, in a glass Dounce Homogenizer, with 40 pestle strokes and transferred to an ultracentrifuge tube. The volume in the centrifuge tube was increased to 35 ml and a first clearing spin was completed at 1500 RCF. The supernatant was retained, and brain samples were incubated for 5 min on ice with 0.02% w/v digitonin to break apart synaptosomes. Mitochondria were then obtained by centrifugation at 13 500 RCF and resuspended in 200–300 μl of mitochondrial isolation buffer. Total protein amount was quantified using a modified Lowry protocol (Bio-Rad DC Protein Assay, #5000112).
Western blotting from isolated mitochondria
Mitochondrial samples for western blotting were prepared as follows. Mitochondria were pelleted at 13 500 RCF and lysed in RIPA buffer (150 mm sodium chloride, 1% NP-40, 0.5% sodium deoxycholate, 0.1% SDS, 25 mm Tris, pH 7.4) with protease and phosphatase inhibitors (ThermoFisher, #78441) for 30 min on ice. 2× Laemmli buffer with 2-mercaptoethanol was added to an equivalent volume of lysed mitochondria to yield a 1× solution at 1 μg/μl protein concentration. A total of 5–15 μg of mitochondria were loaded onto polyacrylamide gels (Bio-Rad #4569033) and electrophoresis was carried out using standard SDS-PAGE procedures. Protein was then transferred from the gel onto a nitrocellulose membrane using a rapid transfer system (Bio-Rad #1704150). Membranes were blocked in 5% milk and probed using antibody manufacturer protocols. Primary antibodies used were as follows: CHCHD10 (Proteintech 25671-1-AP, 1:500), CHCHD2 (Proteintech 19424-1-AP, 1:500) and VDAC (UC Davis/NeuroMab clone N152B/23, 0.01 μg/ml). Protein staining was carried out using Bio-Rad TGX stain-free gels (Bio-Rad, #4568121). Membrane and gel imaging were done using a Bio-Rad ChemiDoc imaging system. Quantification of differences between protein samples was performed by densitometry, using ImageJ gel analysis functions.
Western blotting from whole-tissue lysates
Tissues were collected from euthanized mice, immediately frozen in a dry ice ethanol bath and stored at −80°C before further processing. To prepare total protein samples, tissues were homogenized on ice using a glass PTFE tissue grinder (Cole-Parmer) in RIPA buffer (ThermoFisher #89900) supplemented with Halt protease and phosphatase inhibitor cocktail (ThermoFisher #78444). The homogenized solutions were lysed further for 2 h at 4°C. Total proteins were collected as supernatant by centrifuging at 20 000 RCF for 20 min. Protein concentration was measured using Pierce BCA assay (ThermoFisher #23227) and stored at −80°C. Equal amounts of proteins (30–60 μg/lane) were separated by SDS–PAGE and transferred onto nitrocellulose membranes using iBlot™ 2 Dry Blotting System (ThermoFisher # IB23001, #IB21001). Blots were blocked in 2 h in Intercept® (PBS) Blocking Buffer (Licor # 927-70001) and incubated overnight with primary antibodies (mouse and rabbit anti-CHCHD2 (Proteintech 19424-1-AP and 66302-1-Ig, 1:1000), rabbit anti-CHCHD10 (Proteintech 25671-1-AP, 1:1000), mouse anti-alpha-synuclein (BD Biosciences #610787, 1:1000), rabbit anti-Hsp60 (Proteintech #15282-1-AP, 1:1000), rabbit anti-Tom20 (Santa Cruz #SC-11415, 1:1000), mouse anti-GAPDH (Invitrogen MA1-16757, 1:2000) and mouse anti-beta-actin antibody (Millipore Sigma MAB1501R, 1:2000), followed by IRDye 800CW goat anti-Mouse IgG and IRDye 680RD goat anti-rabbit IgG secondary antibodies (Li-cor Biosciences, 926-32210 and 926-68071 1:10000). Blots were visualized using the Odyssey infrared imaging system and analyzed using Image Studio Lite Software (Li-cor Biosciences).
Native PAGE
For Native PAGE, 400 μg of mitochondria were solubilized in 40 μl of buffer (50 mm sodium chloride, 50 mm Bis-Tris, 2 mm 6-aminohexanoic acid, 1 mm EDTA, pH 7) on ice for 10 min. Samples were then incubated with 12 μl of 20% w/v digitonin for 5 min. Samples were then incubated with 18 μl of 4× NativePage sample buffer (ThermoFisher, #BN2003) and 6 μl of 5% Coomassie G-250 dye (ThermoFisher, BN2004). Electrophoresis was carried out using 4–16% Bis-Tris acrylamide gels (ThermoFisher, BN1002BOX). Electrophoresis was carried out on ice at 150 volts for 1.5 h and 300 volts for 30 min. The cathode buffer used was kept at high Coomassie dye concentrations for the first 30 min before being reduced for the remainder of the run. After electrophoresis, the gel was transferred to a PVDF membrane, and the membrane was air dried for 30 min before de-staining in methanol. Methanol was then rinsed off the membrane for 1 h with several washes in TBST before proceeding to blocking and immunoblotting as described above.
Protein cross-linking
One milligram of mitochondria was spun down at 13 500 RCF and the mitochondria isolation buffer was removed. Mitochondria were resuspended in amine-free buffer (0.1 M sodium phosphate, 0.15 M NaCl, pH 7.2) with 0.5 mm disuccinimidyl suberate (DSS, ThermoFisher # 21655). Samples were reacted at room temperature for 1 h. DSS was quenched by adding Tris to a final concentration of 25 mm. Mitochondria were pelleted and resuspended in RIPA buffer and used for western blotting, as described above.
Mitochondrial respiratory function
Oxygen consumption was measured on mitochondria isolated from whole brains using procedures described above. Oxygen consumption was measured with 200 μg of freshly isolated mitochondria at 37°C in respiration buffer (225 mm d-mannitol, 75 mm sucrose, 20 mm HEPES, 1 mm EGTA, 1 mg/ml fatty-acid free BSA, 4 mm K3PO4, 2 mm MgCl2) pH 7.4 using a Clark electrode and Oxytherm Oxygraph (Hansatech), as previously described (23). State III Oxygen consumption was measured with specific substrates for complex I (2 mm malate, 5 mm pyruvate) and saturating concentrations of ADP (1 mm). State IVo oxygen consumption was measured in the presence of 2 μm oligomycin. State IIIu oxygen consumption was measured with 240 nm Tyrphostin 9 (SF-6847, Enzo Life Science, BML-EI215).
Mitochondrial ATP synthesis was measured using a rapid kinetic luciferase-luciferin assay and detected with the Optocomp I (MGM Instruments) as previously described (59). Briefly, ATP synthesis rates were measured at room temperature using 50 μg of energized mitochondria with complex I (190 mm pyruvate, 190 mm malate) substrates in ATP synthesis buffer (6 mm diadenosine pentaphosphate, 150 mm KCl, 25 mm Tris-HCl, 2 mm EDTA, 10 mm K3PO4, 0.1 mm MgCl2, 1 mg/ml BSA, pH 7.4). A calibration curve was calculated based on known ATP concentrations and used to determine the rate of ATP synthesis in each sample expressed as nmol ATP/min/mg protein.
H2O2 production rates were measured at 37°C, using 100 μg of energized mitochondria with complex II substrates (5 mm succinate, 2 mm glutamate) in MS-EGTA buffer. Fluorescence was measured in the presence of HRP and Amplex UltraRed (ThermoFisher #A36006) and calibrated with known concentrations of H2O2 to determine the rate of H2O2 production expressed as pmol H2O2/min/mg protein.
Neuronal culture and live imaging
Postnatal SNc DA neuron cultures were prepared from P0-2 CHCHD2lox/lox (WT) mice. Lateral mesencephalon and striata were microdissected, dissociated with papain (Worthington Biochemical) and co-plated at 1:1 ratio at a density of 1200 cells/mm2 and cultured as described (60). Postnatal hippocampal neuronal cultures were prepared from P0-1 CHCHD2lox/lox mice and transfected via electroporation (Amaxa) with one or more of the following constructs, all expressed in the pCAGS vector: Cre recombinase, MitoBFP, Clover-mApple ATP (43), MitoKeima (46). Neurons were cultured for 9–13 days before live imaging and analysis.
Live imaging was performed in Tyrode buffer (pH 7.4; 127 mm NaCl, 10 mm HEPES-NaOH, 2.5 mm KCl, 2 mm MgCl2, 2 mm CaCl2, with or without 30 mm glucose and/or 10 mm pyruvate) on a Nikon Ti-E inverted microscope with an iXon EMCCD camera (Andor Technology) and a perfusion valve control system (VC-8, Warner Instruments) controlled by MetaMorph Software. Quantification of fluorescence and area was performed blind to genotype with MetaMorph software (version 7.7.3.0; Universal Imaging).
For mitochondrial membrane potential (TMRM) imaging, cells at DIV 9–13 were pretreated with TMRM (20 nm) for 1 h then transferred to Tyrode buffer with 20 nm TMRM for imaging. Cells were imaged live with a 40× air objective (0.95 NA) on a Nikon Ti-E inverted microscope at 25°C, in the presence and absence of oligomycin (5 μm) and carbonylcyanide 4-(trifluoromethoxy) phenylhydrazone (FCCP, 10 μm). Mitochondrial area was identified by MitoBFP fluorescence. The intensity of TMRM fluorescence of the mitochondria was calculated as the mean fluorescence of the TMRM in mitochondrial area subtracted to the mean fluorescence of TMRM in the nucleus area.
For ATP FRET imaging, sequential images were taken in the Clover (470/40 ex, 525/50 em), mApple (572/35 ex, 632/60 em) and FRET channels (470/40 ex, 632/60 em). Synaptic boutons were identified based on morphology. The FRET/donor ratio was calculated for each bouton, where FRET = (IFRET – (IClover* BTClover) – (ImApple* BTmApple))/IClover. IX is the background-corrected fluorescence intensity measured in a given channel. BTClover (donor bleed through) and BTmApple (direct excitation of the acceptor) were calculated by expressing Clover and mApple individually and determining the ratios of IFRET/IClover and IFRET/ImApple, respectively. Field stimulations (5 Hz for 7 min) were performed with an A385 current isolator and a SYS-A310 accupulser signal generator (World Precision Instruments) (40). Glycolysis was inhibited with 2DG (5 mm, Sigma-Aldrich) and iodoacetate (1 mm, Sigma-Aldrich).
For mitoKeima experiments, images were acquired at 572/35 ex, 632/60 em (red-FLlyso) and 430/24 ex, 632/60 em (green-FLmito). Mitochondrial areas were identified by thresholding all images to the same value, fluorescence intensity of the area was subtracted with background and the ratio of green/red was calculated.
Statistical analyses
For all behavioral measures, means were compared between genotypes at each individual time point. D’Agostino–Pearson test was used to determine whether the groups were normally distributed. For normally distributed data, we used the unpaired t test with Welch’s correction. Mann–Whitney U test was used for data that were not normally distributed. Significant differences were defined as those with P < 0.05. All behavioral experiments were performed with the examiner blinded to genotype. Comparison between multiple groups was assessed using one-way or two-way ANOVA followed by the indicated post hoc tests. Survival analysis was performed by the log-rank (Mantel–Cox) test.
Supplementary Material
Acknowledgements
We thank Julia Holtzman and Jessica Speckart at the Gladstone Behavioral Core for their assistance with behavioral testing and data analysis. We thank Junli Zhang at the Gladstone Transgenic Gene Targeting Core for helping with mouse blastocyst injection. We also thank the Gladstone Histology and Light Microscopy core, as well as Kathryn Claiborn and Francoise Chanut for helping edit the manuscript, and Erica Delin for administrative assistance. We also thank Lea Grinberg and Caroline Lew for assistance with stereology and James Surmeier and Dilyan Dryanovski for guidance with the SNc cocultures.
Conflict of Interest statement. The authors report no conflict of interest.
Contributor Information
Mai K Nguyen, Gladstone Institute of Neurological Disease, Gladstone Institutes, San Francisco, CA 94158, USA.
Kevin McAvoy, Feil Family Brain and Mind Research Institute, Weill Cornell Medicine, New York, NY 10065, USA.
Szu-Chi Liao, Gladstone Institute of Neurological Disease, Gladstone Institutes, San Francisco, CA 94158, USA; Department of Nutritional Sciences & Toxicology, University of California Berkeley, Berkeley, CA 94720, USA; Endocrinology Graduate Program, University of California Berkeley, Berkeley, CA 94720, USA.
Zak Doric, Gladstone Institute of Neurological Disease, Gladstone Institutes, San Francisco, CA 94158, USA; Graduate Program in Neuroscience, University of California San Francisco, San Francisco, CA 94158, USA.
Iris Lo, Gladstone Institute of Neurological Disease, Gladstone Institutes, San Francisco, CA 94158, USA.
Huihui Li, Gladstone Institute of Neurological Disease, Gladstone Institutes, San Francisco, CA 94158, USA.
Giovanni Manfredi, Feil Family Brain and Mind Research Institute, Weill Cornell Medicine, New York, NY 10065, USA.
Ken Nakamura, Gladstone Institute of Neurological Disease, Gladstone Institutes, San Francisco, CA 94158, USA; Graduate Program in Neuroscience, University of California San Francisco, San Francisco, CA 94158, USA; Graduate Program in Biomedical Sciences, University of California San Francisco, San Francisco, CA 94143, USA; Department of Neurology, University of California San Francisco, San Francisco, CA 94158, USA.
Funding
Joan and David Traitel Family Trust and Betty Brown’s Family; National Institutes of Health (R01NS091902 to K.N., M.K.N., S.-C.L., Z.D. and H.L.); Hillblom Fellowship and a Berkelhammer Award for Excellence in Neuroscience (to Z.D.); National Institutes of Health RR18928 (to the Gladstone Institutes); Muscular Dystrophy Association grant (MDA602894 to G.M.); National Institutes of Health (1R01NS112672-01 to G.M., R35 NS122209 to G.M., F32 NS116151 to K.M.).
References
- 1. Valente, E.M., Abou-Sleiman, P.M., Caputo, V., Muqit, M.M., Harvey, K., Gispert, S., Ali, Z., Del Turco, D., Bentivoglio, A.R., Healy, D.G.et al. (2004) Hereditary early-onset Parkinson's disease caused by mutations in PINK1. Science, 304, 1158–1160. [DOI] [PubMed] [Google Scholar]
- 2. Ricciardi, L., Petrucci, S., Guidubaldi, A., Ialongo, T., Serra, L., Ferraris, A., Spano, B., Bozzali, M., Valente, E.M. and Bentivoglio, A.R. (2014) Phenotypic variability of PINK1 expression: 12 Years' clinical follow-up of two Italian families. Mov. Disord., 29, 1561–1566. [DOI] [PubMed] [Google Scholar]
- 3. Hao, L.Y., Giasson, B.I. and Bonini, N.M. (2010) DJ-1 is critical for mitochondrial function and rescues PINK1 loss of function. Proc. Natl. Acad. Sci. U. S. A., 107, 9747–9752. [DOI] [PMC free article] [PubMed] [Google Scholar]
- 4. Guzman, J.N., Sanchez-Padilla, J., Wokosin, D., Kondapalli, J., Ilijic, E., Schumacker, P.T. and Surmeier, D.J. (2010) Oxidant stress evoked by pacemaking in dopaminergic neurons is attenuated by DJ-1. Nature, 468, 696–700. [DOI] [PMC free article] [PubMed] [Google Scholar]
- 5. Ahlskog, J.E. (2009) Parkin and PINK1 parkinsonism may represent nigral mitochondrial cytopathies distinct from Lewy body Parkinson's disease. Parkinsonism Relat. Disord., 15, 721–727. [DOI] [PMC free article] [PubMed] [Google Scholar]
- 6. Funayama, M., Ohe, K., Amo, T., Furuya, N., Yamaguchi, J., Saiki, S., Li, Y., Ogaki, K., Ando, M., Yoshino, H.et al. (2015) CHCHD2 mutations in autosomal dominant late-onset Parkinson's disease: a genome-wide linkage and sequencing study. Lancet Neurol., 14, 274–282. [DOI] [PubMed] [Google Scholar]
- 7. Ikeda, A., Nishioka, K., Meng, H., Takanashi, M., Hasegawa, I., Inoshita, T., Shiba-Fukushima, K., Li, Y., Yoshino, H., Mori, A.et al. (2019) Mutations in CHCHD2 cause alpha-synuclein aggregation. Hum. Mol. Genet., 28, 3895–3911. [DOI] [PubMed] [Google Scholar]
- 8. Kee, T.R., Espinoza Gonzalez, P., Wehinger, J.L., Bukhari, M.Z., Ermekbaeva, A., Sista, A., Kotsiviras, P., Liu, T., Kang, D.E. and Woo, J.A. (2021) Mitochondrial CHCHD2: disease-associated mutations, physiological functions, and current animal models. Front. Aging Neurosci., 13, 660843. [DOI] [PMC free article] [PubMed] [Google Scholar]
- 9. Shi, C.H., Mao, C.Y., Zhang, S.Y., Yang, J., Song, B., Wu, P., Zuo, C.T., Liu, Y.T., Ji, Y., Yang, Z.H.et al. (2016) CHCHD2 gene mutations in familial and sporadic Parkinson's disease. Neurobiol. Aging, 38, 217 e219–217 e213. [DOI] [PubMed] [Google Scholar]
- 10. Yang, X., Zhao, Q., An, R., Zheng, J., Tian, S., Chen, Y. and Xu, Y. (2016) Mutational scanning of the CHCHD2 gene in Han Chinese patients with Parkinson’s disease and meta-analysis of the literature. Parkinsonism Relat. Disord., 29, 42–46. [DOI] [PubMed] [Google Scholar]
- 11. Meng, H., Yamashita, C., Shiba-Fukushima, K., Inoshita, T., Funayama, M., Sato, S., Hatta, T., Natsume, T., Umitsu, M., Takagi, J.et al. (2017) Loss of Parkinson’s disease-associated protein CHCHD2 affects mitochondrial crista structure and destabilizes cytochrome c. Nat. Commun., 8, 15500. [DOI] [PMC free article] [PubMed] [Google Scholar]
- 12. Cornelissen, T., Spinazzi, M., Martin, S., Imberechts, D., Vangheluwe, P., Bird, M., De Strooper, B. and Vandenberghe, W. (2020) CHCHD2 harboring Parkinson's disease-linked T61I mutation precipitates inside mitochondria and induces precipitation of wild-type CHCHD2. Hum. Mol. Genet., 29, 1096–1106. [DOI] [PubMed] [Google Scholar]
- 13. Lee, R.G., Sedghi, M., Salari, M., Shearwood, A.J., Stentenbach, M., Kariminejad, A., Goullee, H., Rackham, O., Laing, N.G., Tajsharghi, H.et al. (2018) Early-onset Parkinson disease caused by a mutation in CHCHD2 and mitochondrial dysfunction. Neurol Genet, 4, e276. [DOI] [PMC free article] [PubMed] [Google Scholar]
- 14. Mao, C., Wang, H., Luo, H., Zhang, S., Xu, H., Zhang, S., Rosenblum, J., Wang, Z., Zhang, Q., Tang, M.et al. (2019) CHCHD10 is involved in the development of Parkinson's disease caused by CHCHD2 loss-of-function mutation p.T61I. Neurobiol. Aging, 75, 38–41. [DOI] [PMC free article] [PubMed] [Google Scholar]
- 15. Woo, J.A., Liu, T., Trotter, C., Fang, C.C., De Narvaez, E., LePochat, P., Maslar, D., Bukhari, A., Zhao, X., Deonarine, A.et al. (2017) Loss of function CHCHD10 mutations in cytoplasmic TDP-43 accumulation and synaptic integrity. Nat. Commun., 8, 15558. [DOI] [PMC free article] [PubMed] [Google Scholar]
- 16. Aras, S., Bai, M., Lee, I., Springett, R., Huttemann, M. and Grossman, L.I. (2015) MNRR1 (formerly CHCHD2) is a bi-organellar regulator of mitochondrial metabolism. Mitochondrion, 20, 43–51. [DOI] [PubMed] [Google Scholar]
- 17. Longen, S., Bien, M., Bihlmaier, K., Kloeppel, C., Kauff, F., Hammermeister, M., Westermann, B., Herrmann, J.M. and Riemer, J. (2009) Systematic analysis of the twin cx(9)c protein family. J. Mol. Biol., 393, 356–368. [DOI] [PubMed] [Google Scholar]
- 18. Imai, Y., Meng, H., Shiba-Fukushima, K. and Hattori, N. (2019) Twin CHCH proteins, CHCHD2, and CHCHD10: key molecules of Parkinson’s disease, amyotrophic lateral sclerosis, and frontotemporal dementia. Int. J. Mol. Sci., 20, 908. [DOI] [PMC free article] [PubMed] [Google Scholar]
- 19. Aras, S., Arrabi, H., Purandare, N., Huttemann, M., Kamholz, J., Zuchner, S. and Grossman, L.I. (2017) Abl2 kinase phosphorylates bi-organellar regulator MNRR1 in mitochondria, stimulating respiration. Biochim. Biophys. Acta Mol. Cell Res., 1864, 440–448. [DOI] [PubMed] [Google Scholar]
- 20. Liu, Y.T., Huang, X., Nguyen, D., Shammas, M.K., Wu, B.P., Dombi, E., Springer, D.A., Poulton, J., Sekine, S. and Narendra, D.P. (2020) Loss of CHCHD2 and CHCHD10 activates OMA1 peptidase to disrupt mitochondrial cristae phenocopying patient mutations. Hum. Mol. Genet., 29, 1547–1567. [DOI] [PMC free article] [PubMed] [Google Scholar]
- 21. Harjuhaahto, S., Rasila, T.S., Molchanova, S.M., Woldegebriel, R., Kvist, J., Konovalova, S., Sainio, M.T., Pennonen, J., Torregrosa-Munumer, R., Ibrahim, H.et al. (2020) ALS and Parkinson's disease genes CHCHD10 and CHCHD2 modify synaptic transcriptomes in human iPSC-derived motor neurons. Neurobiol. Dis., 141, 104940. [DOI] [PubMed] [Google Scholar]
- 22. Floyd, B.J., Wilkerson, E.M., Veling, M.T., Minogue, C.E., Xia, C., Beebe, E.T., Wrobel, R.L., Cho, H., Kremer, L.S., Alston, C.L.et al. (2016) Mitochondrial protein interaction mapping identifies regulators of respiratory chain function. Mol. Cell, 63, 621–632. [DOI] [PMC free article] [PubMed] [Google Scholar]
- 23. Burstein, S.R., Valsecchi, F., Kawamata, H., Bourens, M., Zeng, R., Zuberi, A., Milner, T.A., Cloonan, S.M., Lutz, C., Barrientos, A.et al. (2018) In vitro and in vivo studies of the ALS-FTLD protein CHCHD10 reveal novel mitochondrial topology and protein interactions. Hum. Mol. Genet., 27, 160–177. [DOI] [PMC free article] [PubMed] [Google Scholar]
- 24. Bannwarth, S., Ait-El-Mkadem, S., Chaussenot, A., Genin, E.C., Lacas-Gervais, S., Fragaki, K., Berg-Alonso, L., Kageyama, Y., Serre, V., Moore, D.G.et al. (2014) A mitochondrial origin for frontotemporal dementia and amyotrophic lateral sclerosis through CHCHD10 involvement. Brain, 137, 2329–2345. [DOI] [PMC free article] [PubMed] [Google Scholar]
- 25. Chaussenot, A., Le Ber, I., Ait-El-Mkadem, S., Camuzat, A., deSeptenville, A., Bannwarth, S., Genin, E.C., Serre, V., Auge, G., French research network on FTD et al. (2014) Screening of CHCHD10 in a French cohort confirms the involvement of this gene in frontotemporal dementia with amyotrophic lateral sclerosis patients. Neurobiol. Aging, 35, 2884 e2881–2884 e2884. [DOI] [PubMed] [Google Scholar]
- 26. Straub, I.R., Janer, A., Weraarpachai, W., Zinman, L., Robertson, J., Rogaeva, E. and Shoubridge, E.A. (2018) Loss of CHCHD10-CHCHD2 complexes required for respiration underlies the pathogenicity of a CHCHD10 mutation in ALS. Hum. Mol. Genet., 27, 178–189. [DOI] [PMC free article] [PubMed] [Google Scholar]
- 27. Liu, W., Duan, X., Xu, L., Shang, W., Zhao, J., Wang, L., Li, J.C., Chen, C.H., Liu, J.P. and Tong, C. (2020) Chchd2 regulates mitochondrial morphology by modulating the levels of Opa1. Cell Death Differ., 27, 2014–2029. [DOI] [PMC free article] [PubMed] [Google Scholar]
- 28. Cavallaro, G. (2010) Genome-wide analysis of eukaryotic twin CX9C proteins. Mol. BioSyst., 6, 2459–2470. [DOI] [PubMed] [Google Scholar]
- 29. Haigh, J.J., Morelli, P.I., Gerhardt, H., Haigh, K., Tsien, J., Damert, A., Miquerol, L., Muhlner, U., Klein, R., Ferrara, N.et al. (2003) Cortical and retinal defects caused by dosage-dependent reductions in VEGF-A paracrine signaling. Dev. Biol., 262, 225–241. [DOI] [PubMed] [Google Scholar]
- 30. Tronche, F., Kellendonk, C., Kretz, O., Gass, P., Anlag, K., Orban, P.C., Bock, R., Klein, R. and Schutz, G. (1999) Disruption of the glucocorticoid receptor gene in the nervous system results in reduced anxiety. Nat. Genet., 23, 99–103. [DOI] [PubMed] [Google Scholar]
- 31. Liang, H., Hippenmeyer, S. and Ghashghaei, H.T. (2012) A Nestin-cre transgenic mouse is insufficient for recombination in early embryonic neural progenitors. Biol. Open, 1, 1200–1203. [DOI] [PMC free article] [PubMed] [Google Scholar]
- 32. Sato, S., Noda, S., Torii, S., Amo, T., Ikeda, A., Funayama, M., Yamaguchi, J., Fukuda, T., Kondo, H., Tada, N.et al. (2021) Homeostatic p62 levels and inclusion body formation in CHCHD2 knockout mice. Hum. Mol. Genet., 30, 443–453. [DOI] [PubMed] [Google Scholar]
- 33. Nakamura, K., Nemani, V.M., Wallender, E.K., Kaehlcke, K., Ott, M. and Edwards, R.H. (2008) Optical reporters for the conformation of alpha-synuclein reveal a specific interaction with mitochondria. J. Neurosci., 28, 12305–12317. [DOI] [PMC free article] [PubMed] [Google Scholar]
- 34. Nakamura, K., Nemani, V.M., Azarbal, F., Skibinski, G., Levy, J.M., Egami, K., Munishkina, L., Zhang, J., Gardner, B., Wakabayashi, J.et al. (2011) Direct membrane association drives mitochondrial fission by the Parkinson disease-associated protein alpha-synuclein. J. Biol. Chem., 286, 20710–20726. [DOI] [PMC free article] [PubMed] [Google Scholar]
- 35. Wang, X., Becker, K., Levine, N., Zhang, M., Lieberman, A.P., Moore, D.J. and Ma, J. (2019) Pathogenic alpha-synuclein aggregates preferentially bind to mitochondria and affect cellular respiration. Acta Neuropathol. Commun., 7, 41. [DOI] [PMC free article] [PubMed] [Google Scholar]
- 36. Huang, X., Wu, B.P., Nguyen, D., Liu, Y.T., Marani, M., Hench, J., Benit, P., Kozjak-Pavlovic, V., Rustin, P., Frank, S.et al. (2019) CHCHD2 accumulates in distressed mitochondria and facilitates oligomerization of CHCHD10. Hum. Mol. Genet., 28, 349. [DOI] [PMC free article] [PubMed] [Google Scholar]
- 37. Hayashi, S., Lewis, P., Pevny, L. and McMahon, A.P. (2002) Efficient gene modulation in mouse epiblast using a Sox2Cre transgenic mouse strain. Mech. Dev., 119(Suppl 1), S97–S101. [DOI] [PubMed] [Google Scholar]
- 38. Berthet, A., Margolis, E.B., Zhang, J., Hsieh, I., Zhang, J., Hnasko, T.S., Ahmad, J., Edwards, R.H., Sesaki, H., Huang, E.J.et al. (2014) Loss of mitochondrial fission depletes axonal mitochondria in midbrain dopamine neurons. J. Neurosci., 34, 14304–14317. [DOI] [PMC free article] [PubMed] [Google Scholar]
- 39. Gandhi, S., Wood-Kaczmar, A., Yao, Z., Plun-Favreau, H., Deas, E., Klupsch, K., Downward, J., Latchman, D.S., Tabrizi, S.J., Wood, N.W.et al. (2009) PINK1-associated Parkinson's disease is caused by neuronal vulnerability to calcium-induced cell death. Mol. Cell, 33, 627–638. [DOI] [PMC free article] [PubMed] [Google Scholar]
- 40. Pathak, D., Shields, L.Y., Mendelsohn, B.A., Haddad, D., Lin, W., Gerencser, A.A., Kim, H., Brand, M.D., Edwards, R.H. and Nakamura, K. (2015) The role of mitochondrially derived ATP in synaptic vesicle recycling. J. Biol. Chem., 290, 22325–22336. [DOI] [PMC free article] [PubMed] [Google Scholar]
- 41. Shields, L.Y., Kim, H., Zhu, L., Haddad, D., Berthet, A., Pathak, D., Lam, M., Ponnusamy, R., Diaz-Ramirez, L.G., Gill, T.M.et al. (2015) Dynamin-related protein 1 is required for normal mitochondrial bioenergetic and synaptic function in CA1 hippocampal neurons. Cell Death Dis., 6, e1725. [DOI] [PMC free article] [PubMed] [Google Scholar]
- 42. Pathak, D., Berthet, A. and Nakamura, K. (2013) Energy failure: does it contribute to neurodegeneration? Ann. Neurol., 74, 506–516. [DOI] [PMC free article] [PubMed] [Google Scholar]
- 43. Mendelsohn, B.A., Bennett, N.K., Darch, M.A., Yu, K., Nguyen, M.K., Pucciarelli, D., Nelson, M., Horlbeck, M.A., Gilbert, L.A., Hyun, W.et al. (2018) A high-throughput screen of real-time ATP levels in individual cells reveals mechanisms of energy failure. PLoS Biol., 16, e2004624. [DOI] [PMC free article] [PubMed] [Google Scholar]
- 44. Imamura, H., Huynh Nhat, K.P., Togawa, H., Saito, K., Iino, R., Kato-Yamada, Y., Nagai, T. and Noji, H. (2009) Visualization of ATP levels inside single living cells with fluorescence resonance energy transfer-based genetically encoded indicators. Proc. Natl. Acad. Sci. U. S. A., 106, 15651–15656. [DOI] [PMC free article] [PubMed] [Google Scholar]
- 45. Pathak, D., Berthet, A., Bendor, J.T., Yu, K., Sellnow, R.C., Orr, A.L., Nguyen, M.K., Edwards, R.H., Manfredsson, F.P. and Nakamura, K. (2017) Loss of alpha-Synuclein does not affect mitochondrial bioenergetics in rodent neurons. eNeuro, 4, 0216–16. [DOI] [PMC free article] [PubMed] [Google Scholar]
- 46. Katayama, H., Kogure, T., Mizushima, N., Yoshimori, T. and Miyawaki, A. (2011) A sensitive and quantitative technique for detecting autophagic events based on lysosomal delivery. Chem. Biol., 18, 1042–1052. [DOI] [PubMed] [Google Scholar]
- 47. Berthet, A. and Bezard, E. (2009) Dopamine receptors and L-dopa-induced dyskinesia. Parkinsonism Relat. Disord., 15(Suppl 4), S8–S12. [DOI] [PubMed] [Google Scholar]
- 48. Haddad, D. and Nakamura, K. (2015) Understanding the susceptibility of dopamine neurons to mitochondrial stressors in Parkinson's disease. FEBS Lett., 589, 3702–3713. [DOI] [PMC free article] [PubMed] [Google Scholar]
- 49. Li, H., Doric, Z., Berthet, A., Jorgens, D.M., Nguyen, M.K., Hsieh, I., Margulis, J., Fang, R., Debnath, J., Sesaki, H.et al. (2021) Longitudinal tracking of neuronal mitochondria delineates PINK1/Parkin-dependent mechanisms of mitochondrial recycling and degradation. Sci. Adv., 7(32), eabf6580. [DOI] [PMC free article] [PubMed] [Google Scholar]
- 50. Anderson, C.J., Bredvik, K., Burstein, S.R., Davis, C., Meadows, S.M., Dash, J., Case, L., Milner, T.A., Kawamata, H., Zuberi, A.et al. (2019) ALS/FTD mutant CHCHD10 mice reveal a tissue-specific toxic gain-of-function and mitochondrial stress response. Acta Neuropathol., 138, 103–121. [DOI] [PMC free article] [PubMed] [Google Scholar]
- 51. Liu, X., Wang, Q., Yang, Y., Stewart, T., Shi, M., Soltys, D., Liu, G., Thorland, E., Cilento, E.M., Hou, Y.et al. (2021) Reduced erythrocytic CHCHD2 mRNA is associated with brain pathology of Parkinson's disease. Acta Neuropathol Commun, 9, 37. [DOI] [PMC free article] [PubMed] [Google Scholar]
- 52. Grunewald, A., Kumar, K.R. and Sue, C.M. (2019) New insights into the complex role of mitochondria in Parkinson's disease. Prog. Neurobiol., 177, 73–93. [DOI] [PubMed] [Google Scholar]
- 53. Trinh, D., Israwi, A.R., Arathoon, L.R., Gleave, J.A. and Nash, J.E. (2021) The multi-faceted role of mitochondria in the pathology of Parkinson's disease. J. Neurochem., 156, 715–752. [DOI] [PubMed] [Google Scholar]
- 54. Johnson, E.C.B., Ho, K., Yu, G.Q., Das, M., Sanchez, P.E., Djukic, B., Lopez, I., Yu, X., Gill, M., Zhang, W.et al. (2020) Behavioral and neural network abnormalities in human APP transgenic mice resemble those of App knock-in mice and are modulated by familial Alzheimer's disease mutations but not by inhibition of BACE1. Mol. Neurodegener., 15, 53. [DOI] [PMC free article] [PubMed] [Google Scholar]
- 55. Lister, R.G. (1987) The use of a plus-maze to measure anxiety in the mouse. Psychopharmacology, 92, 180–185. [DOI] [PubMed] [Google Scholar]
- 56. Deacon, R.M. (2013) Measuring motor coordination in mice. J. Vis. Exp., 56, e2609. [DOI] [PMC free article] [PubMed] [Google Scholar]
- 57. Ehrenberg, A.J., Nguy, A.K., Theofilas, P., Dunlop, S., Suemoto, C.K., Di Lorenzo Alho, A.T., Leite, R.P., Diehl Rodriguez, R., Mejia, M.B., Rub, U.et al. (2017) Quantifying the accretion of hyperphosphorylated tau in the locus coeruleus and dorsal raphe nucleus: the pathological building blocks of early Alzheimer's disease. Neuropathol. Appl. Neurobiol., 43, 393–408. [DOI] [PMC free article] [PubMed] [Google Scholar]
- 58. Hnasko, T.S., Chuhma, N., Zhang, H., Goh, G.Y., Sulzer, D., Palmiter, R.D., Rayport, S. and Edwards, R.H. (2010) Vesicular glutamate transport promotes dopamine storage and glutamate corelease in vivo. Neuron, 65, 643–656. [DOI] [PMC free article] [PubMed] [Google Scholar]
- 59. Vives-Bauza, C., Yang, L. and Manfredi, G. (2007) Assay of mitochondrial ATP synthesis in animal cells and tissues. Methods Cell Biol., 80, 155–171. [DOI] [PubMed] [Google Scholar]
- 60. Dryanovski, D.I., Guzman, J.N., Xie, Z., Galteri, D.J., Volpicelli-Daley, L.A., Lee, V.M., Miller, R.J., Schumacker, P.T. and Surmeier, D.J. (2013) Calcium entry and alpha-synuclein inclusions elevate dendritic mitochondrial oxidant stress in dopaminergic neurons. J. Neurosci., 33, 10154–10164. [DOI] [PMC free article] [PubMed] [Google Scholar]
Associated Data
This section collects any data citations, data availability statements, or supplementary materials included in this article.