

ABSTRACT
Background
Motor neuron degeneration and malnutrition alter body composition in amyotrophic lateral sclerosis (ALS). Resulting losses of weight, fat mass (FM), and fat-free mass (FFM) shorten survival. Nutritional management relies on body weight or BMI; neither reliably indicates malnutrition nor differentiates body compartments.
Objectives
We aimed to 1) develop an equation to compute FM and FFM using clinical data, validated against DXA; and 2) examine the effect of computed FM and FFM on disease course and survival.
Methods
We studied 364 ALS patients from 3 cohorts. In Cohort #1 we used logistic regression on clinical and demographic data to create an equation (test cohort). In Cohort #2 we validated FM and FFM computed using this equation against DXA (validation cohort). In Cohort #3, we examined the effect of computed body composition on disease course and survival.
Results
In Cohort #1 (n = 29) the model incorporated sex, age, BMI, and bulbar-onset to create an equation to estimate body fat: % body fat = 1.73 – [19.80*gender (1 if male or 0 if female)] + [0.25*weight (kg)] + [0.95*BMI (kg/m2)] − (5.20*1 if bulbar-onset or *0 if limb-onset). In Cohort #2 (n = 104), body composition using this equation, compared to other published equations, showed the least variance from DXA values. In Cohort #3 (n = 314), loss of body composition over 6 mo was greater in males. Adjusted survival was predicted by low baseline FM (HR: 1.39; 95% CI: 1.07, 1.80), and loss of FM (HR: 1.87; 95% CI: 1.30, 2.69) and FFM (HR: 1.73; 95% CI: 1.20, 2.49) over 6 mo.
Conclusions
Our equation broadens the traditional nutritional evaluation in clinics and reliably estimates body composition. Measuring body composition could target FM as a focus for nutritional management to ensure adequate energy intake and complement measures, such as the ALS functional rating scale-revised score and forced vital capacity, currently used.
Keywords: amyotrophic lateral sclerosis, body composition, body mass index, dual energy X-ray absorptiometry, disease progression, fat mass, fat-free mass, nutrition, survival
Graphical Abstract
Graphical Abstract.
Introduction
Amyotrophic lateral sclerosis (ALS) is a progressive neurodegenerative disease caused by upper and lower motor neuron degeneration, which results in bulbar, limb, and respiratory muscle weakness, physical and psychosocial disability, and early death from respiratory failure (1). Denervation of muscle due to spinal motor neuron loss is a disease hallmark. Malnutrition, with its adverse effect on survival (2), is reported in 16%–50% of subjects (3). Both denervation and malnutrition alter body composition and cause advancing loss of weight, muscle, and fat (4–6), as evidenced by a declining BMI (in kg/m2) (2, 7). Decrease in fat mass (FM) is usually a consequence of catabolism of adipose tissue reserves for energy due to inadequate nutritional intake, whereas loss of muscle mass is due to both denervation-induced muscle atrophy and catabolism of muscle for energy.
Body composition estimation is essential for nutritional screening in health and disease (8), particularly in ALS. BMI is traditionally used to screen for the nutritional state, but it does not distinguish between fat and lean components of tissue, thus making it a less valuable indicator of the metabolic state. Also, BMI in isolation is not considered a reliable indicator of malnutrition (9), disease progression (10), or FM (11) in ALS. Thus, studying body composition, and not just BMI, may be helpful in guiding metabolic and nutritional management, and in assessing progression and survival in the disease.
Conventional techniques for measuring body composition, such as DXA (12, 13), bioelectrical impedance analysis or bioelectrical impedance spectroscopy (14), and radiological techniques such as computerized axial tomography (15) and MRI (16), pose limitations of high cost, limited availability, and assumptions of hydration status (5). Further, because of the need to lie supine, the logistics of testing can be challenging for ALS subjects with orthopnea from bulbar or respiratory compromise (5, 15). A simple, practical, and economical method of estimating body composition for nutritional assessment of ALS subjects is desirable.
Anthropometry to compute FM and lean body mass (LBM) is a field-tested method to assess the nutritional state; estimates generally parallel the severity of malnutrition. Several anthropometric equations are available to estimate body composition in healthy individuals. However, only 1 study (5) has used anthropometric equations to examine body composition of ALS subjects. The general application of anthropometry would require extensive training and equipment, which are not practical in the routine ALS clinic setting. Hence, we sought to study body composition from anthropometric measurements using several published equations, create an ALS-specific equation to compute FM and LBM using clinical variables generally obtained in ALS clinics, validate the new equation against the reference method of DXA, and finally determine the utility of computed body composition in predicting disease progression and survival.
Methods
ALS subjects and cohort definition
Subjects from 3 cohorts with a diagnosis of “definite” or “probable” ALS (17) participated in the study. Information was collected from General Clinical Research Center (GCRC) databases at the University of Vermont, College of Medicine, Burlington, VT (UVM-GCRC) and the University of Kentucky, Lexington, KY (UKY-GCRC). In addition to anthropometric measures, we recorded baseline demographics, and BMI, ALS functional rating scale-revised (ALSFRS-R) score, and predicted percentage forced vital capacity (%FVC) at baseline and after 6 mo of disease progression, along with survival data (18). Both the ALSFRS-R and %FVC are indicators of disease severity and predictors of progression and survival.
Concurrent anthropometric and DXA data were available in subjects from Cohort #1 evaluated in the UVM-GCRC. Cohort #2 consisted of subjects seen in the UVM-GCRC and UKY-GCRC, and subjects who participated in a National Institute of Neurological Disorders and Stroke (NINDS)-funded multicenter study that evaluated nutrition and respiratory support in ALS at 5 academic ALS Centers of Excellence (UKY; UVM; Columbia University, NY; University of Utah, Salt Lake City, UT; and Penn State University, Hershey, PA) (19, 20). Cohort #3 was comprised of subjects evaluated in the UKY-GCRC, of subjects from the NINDS-funded study, and of subjects seen in the National ALS Clinical and Research Center of Excellence clinic at the UVM Medical Center (UVMMC). Subjects in Cohort #3 were followed either every 2–4 mo as clinically necessary, or as dictated by the NINDS-funded study protocol (19, 20).
Study design
Figure 1 shows the organization of the study. Data from subjects in Cohort #1 were used to compare anthropometrically computed body composition to DXA-measured values, and a best-predictive ALS-specific equation was created to estimate percentage body fat, FM, and LBM. The computed FM and LBM from the equation were subsequently validated against DXA in the Cohort #2 subjects. Lastly, the practical implications of estimating body composition using the ALS-specific equation were examined in Cohort #3 subjects, to determine effects on disease progression and survival.
FIGURE 1.

Flow diagram of study design. ALS, amyotrophic lateral sclerosis; FM, fat mass; LBM, lean body mass.
Study sequence and measurements
Body composition in Cohort #1
Three sets of published anthropometric equations, created for use in healthy individuals, were utilized to estimate percentage body fat: the Jackson and Pollock equations (Equations 1 and 2 in Table 1) (21, 22), Durnin and Womersley equations (Equations 3 and 4 in Table 1) (23), and Deurenberg equations (Equations 5 and 6 in Table 1) (24). Measurements of skinfold thickness were made to estimate percentage body fat, using a Harpenden skinfold caliper (version 1.0.0.6, Baty International Ltd) as previously described (25). Skinfold thickness was obtained in triplicate from the right and left sides of the body by experienced exercise physiologists (JH, NK, and SD), and the mean for each site was used in the Jackson and Pollock and the Durnin and Womersley equations. BMI and age were used to estimate percentage body fat by the Deurenberg equations. The intertrial variability and interobserver variability of skinfold thickness measurements at our centers are <7.5%. FM and LBM were estimated from percentage body fat as given below:
 |
(7) |
 |
(8) |
TABLE 1.
Anthropometric kinfold thicknesses used in study1
| Jackson and Pollock (21, 22) |
| Males: |
 (1) (1) |
| Females: |
 (2) (2) |
| Durnin and Womersley (23) |
| Males: |
 (3) (3) |
| Females: |
 (4) (4) |
| Deurenberg et al. (24) |
| Males: |
 (5) (5) |
| Females: |
 (6) (6) |
| ALS-specific equation |
 (9) (9) |
All coefficients were rounded to 4 places. BMI in kg/m2. Sex = 1 if male, 0 if female; BO = 1 if bulbar-onset, 0 if limb-onset. A, age (y); ALS, amyotrophic lateral sclerosis; BO, bulbar-onset; SFA, skinfold abdomen (mm); SFB, skinfold biceps (mm); SFC, skinfold chest (mm); SFSUB, skinfold subscapular (mm); SFSUP, skinfold supra-iliac (mm); SFT, skinfold triceps (mm); W, weight (kg); %BF, percentage body fat.
DXA
DXA was considered to be the criterion method against which percentage body fat, and determinations of FM and LBM from anthropometric equations, were compared. Although originally designed to measure bone density, DXA accurately measures FM, fat-free mass (FFM), and bone mass in healthy subjects (26) and has been used in subjects with neuromuscular disorders, including in ALS subjects, in cross-sectional and longitudinal analyses to measure body composition (5, 20, 27–31). The intertrial variability of FM and FFM measured by DXA at our centers is <5%. The equations used to compute FM, FFM, and bone density from DXA scans are proprietary.
DXA was performed in subjects at 4 sites (the Columbia University, NY site did not undertake DXA measurements). The Hologic Discovery Unit with software version 12.7 (Hologic) was used at 1 site (Penn State University, Hershey, PA) and the GE Lunar Prodigy machine with software version 13.10.z (GE) was used at the other 3 sites.
LBM and FFM
Estimates of LBM computed by anthropometric equations include the weight of internal organs, bones, muscles, ligaments, tendons, and the essential fat in organs, central nervous system, and the bone marrow. The weight of nonessential or storage fat in subcutaneous adipose tissue and around internal organs is not included in LBM. FFM measured by DXA is obtained by subtracting the weight of the essential fat from LBM; thus, DXA measures FM, FFM, and bone mass separately.
Creation of the ALS-specific equation in Cohort #1
Stepwise linear regression analysis was used to develop a best-fit equation to predict percentage body fat in ALS subjects, using clinical elements routinely recorded at ALS clinic visits. Factors considered were age, sex, weight, height, BMI, ALSFRS-R, %FVC, disease duration from onset of symptoms to baseline visit, and site of onset (in bulbar or limb regions).
Validation of body composition from the ALS-specific equation against DXA in Cohort #2
The percentage body fat, FM, and LBM computed by the experimentally derived ALS-specific equation from participants in Cohort #1 and from results using 3 published anthropometric equations were compared to the reference DXA standard. Bland–Altman analysis was used to examine how closely the values from the equations matched the DXA-measured values (32). Skinfold measurements were not obtained in subjects from Cohort #2.
Relation of body composition to disease progression and survival in Cohort #3
Body composition was computed at baseline, and 6 mo after baseline, to evaluate changes in BMI, %FVC, and ALSFRS-R scores. This allowed examination of the relation of FM and LBM computed at baseline, when dichotomized into groups above and below the median, to disease severity and clinical progression. We examined the effect of body composition at baseline on Kaplan–Meier survival curves, after adjusting for other known prognostic variables in the disease. We also evaluated the association of FM loss with LBM loss, disease progression, and survival.
Statistical methods
We used the chi-square test and t tests to compare demographics and measures of disease severity in the 3 cohorts. We compared the computed FM and LBM values in Cohort #1 to DXA-measured values using paired t tests and Pearson correlation coefficients. The null hypothesis that the mean difference between the computed and DXA-measured values was not different from 0 was tested using paired t tests. We used paired t tests and Pearson correlation coefficients to compare estimated body composition with DXA-measured values in Cohort #2, for validation of the ALS-specific equation. We used Bland–Altman plots to assess the degree of agreement between the estimated body composition and DXA-measured values in Cohort #2. We evaluated bias in the estimation by examining the mean difference between estimated and measured values (32). Using paired t tests we examined the effect of important baseline prognostic characteristics and body composition measures on progression of clinical disease. We examined the effect of computed body composition on survival in Cohort #3 using Kaplan–Meier survival curves, and via survival analysis creating HRs and 95% CIs using the Cox proportional hazards method with adjustment for other prognostic variables. We accepted significance at the P ≤ 0.05 level.
Ethics
All subjects provided informed consent. Research was conducted with approval of the UVM Committee on Human Research in the Medical Sciences and the UKY Institutional Review Board, in accordance with the ethical standards of these bodies and with the principles of the Declaration of Helsinki of 1975, as revised in 1983.
Results
Subject enrollment in cohorts
Data from a total of 364 ALS subjects from the 3 cohorts were examined. The distribution and origin of subject numbers were as follows: 29 in Cohort #1 (test cohort); 104 in Cohort #2 (validation cohort) (21 from UVM-GCRC, 35 from UKY-GCRC, and 48 from the NINDS-funded study); and 314 in Cohort #3 (70 from the NINDS-funded study, 35 from UKY-GCRC, and 209 from the UVMMC ALS clinic). DXA data from the 48 NINDS-funded study subjects were used in Cohort #2 to validate the ALS-specific equation, whereas clinical and computed body composition data from the 70 subjects in the NINDS-funded study were included in Cohort #3 to measure disease progression and survival. Thus, there was some overlap of subjects between Cohort #2 and Cohort #3, but there was no dual representation of data from these overlapping subjects, because only DXA data were used in Cohort #2 and only clinical data were used in Cohort #3. In Cohort #3, the numbers of subjects across the baseline and follow-up visits are not the same. After the baseline visit, 213 subjects (134 males and 79 females) were evaluated at ∼6 mo. Follow-up data were missing in the remainder, due to either no visit at this time point, or death.
Baseline demographic features
The demographic characteristics of the participants from the 3 cohorts were generally comparable, except that subjects in Cohorts #2 and #3 had shorter disease duration and higher weight and BMI than subjects in Cohort #1 (Table 2).
TABLE 2.
Demographic data in the 3 cohorts of ALS subjects at the baseline visit1
| Comparison, P value2 | |||||
|---|---|---|---|---|---|
| Cohort #1 (n = 29) | Cohort #2 (n = 104) | Cohort #3 (n = 314) | Cohort #1 vs. Cohort #2 | Cohort #1 vs. Cohort #3 | |
| Males | 72 | 63 | 65 | 0.32 | 0.41 |
| Site of onset | 0.12 | 0.13 | |||
| Limb | 83 | 70 | 70 | ||
| Bulbar | 13 | 29 | 28 | ||
| Axial | 4 | 1 | 2 | ||
| Limb + bulbar | 0 | 0 | 0.4 | ||
| Age at 1st visit, y | 57.4 ± 14.0 | 59.1 ± 10.9 | 60.1 ± 12.6 | 0.50 | 0.28 |
| Median disease duration at 1st visit, mo | 24 | 15 | 17.4 | 0.03 | 0.03 |
| Height, cm | 169 ± 11 | 172 ± 10 | 171 ± 10 | 0.22 | 0.43 |
| Weight, kg | 70.6 ± 12.5 | 82.2 ± 18.2 | 78.2 ± 17.4 | <0.001 | 0.01 |
| BMI, kg/m2 | 24.6 ± 3.7 | 27.6 ± 5.0 | 26.6 ± 4.8 | <0.001 | 0.01 |
| ALSFRS-R score | 37.3 ± 6.0 | 36.9 ± 5.4 | 37.1 ± 5.8 | 0.72 | 0.83 |
| Predicted FVC3 | 86.3 ± 23.8 | 80.6 ± 17.6 | 81.1 ± 22.3 | 0.23 | 0.23 |
All values are percentages or means ± SDs, unless indicated otherwise. ALS, amyotrophic lateral sclerosis; ALSFRS-R, ALS functional rating scale-revised (normal = 48); FVC, forced vital capacity.
P values are from t tests.
Percentage corrected for age, sex, and height.
Cohort #1
Body composition from anthropometrics compared to DXA
FM
Among the 3 sets of equations created for use in healthy subjects, the Jackson and Pollock equations significantly underestimated percentage body fat and computed FM, as compared to DXA (Table 3). Pearson's correlation coefficients against DXA-measured values were ≥0.75 for computed values from all 3 sets of equations. The computed values of percentage body fat and FM were within 2%–6% of DXA, and the differences from DXA were the lowest for the Deurenberg equations (Table 3).
TABLE 3.
Comparison of DXA-measured and anthropometrically derived body composition in ALS subjects from Cohort #1 (test cohort)1
| Equation | Mean ± SD | Difference from DXA | Ratio test equation/DXA | P value2 | Pearson's correlation (P value) |
|---|---|---|---|---|---|
| Body fat, % | |||||
| DXA | 29.0 ± 10.5 | ||||
| Jackson and Pollock | 22.9 ± 9.1 | 6.1 ± 5.2 | 0.79 | <0.001 | 0.87 (<0.001) |
| Durnin and Womersley | 27.2 ± 8.1 | 1.8 ± 4.7 | 0.94 | 0.09 | 0.90 (<0.001) |
| Deurenberg et al. (BMI) | 29.6 ± 7.0 | −0.9 ± 6.3 | 1.02 | 0.43 | 0.75 (<0.001) |
| FM, kg | |||||
| DXA | 19.6 ± 6.8 | ||||
| Jackson and Pollock | 15.6 ± 6.0 | 3.8 ± 3.9 | 0.80 | <0.001 | 0.86 (<0.001) |
| Durnin and Womersley | 18.7 ± 6.1 | 0.7 ± 3.0 | 0.95 | 0.29 | 0.92 (<0.001) |
| Deurenberg et al. (BMI) | 20.8 ± 5.6 | −1.2 ± 4.0 | 1.06 | 0.12 | 0.81 (<0.001) |
| FFM or LBM, kg | |||||
| DXA3 | 46.3 ± 10.0 | ||||
| Jackson and Pollock4 | 53.1 ± 10.2 | −8.3 ± 4.6 | 1.15 | <0.001 | 0.94 (<0.001) |
| Durnin and Womersley4 | 50.0 ± 10.2 | −5.2 ± 3.2 | 1.08 | <0.001 | 0.95 (<0.001) |
| Deurenberg et al. (BMI)4 | 49.8 ± 10.2 | −3.5 ± 4.5 | 1.07 | <0.001 | 0.90 (<0.001) |
n = 29. Values are means ± SDs, unless indicated otherwise. BMI in kg/m2. ALS, amyotrophic lateral sclerosis; FFM, fat-free mass; FM, fat mass; LBM, lean body mass.
P values are from paired t tests, compared to DXA.
FFM from DXA.
LBM from equations. The sum of FM and FFM from DXA is lower than the sum of FM and LBM from equations, because DXA calculates bone mass separately, whereas LBM includes bone mass.
LBM
All 3 sets of equations created for use in healthy subjects significantly overestimated LBM, as compared to DXA-measured FFM, because DXA measures bone mass separately, whereas LBM includes bone mass; the smallest mean difference was with the Deurenberg equations (Table 3). Pearson's correlation coefficients between estimated LBM and DXA-measured FFM were ≥0.90 for all 3 sets of equations. The computed values of LBM were within ≤7% of DXA-measured FFM, and the difference from DXA was the lowest for the Deurenberg equations (Table 3).
Creation of an ALS-specific equation to compute body composition
An equation incorporating sex, weight, BMI, and site of onset of ALS was most predictive in accurately estimating percentage body fat in Cohort #1, using stepwise linear regression (Table 1). The best-fit ALS-specific equation to predict percentage body fat was as follows:
 |
(9) |
where gender = 1 if male, 0 if female; and bulbar-onset = 1, limb-onset = 0.
Cohort #2: validation of the ALS-specific equation
We then compared the performance of our derived ALS-specific equation to estimate percentage body fat against 3 published sets of equations to compute FM and LBM. When compared with DXA-measured values, the ALS-specific equation underestimated FM by a mean of 0.2 kg (1.4%) and overestimated LBM by 2.5 kg (6.1%) (Table 4). Pearson's correlation coefficients between DXA-measured FM and ALS-specific equation–computed FM were 0.86 at baseline and 0.92 at follow-up. Body composition values computed by the ALS-specific equation were within 1%–5% of those measured by DXA (Table 4). Bland–Altman analysis showed computed FM from the ALS-specific equation at baseline was within 2 SDs of DXA-measured values in 95% of subjects (Figure 2A). However, the ALS-specific equation tended to underestimate FM when measured values were low, and overestimate FM when measured values were high. Bland–Altman analysis also revealed computed LBM from the ALS-specific equation to be within 2 SDs of DXA-measured FFM values in 95% of subjects (Figure 2B).
TABLE 4.
Comparison of FM and FFM computed using the ALS-specific equation and best-performing Deurenberg equations with DXA-measured values in Cohort #2 subjects (validation cohort)1
| Mean ± SD, kg | Difference from DXA, kg | Ratio test equation/DXA | P value2 | Pearson's correlation (P value) | |
|---|---|---|---|---|---|
| FM | |||||
| DXA | 29.7 ± 11.1 | ||||
| ALS-specific equation | 29.5 ± 14.0 | −0.2 ± 7.0 | 0.99 | 0.74 | 0.87 (<0.001) |
| Deurenberg equations | 28.7 ± 10.3 | −1.0 ± 5.7 | 0.97 | 0.07 | 0.86 (<0.001) |
| FFM or LBM | |||||
| DXA3 | 50.0 ± 11.7 | ||||
| ALS-specific equation4 | 52.5 ± 11.4 | 2.5 ± 5.9 | 1.05 | <0.001 | 0.87 (<0.001) |
| Deurenberg equations4 | 53.3 ± 12.1 | 3.3 ± 5.2 | 1.07 | <0.001 | 0.90 (<0.001) |
n = 104. Values are means ± SDs, unless indicated otherwise. ALS, amyotrophic lateral sclerosis; FFM, fat-free mass; FM, fat mass; LBM, lean body mass.
P values are from paired t tests, compared with DXA.
FFM from DXA.
LBM from equations. The sum of FM and FFM from DXA is lower than the sum of FM and LBM from equations, because DXA calculates bone mass separately, whereas LBM includes bone mass.
FIGURE 2.

Bland–Altman plots of FM and FFM measured by DXA, and FM and LBM computed using the ALS-specific and Deurenberg equations at baseline visit in Cohorts #1 and #2 (n = 104). (A, B) FM and LBM from ALS-specific equation; 95% of values within 2 SD of DXA. (C) FM from Deurenberg equations; 96% of values within 2 SD of DXA. (D) LBM from Deurenberg equations; 95% of values within 2 SD of DXA. ALS, amyotrophic lateral sclerosis; FFM, fat-free mass; FM, fat mass; LBM, lean body mass.
To compare body composition computed from the ALS-specific equation, we chose the Deurenberg equations, because the absolute FM and LBM values showed the lowest absolute differences from DXA among the 3 sets of anthropometric equations used in subjects from Cohort #1 (Table 3). Further, anthropometric skinfold data were unavailable in the clinic subjects (Cohort #3), precluding use of the other 2 sets of equations, but the Deurenberg equations could still be used to compute body composition from height, weight, and age. Bland–Altman analysis of data from the Deurenberg equations showed computed FM to be within 2 SDs of DXA-measured values in 96% of subjects (Figure 2C) and computed LBM to be within 2 SDs of DXA-measured values in 95% of subjects (Figure 2D). Estimated FM and LBM from the ALS-specific equation showed smaller absolute differences from DXA than did values obtained using the Deurenberg equations (Table 4).
Cohort #3
Baseline BMI and dichotomized FM and LBM
Body composition in all subjects at baseline was dichotomized into below and above median groups in the 5 recognized WHO BMI categories: <20 (malnourished, n = 18), 20–25 (normal, n = 101), 26–30 (overweight, n = 128), 31–35 (class I obese, n = 45), and >35 (class II obese, n = 20). More males populated the higher BMI categories than females (P < 0.001, Wilcoxon test). Both computed FM and LBM were low in all subjects with BMI < 20, in 64% of subjects with BMI 20–25, and in none with BMI > 30. Supplemental Table 1 gives the distribution of the frequency of low and high FM and LBM in the 5 BMI categories.
Change in BMI and body composition in ALS: relation to clinical progression over 6 mo
All subjects
Tables 5 and 6 give changes in computed body composition at 6 mo using the ALS-specific and Deurenberg equations, and in clinical endpoints. Overall, the mean reduction in ALSFRS-R score and %FVC was greater in subjects who lost >2.5% of FM than in those who gained >2.5% or showed stable (≤2.5% change) FM (Table 6). Mean decline in clinical function was significantly greater in the group that lost FM over 6 mo than in the group with stable/increased FM, when computed by either our ALS-specific equation or the Deurenberg equations (Table 6). Pearson correlation coefficients between changes in clinical functional measures (BMI, ALSFRS-R score, and %FVC) and body composition computed by the ALS-specific and Deurenberg equations were modest, albeit statistically significant, and generally comparable between the equations (data not shown). The 6-mo decline in body composition was independent of age (≤40 compared with >40 y), site of onset of ALS (bulbar- or limb-onset), disease duration (≤12 compared with >12 mo), use of riluzole, or interim need for noninvasive ventilation (NIV) or percutaneous endoscopic gastrostomy (PEG) (data not shown).
TABLE 5.
Changes in ALS clinical disease progression measures and body composition computed using the ALS-specific equation 6 mo after baseline visit in male and female subjects from Cohort #31
| Baseline | 6 mo | Difference, 6 mo–baseline | Annualized percentage change | P value2 | |
|---|---|---|---|---|---|
| All subjects (n = 213) | |||||
| BMI | 27.1 ± 4.7 | 26.3 ± 4.7 | −0.8 ± 2.0 | −5.9 | <0.001 |
| ALSFRS-R | 38.2 ± 5.4 | 33.9 ± 7.2 | −4.5 ± 5.7 | −29.8 | <0.001 |
| %FVC | 85.2 ± 20.3 | 75.3 ± 27.3 | −11.9 ± 19.9 | −27.9 | <0.001 |
| FM—ALS-specific equation, kg | 27.4 ± 12.7 | 25.7 ± 12.2 | −1.7 ± 4.5 | −12.4 | <0.001 |
| LBM—ALS-specific equation, kg | 52.1 ± 11.4 | 51.6 ± 11.2 | −0.5 ± 1.5 | −1.9 | <0.001 |
| FM—Deurenberg equations, kg | 27.3 ± 9.8 | 25.9 ± 9.4 | −1.5 ± 3.9 | −10.9 | <0.001 |
| LBM—Deurenberg equations, kg | 52.2 ± 11.6 | 51.4 ± 11.4 | −0.8 ± 2.0 | −3.0 | <0.001 |
| Males (n = 134) | |||||
| BMI | 27.7 ± 4.1 | 26.8 ± 4.3 | −1.0 ± 1.9 | −7.2 | <0.001 |
| ALSFRS-R | 37.5 ± 5.6 | 32.7 ± 5.8 | 4.8 ± 6.0 | −32.5 | <0.001 |
| %FVC | 82.2 ± 23.6 | 70.1 ± 19.5 | 12.7 ± 20.5 | −30.9 | <0.001 |
| FM—ALS-specific equation, kg | 26.0 ± 11.7 | 24.1 ± 11.8 | −2.0 ± 4.1 | −15.4 | 0.004 |
| LBM—ALS-specific equation, kg | 60.3 ± 4.4 | 59.6 ± 4.7 | −0.8 ± 1.7 | −2.7 | 0.14 |
| FM—Deurenberg equations, kg | 26.8 ± 8.8 | 25.0 ± 9.0 | −1.8 ± 3.7 | −13.4 | <0.001 |
| LBM—Deurenberg equations, kg | 59.6 ± 7.3 | 58.4 ± 7.6 | −1.2 ± 2.2 | −4.0 | <0.001 |
| Females (n = 79) | |||||
| BMI | 26.1 ± 5.6 | 25.6 ± 5.2 | −1.2 ± 5.3 | −2.6 | 0.05 |
| ALSFRS-R | 36.4 ± 6.2 | 32.2 ± 5.7 | 4.0 ± 5.3 | −28.2 | <0.001 |
| %FVC | 79.1 ± 19.5 | 68.4 ± 18.6 | 10.8 ± 18.3 | −27.3 | <0.001 |
| FM—ALS-specific equation, kg | 29.7 ± 13.9 | 28.5 ± 12.4 | −1.2 ± 5.0 | −8.0 | 0.003 |
| LBM—ALS-specific equation, kg | 38.3 ± 3.4 | 38.2 ± 3.6 | −0.1 ± 1.5 | −0.5 | 0.015 |
| FM—Deurenberg equations, kg | 28.2 ± 11.3 | 27.2 ± 10.0 | −1.0 ± 13.1 | −7.1 | 0.04 |
| LBM—Deurenberg equations, kg | 39.7 ± 5.3 | 39.5 ± 5.4 | −0.2 ± 1.4 | −1.0 | 0.16 |
All values are means ± SDs, unless indicated otherwise. BMI in kg/m2. ALS, amyotrophic lateral sclerosis; ALSFRS-R, ALS functional rating scale-revised (normal = 48); FM, fat mass; LBM, lean body mass; %FVC, forced vital capacity (corrected for age, sex, and height).
P values are from paired t tests, 6 mo compared with baseline.
TABLE 6.
Progression of clinical measures in relation to changed or stable body composition over 6 mo in subjects from Cohort #31
| Change in clinical measures (6 mo–baseline) | ||||
|---|---|---|---|---|
| Body composition | Weight, kg | BMI, kg/m2 | ALSFRS-R | Predicted FVC2 |
| By ALS-specific equation | ||||
| FM reduction > 2.5% | −5.9 ± 4.8 | −2.0 ± 1.7 | −5.9 ± 6.2 | −14.8 ± 19.8 |
| FM stable or gained | 2.2 ± 2.4 | 0.8 ± 0.9 | −3.1 ± 4.6 | −8.8 ± 19.6 |
| P value3 | <0.001 | <0.001 | 0.001 | 0.04 |
| LBM reduction > 2.5% | −8.2 ± 4.7 | −2.7 ± 1.7 | −8.3 ± 7.5 | −21.8 ± 19.4 |
| LBM stable or gained | 0.7 ± 4.8 | 0.3 ± 1.7 | −3.5 ± 4.6 | −9.7 ± 18.6 |
| P value3 | <0.001 | <0.001 | <0.001 | 0.001 |
| By Deurenberg equations | ||||
| FM reduction > 2.5% | −6.1 ± 4.9 | −2.1 ± 1.6 | −6.0 ± 6.3 | −15.2 ± 20.1 |
| FM stable or gained | 2.0 ± 2.5 | 0.7 ± 0.9 | −3.1 ± 4.6 | −8.7 ± 19.3 |
| P value3 | <0.001 | <0.001 | <0.001 | 0.03 |
| LBM reduction > 2.5% | −7.8 ± 5.1 | −2.6 ± 1.8 | −7.4 ± 7.1 | −17.3 ± 19.7 |
| LBM stable or gained | 0.3 ± 3.7 | 0.1 ± 1.4 | −3.3 ± 4.5 | −9.8 ± 19.4 |
| P value3 | <0.001 | <0.001 | <0.001 | 0.02 |
n = 213. Values are means ± SDs unless indicated otherwise. ALS, amyotrophic lateral sclerosis; ALSFRS-R, ALS functional rating scale-revised (normal = 48); FM reduction, >2.5% decrease in fat mass compared with baseline; FM stable or gained, <2.5% decrease or an increase in fat mass compared with baseline; FVC, forced vital capacity; LBM reduction, >2.5% decrease in lean body mass compared with baseline; LBM stable or gained, <2.5% decrease or an increase in lean body mass compared with baseline.
Percentage corrected for age, sex, and height.
P values are from t tests comparing FM reduction > 2.5% with FM stable or gained groups.
Males and females
Although loss of weight and change in body composition over 6 mo were seen in both males and females, the magnitude of the changes was greater in males (Table 5). The annualized average percentage decrease in both FM and LBM, extrapolated from 6-mo data, was severalfold greater in males than in females. Also, males who lost FM compared with those who demonstrated increased or stable FM showed greater decline of mean ALSFRS-R score (−6.4 ± 6.3 compared with −2.8 ± 4.9 units, P = 0.001), and a trend toward a larger decrease in mean %FVC (−15.4 ± 22.2 compared with −9.0 ± 18.4, P = 0.10) than females, at 6 mo.
Relative change in weight and body composition at 6 mo
We determined the relation between weight stability/gain compared with weight loss, and changes in body composition (Figure 3). Overall, 48% of subjects lost weight over 6 mo, 19% gained weight, and 33% showed stable weight. In subjects who lost weight, FM universally declined, whereas the converse was true in those who gained weight. Even in those with stable weight, FM declined in 23% of these subjects. In subjects who lost weight, LBM decreased in 43%, was stable in 51%, and increased in 6%. Conversely, with weight gain, LBM increased in 25% and was stable in 75% of subjects.
FIGURE 3.

Relation between 6-mo change in weight and body composition computed using the ALS-specific equation in Cohort #3 (n = 213). D, decreased by >2.5%; FM, fat mass; I, increased by >2.5%; LBM, lean body mass; S, stable with <2.5% change in either direction.
Correlations between change in weight, body composition, and clinical measures at 6 mo
In general, we observed a strong correlation between loss of weight and FM over 6 mo, but a weaker correlation between loss of weight and decline of LBM. Weight loss showed a robust correlation with change in FM (r = 0.98 in females and r = 0.91 in males, P < 0.0001 for both), and a stronger correlation with loss of LBM in males (r = 0.71, P < 0.001) than in females (r = 0.34, P = 0.002). The change in FM and LBM showed a moderate correlation (r = 0.77, P < 0.001), which was stronger in males (r = 0.87, P < 0.001) than in females (r = 0.59, P < 0.001).
Changes in ALSFRS-R score showed modest correlations with changes in FM (r = 0.40) and LBM (r = 0.42) in males (P < 0.001 for both), and with FM only in females (r = 0.42, P = 0.0007); changes in FVC were only weakly correlated with body composition in males (r = 0.20, P = 0.03 for FM; r = 0.32, P = 0.0007 for LBM).
Body composition at baseline and survival
BMI groups
There was no effect of baseline BMI groups dichotomized above and below the median on survival. However, compared with the group with BMI < 20, the unadjusted median survival progressively increased in the groups with BMI 20–25, 26–30, and 31–35, but decreased in the group with BMI > 35 (P = 0.01, log-rank test) (Figure 4). The mortality at 12 mo was 44%, 32%, 27%, 18%, and 10% in these BMI categories, respectively (P = 0.01, log-rank test).
FIGURE 4.

Kaplan–Meier survival curves in the WHO BMI categories at baseline visit in Cohort #3 (n = 314). The median survival is significantly shorter in the BMI < 20 group than in the other groups (P = 0.01, log-rank test). The dotted vertical line is at the 12-mo time point on the x axis.
Body composition
Using the ALS-specific equation
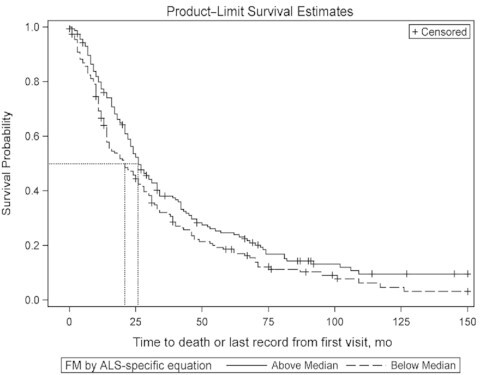
The effect of FM on survival was examined (Figure 5). In this cohort, the median FM was 23.5 kg. Median survival was 26 mo in the above median group, and 21 mo in the below median group (P = 0.04, log-rank test). The adjusted Cox proportional HR for death in the below median group was 1.39 (95% CI: 1.07, 1.80) (P = 0.01) after adjusting for age, time from onset of symptoms to baseline visit, ALSFRS-R score at baseline, and %FVC at baseline. In subjects in the above median group for FM, the survival effect showed a trend in females (n = 110, P = 0.06), but was not significant in males (n = 202, P = 0.38).
FIGURE 5.

Kaplan–Meier survival curves in above and below median groups of FM computed at baseline visit using the ALS-specific equation in Cohort #3 (n = 314). The dotted lines represent the median survival probability on the y axis, and the duration of survival on the x axis. The survival in the above and below median groups is 26 and 21 mo, respectively (P = 0.04, log-rank test). The adjusted Cox proportional HR for death in the below median group for baseline FM is 1.39 (95% CI: 1.07, 1.80; P = 0.01). ALS, amyotrophic lateral sclerosis; FM, fat mass.
The median LBM in this cohort was 56.2 kg; there was no effect of baseline LBM on either Kaplan–Meier survival or 12-mo mortality (data not shown).
Using the Deurenberg equations
The median FM by this method was 25.0 kg. There was no difference in median survival in the above and below median groups. The median LBM by this technique was 52.6 kg. Median survival was 27 mo and 21 mo in the above and below median groups, respectively (P = 0.03, log-rank test). The adjusted Cox proportional HR for death in the below median group was 1.30 (95% CI: 1.02, 1.65) (P = 0.04) after adjusting for age, time from onset of symptoms to baseline visit, ALSFRS-R score at baseline, and %FVC at baseline.
Six-month change in body composition and survival
BMI
The median decline in BMI over 6 mo from baseline was 0.51 units in the overall group, 0.67 in males, and 0.21 in females. Median survival in the group with BMI loss below the median (i.e., less reduction in BMI) was 42 mo compared with 22 mo in the group above the median (P < 0.001, log-rank test). After adjusting for age, time from onset of symptoms to baseline visit, ALSFRS-R score and %FVC at baseline, and the 6-mo change in ALSFRS-R score and %FVC, the Cox proportional HR for death in the group that lost more BMI was 1.92 (95% CI: 1.33, 2.77; P < 0.001). The survival benefit was only seen in males who experienced less BMI reduction (41 compared with 23 mo, P < 0.001, log-rank test) and the adjusted HR for death in the male group that showed greater loss of BMI was 2.44 (95% CI: 1.67, 3.58; P < 0.001). Cox proportional hazards regression showed that the HR for death using BMI loss as a continuous measure was 1.14 (95% CI: 1.07, 1.21; P < 0.001).
Body composition
Using the ALS-specific equation
The median decline in FM was 0.95 kg over 6 mo. Median survival in the group that showed FM reduction below the median (i.e., less loss of FM) was 39 mo, compared with 23 mo in the group above the median (P < 0.001) (Figure 6). After adjusting for age, time from onset of symptoms to baseline visit, ALSFRS-R score and %FVC at baseline, and the 6-mo change in ALSFRS-R score and %FVC, the Cox proportional HR for death in the group that lost more FM was 1.87 (95% CI: 1.30, 2.69; P < 0.001). The survival benefit was seen only in males (46 mo below median compared with 23 mo above median, P < 0.001); the HR for death in the group that showed greater reduction of FM was 2.08 (95% CI: 1.43, 3.04; P < 0.001). Cox proportional hazards regression showed that the HR for death using FM loss as a continuous measure was 1.08 (95% CI: 1.04, 1.12; P < 0.001).
FIGURE 6.

Kaplan–Meier survival curves in above and below median groups of 6-mo decline in FM computed using the ALS-specific equation in Cohort #3 (n = 213). The dotted lines represent the median survival probability on the y axis, and duration of survival on the x axis. The survival in the above median (i.e., greater loss) and below median groups is 23 and 39 mo, respectively (P < 0.001). The adjusted Cox proportional HR for death in the above median group for FM loss is 1.87 (95% CI: 1.30, 2.69; P < 0.001). ALS, amyotrophic lateral sclerosis; FM, fat mass.
We further examined the implication of change compared with relative stability of FM over 6 mo on survival. Median survival was significantly shorter in the group that lost >2.5% of FM than in the group that showed increased/stabilized FM (23 compared with 46 mo, P < 0.001). The Cox proportional HR for death in the group that lost FM was 1.90 (95% CI: 1.32, 2.75) (P < 0.001), after adjusting for age, time from onset of symptoms to baseline visit, ALSFRS-R score and %FVC at baseline, and the 6-mo change in ALSFRS-R score and %FVC. The 12-mo mortality was almost 3-fold greater in the group that lost than in the group that increased/stabilized FM (18.0% compared with 6.3%, P < 0.01). The survival disadvantage in the group that lost FM was seen only in males, with an unadjusted HR of 2.44 (95% CI: 1.64, 3.63; P < 0.001).
Using the ALS-specific equation, the median reduction of LBM was 0.19 kg. Median survival was 39 mo in the group that showed LBM decrease below the median, compared with 23 mo in the group above the median (P < 0.001) (Figure 7). After adjusting for age, time from onset of symptoms to baseline visit, ALSFRS-R score and %FVC at baseline, and the 6-mo change in ALSFRS-R score and %FVC, the Cox proportional HR for death in the group that lost greater LBM was 1.73 (95% CI: 1.20, 2.49; P = 0.003). The survival benefit with less loss of LBM was seen only in males (52 mo below median compared with 21 mo above median, P < 0.001). The HR for death in the group that lost more LBM was 3.05 (95% CI: 2.07, 4.50; P < 0.001). Cox proportional hazards regression showed that the HR for death using LBM loss as a continuous measure was 1.13 (95% CI: 1.07, 1.19; P < 0.001).
FIGURE 7.

Kaplan–Meier survival curves in above and below median groups of 6-mo decline in LBM computed using the ALS-specific equation in Cohort #3 (n = 213). The dotted lines represent the median survival probability on the y axis, and the duration of survival on the x axis. The survival in the above median (i.e., greater loss) and below median groups is 23 and 39 mo, respectively (P < 0.001). The adjusted Cox proportional HR for death in the above median group for LBM loss is 1.73 (95% CI: 1.20, 2.49; P = 0.003). ALS, amyotrophic lateral sclerosis; LBM, lean body mass.
Using the Deurenberg equations
The median reduction of FM was 0.89 kg. Median survival in the FM change group below the median was 42 mo, compared with 22 mo in the group above the median (P < 0.001). After adjustment for age, time from onset of symptoms to baseline, ALSFRS-R score and %FVC at baseline, and the 6-mo change in ALSFRS-R score and %FVC, the Cox proportional HR for death in the group that showed greater decline was 1.79 (95% CI: 1.39, 2.57; P = 0.002).
The median reduction of LBM was 0.45 kg. Median survival in the LBM change group below the median was 39 mo, compared with 22 mo in the group above the median (P < 0.001). After adjustment for age, time from onset of symptoms to baseline, ALSFRS-R score and %FVC at baseline, and the 6-mo change in ALSFRS-R score and %FVC, the Cox proportional HR for death in the group that showed greater decline was 1.69 (95% CI: 1.17, 2.43; P = 0.005). The survival disadvantage with greater loss of FM and LBM was seen only in males.
The effect of 12-mo declines in FM and LBM on survival was similar to that of reductions at 6 mo (data not shown).
Discussion
Our study reconfirmed that BMI is a global indicator survival in ALS patients, as reported by others (2, 7). We reaffirmed that mild obesity (33–35) or supplemental feeding to support BMI (36–39) is beneficial and improves longevity. However, BMI is an aggregate measure of bodily stature, many components of which may be negatively affected during the progressive course of ALS neurodegeneration.
Based on an understanding of the pathophysiology of ALS responsible, and on limited prior research, we hypothesized that changes in BMI result from several interconnected processes. First is denervation of skeletal muscle after degeneration of spinal motor neurons. Voluntary skeletal muscle accounts for ∼40% of LBM, and after denervation undergoes atrophy and becomes inactive. Second, if an ALS patient fails to consume sufficient energy to match energy expenditure, then both FM and FFM are catabolized to compensate for the deficit in oral energy intake. Clearly, both neurogenic muscle atrophy and catabolism of fat and muscle for energy will be reflected in weight loss, but these dynamic changes in individual body compartments will not be resolved by global BMI determination.
Our study provides important insights and guidance for a more structured approach to nutritional management of this complex patient population. We developed an equation to compute FM and LBM, and validated the results against DXA analysis of body composition. In addition, we demonstrated that the equations developed by Deurenberg et al. (24) in normal subjects compute FM and LBM in ALS patients satisfactorily, whereas other published equations do not. Next, we established that a single determination of FM at an initial clinic visit conveys prognostic significance for survival, demonstrating that subjects with lower FM had worse survival, providing a more granular interpretation of the related finding of a low BMI.
However, longitudinal determination of FM and LBM emphasizes the importance of these findings more completely. We demonstrated that weight loss in ALS is invariably associated with a decrease in both FM and LBM (Figure 3). Clearly, loss of body fat in the setting of ALS is due to inadequate oral energy intake relative to energy requirements. Furthermore, based on data from the Minnesota study of experimental starvation (40), the inescapable conclusion is that in these ALS participants some loss of skeletal muscle (FFM) was also due to catabolism of muscle for energy, and not simply due to neurogenic atrophy. This critical result represents a preventable loss of skeletal muscle, due to undernutrition, that is superimposed onto denervation atrophy from death of spinal motor neurons. Neither the ALS patient nor the treating physician would be able to distinguish the origin of the weakness. Importantly, stable body weight over 6 mo was still associated with a decrease in FM in 23% of subjects, indicating that some energy insufficiency was still present in this subgroup.
The Minnesota study also teaches that our findings offer an opportunity to prevent the loss of function in ALS. In that historic study, simple restriction of energy intake caused both loss of FM and FFM with resulting muscle atrophy, weakness, reduced work output, and fatigue (40). For ALS subjects, the consequences of nutritional muscle atrophy and subsequent functional losses are additive, and superimposed onto neurogenic muscle atrophy, which is intrinsic to the pathophysiology of ALS.
Therefore, early and aggressive nutritional intervention to meet energy expenditure can prevent caloric malnutrition and fundamentally modulate the accelerated negative course of ALS seen in those who fail to meet their basic nutritional needs. In addition to weight gain resulting from caloric supplementation some prior research demonstrated that increased FM was associated with concomitant slowing of functional loss (39) or prolongation of survival (36, 37). A recent controlled trial with a high-fat/high-calorie diet modulated weight loss and prolonged survival in fast-progressing ALS patients; body composition was not examined to understand the basis for this effect (41).
In our study the negative prognostic significance of FM loss on survival was clear, highly significant, and corroborated the effects of FM loss reported by others on modulating disease severity and progression (42, 43). In keeping with the survival benefit endowed by higher FM, a recent study of DXA showed a significant correlation of declining FM with disease progression (44). As seen in Figure 6, greater FM loss was associated with a 16-mo decrease in mean survival. Similarly, loss of LBM longitudinally was also associated with poorer survival. Together, these results focus on the importance of stabilizing FM as a physiological energy reserve, and strongly endorse FM as a clinical criterion to guide and confirm the efficacy of nutritional intervention. In a research setting, we demonstrated the importance of body composition and functional movement as disclosed by the ALSFRS-R, and reported a predictive equation to estimate daily energy expenditure (20). The present work is complementary inasmuch as this provides a method to measure patient compliance with nutritional recommendations, and an efficacy measurement of stability of the FM compartment over time. This naturally suggests the hypothesis that by doing so, one might thereby preserve FFM, stabilize physical function, and extend survival in this disorder.
The greater degradation of body composition in males, resulting in faster progression and shortened survival in our study, is worthy of discussion. The precise reason for this gender effect is not clear, but may relate to dimorphism in body composition and in the concentrations of circulating adipokines, leptin and adiponectin, which are secreted by adipose tissue and regulate FM and energy balance (45). By virtue of having higher FM and circulating leptin concentrations (46), females possess higher energy reserves (47). Males have less FM, lower circulating leptin concentrations (46), and more of the metabolically active FFM. Thus, males may be more dependent on oral intake to maintain energy balance, producing earlier and more frequent demands on energy stored in fat and skeletal muscle, which may explain the accelerated FM and LBM decline.
The challenges of managing ALS are protean, requiring intervention with multiple assistive devices to improve function, and with noninvasive ventilation to augment impaired breathing. Although the potential for negative energy balance has long been recognized, only recently have equations been described to formulate targets for energy intake (20). Small studies provided evidence to support strategies for improving energy balance, with nutrition delivered via PEG tube feedings or high-fat/high-calorie dietary intakes [(37–39); reviewed in (48)]. Nevertheless, ALS subjects are frequently hesitant to initiate these interventions, arguing that they will get a PEG “when I really need it,” frequently meaning when they can no longer swallow. The results of our study pointedly illustrate the perils of this approach. Clearly, loss of weight over 6 mo is universally associated with loss of FM, indicating failure of adequate energy intake via the oral route and, hence, negative energy balance.
There are several limitations in our study. First, our cohorts represent prevalent ALS populations. Cohorts #1 and #2 were drawn from the NINDS study which by design enrolled subjects with varying degrees of disease progression. Second, some participants in Cohort #3 were evaluated at regular intervals prospectively as part of research, whereas the return visits of subjects attending the ALS clinic were at variable times. We did not study any cohorts of participants prospectively from the time of diagnosis in our clinics so the time to nutritional failure as evidenced by loss of FM is not known. Third, we measured weight in Cohort #3 clinic subjects in street clothes with shoes, incurring all the errors associated with such measurements that are less likely with weight measured in a research facility. Fourth, we did not have available to us data on nutritional status in a sufficient number of Cohort #3 clinic subjects so as to correlate changes in weight and FM with those in energy balance.
In conclusion, our study provides a validated ALS-specific equation to estimate body composition from measures collected during routine clinic visits. In parallel, we found that body composition computed from the ALS-specific equation and the Deurenberg equations provided similar results. Our findings emphasize the clinical imperative of estimating both FM and FFM as indicators of body composition, rather than simply relying on whole-body measures such as weight or BMI, in predicting disease course and survival and planning for nutritional supplementation. Therefore, accurately measuring body composition in ALS is a critical aspect of disease management, including adequate and timely dietary intervention to preserve body composition specifically by targeting the preservation of FM to lessen disease severity (49), slow disease progression, and prolong survival. The results from our observational study need confirmation in a controlled experiment with parallel nutritional data.
Supplementary Material
Acknowledgments
We gratefully acknowledge the assistance of Molly Partelow in the preparation and formatting of the manuscript.
The authors’ responsibilities were as follows—EAL, EJK, and RT: designed the research; DBH, EJK, and RT: provided research oversight; EAL, JH, NK, and SD: conducted the research; DBH: analyzed the data and performed statistical analysis; EAL, DBH, EJK, and RT: wrote the paper; EJK and RT: had primary responsibility for the final content; and all authors: read and approved the final manuscript. The authors report no conflicts of interest.
Notes
Supported by National Institute of Neurological Disorders and Stroke grant RO1 NS045087; General Clinical Research Centers grants RR00645 (to Columbia University, New York, NY), RR02602 (to University of Kentucky, Lexington, KY), RR10732 and CO6-RR016499 (to Penn State University, Hershey, PA), RR00064 (to University of Utah, Salt Lake City, UT), and RR00109 (to University of Vermont, Burlington, VT); the National ALS Association; the ALS Hope Foundation; and the Cynthia Shaw Crispen Endowment.
Supplemental Table 1 is available from the “Supplementary data” link in the online posting of the article and from the same link in the online table of contents at https://academic.oup.com/ajcn/.
Abbreviations used: ALS, amyotrophic lateral sclerosis; ALSFRS-R, ALS functional rating scale-revised; FFM, fat-free mass; FM, fat mass; FVC, forced vital capacity; GCRC, General Clinical Research Center; LBM, lean body mass; NINDS, National Institute of Neurological Disorders and Stroke; UKY, University of Kentucky, Lexington, KY; UVM, University of Vermont, College of Medicine, Burlington, VT; UVMMC, UVM Medical Center.
Contributor Information
Rup Tandan, Department of Neurological Sciences, University of Vermont Medical Center and Robert Larner, MD College of Medicine, University of Vermont, Burlington, VT, USA; General Clinical Research Center, University of Vermont Medical Center and Robert Larner, MD College of Medicine, University of Vermont, Burlington, VT, USA.
Evan A Levy, Department of Neurological Sciences, University of Vermont Medical Center and Robert Larner, MD College of Medicine, University of Vermont, Burlington, VT, USA; General Clinical Research Center, University of Vermont Medical Center and Robert Larner, MD College of Medicine, University of Vermont, Burlington, VT, USA.
Diantha B Howard, General Clinical Research Center, University of Vermont Medical Center and Robert Larner, MD College of Medicine, University of Vermont, Burlington, VT, USA; The Northern New England Clinical and Translational Research Network, Robert Larner, MD College of Medicine, University of Vermont, Burlington, VT, USA; Maine Medical Center Research Institute, Portland, ME, USA.
John Hiser, General Clinical Research Center, University of Vermont Medical Center and Robert Larner, MD College of Medicine, University of Vermont, Burlington, VT, USA; The Northern New England Clinical and Translational Research Network, Robert Larner, MD College of Medicine, University of Vermont, Burlington, VT, USA; Maine Medical Center Research Institute, Portland, ME, USA.
Nathan Kokinda, General Clinical Research Center, University of Vermont Medical Center and Robert Larner, MD College of Medicine, University of Vermont, Burlington, VT, USA; The Northern New England Clinical and Translational Research Network, Robert Larner, MD College of Medicine, University of Vermont, Burlington, VT, USA; Maine Medical Center Research Institute, Portland, ME, USA.
Swatee Dey, Department of Neurology, University of Kentucky, Lexington, KY, USA; General Clinical Research Center, University of Kentucky, Lexington, KY, USA.
Edward J Kasarskis, Department of Neurology, University of Kentucky, Lexington, KY, USA; General Clinical Research Center, University of Kentucky, Lexington, KY, USA.
Data Availability
Data described in the article and code will be made available upon request pending approval of the corresponding author (RT) and the Principal Investigator (EJK).
References
- 1. Hardiman O, Al-Chalabi A, Chio A, Corr EM, Logroscino G, Robberecht W, Shaw PJ, Simmons Z, van den Berg LH. Amyotrophic lateral sclerosis. Nat Rev Dis Primers. 2017;3:17071. [DOI] [PubMed] [Google Scholar]
- 2. Desport JC, Preux PM, Truong TC, Vallat JM, Sauterau D, Couratier P. Nutritional status is a prognostic factor for survival in ALS patients. Neurology. 1999;53(5):1059–63. [DOI] [PubMed] [Google Scholar]
- 3. Genton L, Viatte V, Janssens JP, Héritier AC, Pichard C. Nutritional state, energy intakes and energy expenditure of amyotrophic lateral sclerosis (ALS). Clin Nutr. 2011;30(5):553–9. [DOI] [PubMed] [Google Scholar]
- 4. Kasarskis EJ, Berryman S, Vanderleest JG, Schneider AR, McClain CJ. Nutritional status of patients with amyotrophic lateral sclerosis: relation to the proximity of death. Am J Clin Nutr. 1996;63(1):130–7. [DOI] [PubMed] [Google Scholar]
- 5. Nau KL, Dick AR, Peters K, Schloerb PR. Relative validity of clinical techniques for measuring the body composition of persons with ALS. J Neurol Sci. 1997;152(1):s36–42. [DOI] [PubMed] [Google Scholar]
- 6. Moglia C, Calvo A, Grassano M, Canosa A, Manera U, D'Ovidio F, Bombaci A, Bersano E, Mazzini L, Mora Get al. Early weight loss in amyotrophic lateral sclerosis: outcome relevance and clinical correlates in a population-based cohort. J Neurol Neurosurg Psychiatry. 2019;90(6):666–73. [DOI] [PubMed] [Google Scholar]
- 7. Marin B, Desport JC, Kajeu P, Jesus P, Nicolaud B, Nicol M, Preux PM, Couratier P. Alteration of nutritional status at diagnosis is a prognostic factor for survival of amyotrophic lateral sclerosis patients. J Neurol Neurosurg Psychiatry. 2011;82(6):628–34. [DOI] [PubMed] [Google Scholar]
- 8. Cereda E, Veronese N, Caccialanza R. The final word on nutritional screening and assessment in older persons. Curr Opin Clin Nutr Metab Care. 2018;21(1):24–9. [DOI] [PubMed] [Google Scholar]
- 9. Worwood AM, Leigh PN. Indicators and prevalence of malnutrition in motor neurone disease. Eur Neurol. 1998;40(3):159–63. [DOI] [PubMed] [Google Scholar]
- 10. Roubeau V, Blasco H, Maillot F, Corcia P, Praline J. Nutritional assessment of amyotrophic lateral sclerosis in routine practice: value of weighing and bioelectrical impedance analysis. Muscle Nerve. 2015;51(4):479–84. [DOI] [PubMed] [Google Scholar]
- 11. Ioannides ZA, Steyn FJ, Henderson RD, Mccombe PA, Ngo ST. Anthropometric measures are not accurate predictors of fat mass in ALS. Amyotroph Lateral Scler Frontotemporal Degener. 2017;18(7–8):486–91. [DOI] [PubMed] [Google Scholar]
- 12. Jensen MD, Kanaley JA, Roust LR, O'Brien PC, Braun JS, Dunn WL, Wahner HW. Assessment of body composition with use of dual-energy x-ray absorptiometry: evaluation and comparison with other methods. Mayo Clin Proc. 1993;68(9):867–73. [DOI] [PubMed] [Google Scholar]
- 13. Wellens R, Chumlea WC, Guo S, Roche AF, Reo NV, Siervogel RM. Body composition in white adults by dual energy x-ray absorptiometry, densitometry, and total body water. Am J Clin Nutr. 1994;59(3):547–55. [DOI] [PubMed] [Google Scholar]
- 14. Smith S, Madden AS. Body composition and functional assessment of nutritional status in adults: a narrative review of imaging, impedance, strength and functional techniques. J Hum Nutr Diet. 2016;29(6):714–32. [DOI] [PubMed] [Google Scholar]
- 15. Kasarskis EJ, Berryman S, English T, Nyland J, Vanderleest J, Schneider A, Berger R, McClain C. The use of upper extremity anthropometrics in the clinical assessment of patients with amyotrophic lateral sclerosis. Muscle Nerve. 1997;20(3):330–5. [DOI] [PubMed] [Google Scholar]
- 16. Geisler C, Braun W, Pourhassan M, Schweitzer L, Glüer C-C, Bosy-Westphal A, Müller MJ. Gender-specific associations in age-related changes in resting energy expenditure (REE) and MRI measured body composition in healthy Caucasians. J Gerontol A Biol Sci Med Sci. 2016;71(7):941–6. [DOI] [PubMed] [Google Scholar]
- 17. Brooks BR, Miller RG, Swash M, Munsat TL, World Federation of Neurology Research Group on Motor Neuron Diseases . El Escorial revisited: revised criteria for the diagnosis of amyotrophic lateral sclerosis. Amyotroph Lateral Scler Other Motor Neuron Disord. 2000;1(5):293–9. [DOI] [PubMed] [Google Scholar]
- 18. Traynor BJ, Zhang H, Shefner JM, Schoenfeld D, Cudkowicz ME, NEALS consortium . Functional outcome measures as clinical trial endpoints in ALS. Neurology. 2004;63(10):1933–5. [DOI] [PubMed] [Google Scholar]
- 19. Kasarskis EJ, Mendiondo M, Wells S, Malguizo MS, Thompson M, Healey M, Kryscio RJ, ALS Nutrition/NIPPV Study Group . The ALS Nutrition/NIPPV study: design, feasibility, and initial results. Amyotroph Lateral Scler. 2011;12(1):17–25. [DOI] [PubMed] [Google Scholar]
- 20. Kasarskis EJ, Mendiondo MS, Matthews DE, Mitsumoto H, Tandan R, Simmons Z, Bromberg MB, Kryscio RJ, ALS Nutrition/NIPPV Study Group . Estimating daily energy expenditure in individuals with amyotrophic lateral sclerosis. Am J Clin Nutr. 2014;99(4):792–803. [DOI] [PMC free article] [PubMed] [Google Scholar]
- 21. Jackson AS, Pollock ML, Ward A. Generalized equations for predicting body density of women. Med Sci Sports Exerc. 1980;12(3):175–81. [PubMed] [Google Scholar]
- 22. Jackson AS, Pollock ML. Generalized equations for predicting body density of men. 1978. Br J Nutr. 2004;91(1):161–8. [PubMed] [Google Scholar]
- 23. Durnin JV, Womersley J. Body fat assessed from total body density and its estimation from skinfold thickness: measurements on 481 men and women aged from 16 to 72 years. Br J Nutr. 1974;32(1):77–97. [DOI] [PubMed] [Google Scholar]
- 24. Deurenberg P, Westrate JA, Seidell JC. Body mass index as a measure of body fatness: age- and sex-specific prediction formulas. Br J Nutr. 1991;65(2):105–14. [DOI] [PubMed] [Google Scholar]
- 25. Rehs HJ, Berndt I, Rutenfranz J, Burmeister W. [Determination of lean body mass by skin fold measurements (author's translation)]. Z Kinderheilkd. 1975;120(2):121–33. [PubMed] [Google Scholar]
- 26. Haarbo J, Gotfredsen A, Hassager C, Christiansen C. Validation of body composition by dual energy X-ray absorptiometry. Clin Physiol. 1991;11(4):331–41. [DOI] [PubMed] [Google Scholar]
- 27. Kanda F, Fujii Y, Takahashi K, Fujita T. Dual-energy X-ray absorptiometry in neuromuscular diseases. Muscle Nerve. 1994;17(4):431–5. [DOI] [PubMed] [Google Scholar]
- 28. Nau KL, Bromberg MB, Forshew DA, Katch VL. Individuals with amyotrophic lateral sclerosis are in caloric balance despite losses in mass. J Neurol Sci. 1995;129:47–9. [DOI] [PubMed] [Google Scholar]
- 29. Desport JC, Preux PM, Bouteloup-Demange C, Clavelou P, Beaufrѐre B, Bonnet C, Couratier PP. Validation of bioelectrical impedance analysis in patients with amyotrophic lateral sclerosis. Am J Clin Nutr. 2003;77(5):1179–85. [DOI] [PubMed] [Google Scholar]
- 30. Bouteloup C, Desport J-C, Clavelou P, Guy N, Derumeaux-Burel H, Ferrier A, Couratier P. Hypermetabolism in ALS patients: an early and persistent phenomenon. J Neurol. 2009;256(8):1236–42. [DOI] [PubMed] [Google Scholar]
- 31. Vaisman N, Lusaus M, Nefussy B, Niv E, Comaneshter D, Hallack R, Drory VE. Do patients with amyotrophic lateral sclerosis (ALS) have increased energy needs?. J Neurol Sci. 2009;279(1–2):26–9. [DOI] [PubMed] [Google Scholar]
- 32. Giavarina D. Understanding Bland Altman analysis. Biochem Med (Zagreb). 2015;25(2):141–51. [DOI] [PMC free article] [PubMed] [Google Scholar]
- 33. Paganoni S, Deng J, Jaffa M, Cudkowicz ME, Wills AM. Body mass index, not dyslipidemia, is an independent predictor of survival in amyotrophic lateral sclerosis. Muscle Nerve. 2011;44(1):20–4. [DOI] [PMC free article] [PubMed] [Google Scholar]
- 34. Reich-Slotky R, Andrews J, Cheng B, Buchsbaum R, Levy D, Kaufmann P, Thompson JLP. Body mass index (BMI) as a predictor of ALSFRS-R score decline in ALS patients. Amyotroph Lateral Scler Frontotemporal Degener. 2013;14(3):212–16. [DOI] [PubMed] [Google Scholar]
- 35. Atassi N, Berry J, Shui A, Zach N, Sherman A, Sinani E, Walker J, Katsovskiy I, Schoenfeld D, Cudkowicz Met al. The PRO-ACT database: design, initial analyses, and predictive features. Neurology. 2014;83(19):1719–25. [DOI] [PMC free article] [PubMed] [Google Scholar]
- 36. Mazzini L, Corrà T, Zaccala M, Mora G, Del Piano M, Galante M. Percutaneous endoscopic gastrostomy and enteral nutrition in amyotrophic lateral sclerosis. J Neurol. 1995;242(10):695–8. [DOI] [PubMed] [Google Scholar]
- 37. López Gómez JJ, Ballesteros Pomar MD, Vázquez Sánchez F, Vidal Casariego A, Calleja Fernández A, Cano Rodríguez I. [Effect of nutritional support on survival in patients with amyotrophic lateral sclerosis]. Nutr Hosp. 2011;26(3):515–21. [DOI] [PubMed] [Google Scholar]
- 38. Dorst J, Cypionka J, Ludolph AC. High-caloric food supplements in the treatment of amyotrophic lateral sclerosis: a prospective interventional study. Amyotroph Lateral Scler Frontotemporal Degener. 2013;14(7–8):533–6. [DOI] [PubMed] [Google Scholar]
- 39. Wills AM, Hubbard J, Macklin EA, Glass J, Tandan R, Simpson EP, Brooks B, Gelinas D, Mitsumoto H, Mozaffar Tet al. Hypercaloric enteral nutrition in patients with amyotrophic lateral sclerosis: a randomized, double-blind, placebo-controlled phase 2 trial. Lancet. 2014;383(9934):2065–72. [DOI] [PMC free article] [PubMed] [Google Scholar]
- 40. Keys A, Brožek J, Henschel A, Mickelsen O, Taylor HL, Simonson E, Skinner AS, Wells SM, editors, with the assistance of. The biology of human starvation. Vols I and II. Minneapolis, MN: University of Minnesota Press; 1950. [Google Scholar]
- 41. Ludolph AC, Dorst J, Dreyhaupt J, Weishaupt JH, Kassubek J, Weiland U, Meyer T, Petri S, Hermann A, Emmer Aet al. Effect of high-caloric nutrition on survival in amyotrophic lateral sclerosis. Ann Neurol. 2020;87(2):206–16. [DOI] [PubMed] [Google Scholar]
- 42. Lindauer E, Dupuis L, Müller HP, Neumann H, Ludolph AC, Kassubek J. Adipose tissue distribution predicts survival in amyotrophic lateral sclerosis. PLoS One. 2013;8(6):e677–83. [DOI] [PMC free article] [PubMed] [Google Scholar]
- 43. Jésus P, Fayemendy P, Nicol M, Lautrette G, Sourisseau H, Preux P-M, Desport J-C, Marin B, Couratier P. Hypermetabolism is a deleterious prognostic factor in patients with amyotrophic lateral sclerosis. Eur J Neurol. 2018;25(1):97–104. [DOI] [PubMed] [Google Scholar]
- 44. Lee I, Kazamel M, McPherson T, McAdam J, Bamman M, Amara A, Smith DL, King PH. Fat mass loss correlates with faster disease progression in amyotrophic lateral sclerosis patients: exploring the utility of dual-energy x-ray absorptiometry in a prospective study. PLoS One. 2021;16(5):e0251087. [DOI] [PMC free article] [PubMed] [Google Scholar]
- 45. Fasshauer M, Bluher M. Adipokines in health and disease. Trends Pharmacol Sci. 2015;36(7):461–70. [DOI] [PubMed] [Google Scholar]
- 46. Hellström L, Wahrenberg H, Hruska K, Reynisdottir S, Arner P. Mechanisms behind gender differences in circulating leptin levels. J Intern Med. 2000;247(4):457–62. [DOI] [PubMed] [Google Scholar]
- 47. Blaak E. Gender differences in fat metabolism. Curr Opin Clin Nutr Metab Care. 2001;4(6):499–502. [DOI] [PubMed] [Google Scholar]
- 48. Tandan R, Waheed W, Scagnelli C. Nutritional consequences of amyotrophic lateral sclerosis. In: Preedy VR, Patel VB, editors. Handbook of famine, starvation, and nutrient deprivation: from biology to policy. London, United Kingdom: Springer; 2019. Chapter 108. [Google Scholar]
- 49. Park Y, Park J, Kim Y, Baek H, Kim SH. Association between nutritional status and disease severity using the amyotrophic lateral sclerosis (ALS) functional rating scale in ALS patients. Nutrition. 2015;31(11–12):1362–7. [DOI] [PubMed] [Google Scholar]
Associated Data
This section collects any data citations, data availability statements, or supplementary materials included in this article.
Supplementary Materials
Data Availability Statement
Data described in the article and code will be made available upon request pending approval of the corresponding author (RT) and the Principal Investigator (EJK).