Abstract
Average nucleotide identity (ANI) is a prominent approach for rapidly classifying archaea and bacteria by recruiting both whole genomic sequences and draft assemblies. To evaluate the feasibility of ANI in virus taxon demarcation, 685 poxviruses were assessed. Prior to the analysis, the fragment length and threshold of the ANI value were optimized as 200 bp and 98 per cent, respectively. After ANI analysis and network visualization, the resulting sixty-one species (ANI species rank) were clustered and largely consistent with the groupings found in National Center for Biotechnology Information Virus [within the International Committee on Taxonomy of Viruses (ICTV) Master Species List]. The species identities of thirty-four other poxviruses (excluded by the ICTV Master Species List) were also identified. Subsequent phylogenetic analysis and Guanine-Cytosine (GC) content comparison done were found to support the ANI analysis. Finally, the BLAST identity of concatenated sequences from previously identified core genes showed 91.8 per cent congruence with ANI analysis at the species rank, thus showing potential as a marker gene for poxviruses classification. Collectively, our results reveal that the ANI analysis may serve as a novel and efficient method for poxviruses demarcation.
Keywords: ANI, Poxviridae, species, demarcation
1. Introduction
The poxviruses group (family Poxviridae) comprises many large and diverse double-stranded DNA viruses with a genomic length ranging from 137 to 352 kilobase pairs that can encode 133–328 genes and replicate entirely in the cytoplasm of host cells (Lefkowitz, Wang, and Upton 2006; Moss 2013). Poxviruses are among the best known and most feared viruses owing to their wide host spectrum, which covers insects, birds, reptiles, and mammals (Gyuranecz et al. 2013; Sarker et al. 2019; Alonso et al. 2020). In light of this, the International Committee on Taxonomy of Viruses (ICTV) Master Species List 2020.vl. divides the Poxviridae family into two subfamilies (Chordopoxvirinae and Entomopoxviriane) and subsequently eighty-three species. Currently, the taxon demarcation criteria for family Poxviridae include the following aspects: natural host range, phylogenetic analysis, nucleotide/amino acid sequence identity, gene content comparison, organization of the genome, morphology and disease characteristics, and serological criteria (ICTV code assigned: 2019.005D). Among them, the former two are preferentially used and, presently, they might still be suitable for the classification of newly discovered poxviruses. However, when faced with the robust emergence of newly isolated viruses in the era of bulk viral genome recovery through metagenomics (Paez-Espino et al. 2016), the traditional classification approaches might be slightly laborious for those viruses lacking biological phenotypes. Thus, the use of sequence-based classification methods may be more feasible. For the family Poxviridae, although the nucleotide sequence/amino acid identity cannot be the crucial criterion for classification, they still can provide reliable support through the analysis of conserved regions and specific genes; however, the pre-screening of conserved regions or specific genes is necessary. Therefore, it might be worthwhile to investigate whether there is a method that relies solely on genome-wide comparison and contributes to the classification of poxviruses.
In recent years, the emergence of whole-genome average nucleotide identity (ANI) has helped shed light on assessing species boundaries through estimating genetic relatedness between two genomes, where those sharing ≥95 per cent identity would be classified into the same species (Konstantinidis and Tiedje 2005; Goris et al. 2007), and offers robust resolution among closely related genomes. As compared to the gold standard of DNA–DNA hybridization (DDH), ANI exhibits several advantages, such as easier processing and higher resolution, efficiency, and reproducibility (Rosselló-Mora 2005; Staley 2009). Despite these strengths, one limitation of current ANI-based methods cannot be neglected, which is their reliance on an alignment-based search engine (Altschul et al. 1997; Kent 2002; Edgar 2010; Buchfink, Xie, and Huson 2015). Although a couple of modified solutions have been proposed (Lee et al. 2016; Yoon et al. 2017; Rodriguez et al. 2020), the computational bottleneck was not alleviated until the emergence of FastANI, which relies on an alignment-free mapping engine (Jain et al. 2018a).
In the present study, a total of 685 complete sequences of poxviruses have been used. After parameter optimization, FastANI analysis was conducted and the species classification based on ANI values was found to be essentially identical to the taxon demarcation from the ICTV report. Furthermore, they were highly consistent with the phylogenetic analysis and GC content comparison. Collectively, our method provides greater insights into taxonomy for the existing and undocumented poxviruses, as well as the application of ANI for poxvirus taxonomy.
2. Results
2.1. Parameter optimization and ANI analysis of poxviruses
The accuracy of ANI analysis is greatly affected by the query fragment length; thus, the appropriate value of it is necessarily optimized. The results illustrate that the ANI values calculated using larger fragment lengths (800–2000 bp) would be greater than 92 per cent, making classification difficult. Conversely, smaller fragment lengths (100–600 bp) were more suitable. Thus, while also considering the dependency of time consumption and fragment length, the 200-bp setting was prioritized (Fig. 1).
Figure 1.
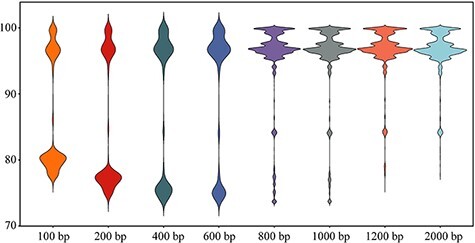
Fragment length parameter filtration. X-axis and Y-axis indicate fragment length parameter and calculated ANI values, respectively.
Taking reference from the cut-off value of ANI for archaea and bacteria (95–96 per cent), the threshold setting of 95 per cent was first tested. Unfortunately, it could not clearly separate each species, especially for the Type III group (Fig. S1). There were several heterogeneous clusters; for example, cluster #40 contained the members of Camelpox Virus, Cowpox Virus, Taterapox Virus, Variola Virus, and Vaccinia Virus. Similar results were also seen in clusters #41–44 (Fig. S1).
Subsequently, the threshold identity of 98 per cent was tested and validated since it yielded results with clear boundaries between each species. In general, 61 clusters (ANI species rank) were generated from 685 poxviruses genomes (52 ICTV species) and they were further separated into 3 main groups based on their consistency with the ICTV species rank classifications (Fig. 2). A total of thirty-nine consistent species were identified, accounting for 75 per cent (39/52) of ICTV species (Fig. 2, Type I). In contrast, some ICTV species had been split into two or three clusters (ANI species rank), such as Myxoma Virus, Fowlpox Virus, Molluscum Contagiosum Virus, Orf Virus, Squirrelpox Virus, Pseudocowpox Virus, and Mule Deerpox Virus (Fig. 2, Type II). Notably, one penguinpox virus was classified into Canarypox Virus (Fig. 2, Type II: cluster #47). Furthermore, four clusters (clusters #58–61) were distributed in the Type III group and cluster #58 presented a complex aggregation comprising the members of Variola Virus, Vaccinia Virus, Taterapox Virus, Camelpox Virus, and Cowpox Virus (Fig. 2, Type III). Meanwhile, two variola virus genomes (clusters #59–60) and one cowpox virus genome (cluster #61) were independent at ANI species rank.
Figure 2.
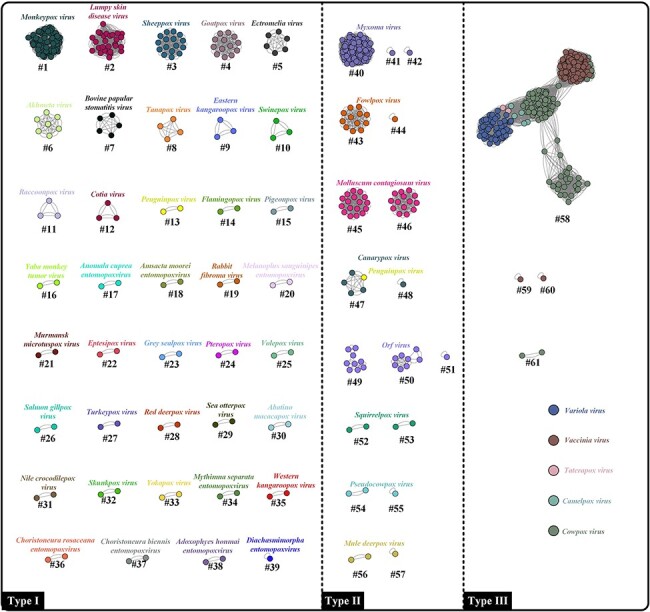
FastANI-based network analysis of 685 poxvirus genomes. Each dot and colour represent one poxvirus genome and one species, respectively. Dots connected by lines indicate a cluster where the calculated ANI values were over 98 per cent. In the present study, the clusters are defined at ANI species rank and within clusters, each poxvirus has a corresponding member (ANI value ≥ 98 per cent). In the Type I group, the resulting demarcation at ANI species rank is consistent with the ICTV Master Species List. In the Type II group, one ICTV species has been split into multiple species at the ANI species rank. In the Type III group, multiple ICTV species have merged into one species at the ANI species rank (cluster #58).
2.2. Phylogenetic analysis
To assess the consistency between ANI species demarcation and phylogenetic analysis, two phylogeny trees were constructed using ViPTree server and CVTree web server (Fig. 3). Both tree-maps were similar, showing almost the same landscape and the consistencies (whether members from the same cluster can form monophyletic clades) were 96.72 per cent (Fig. 3A) and 91.8 per cent (Fig. 3B), respectively. The inconsistent viruses were identified by arrows.
Figure 3.
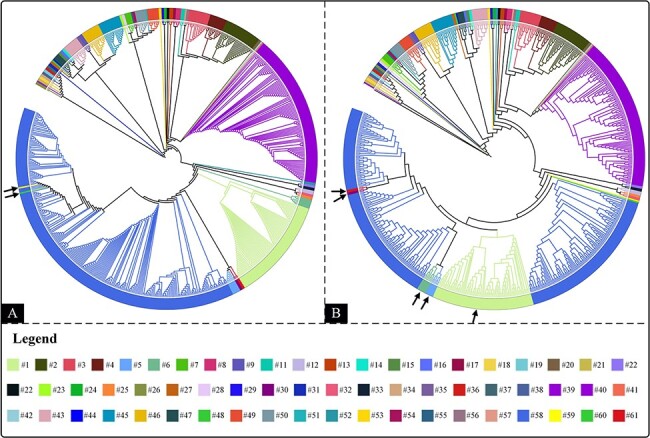
Phylogenetic analysis of 685 poxviruses. (A) The ViPTree based on genome-wide sequences. (B) The CV-Tree based on genomic amino acid sequences. The different colours correspond to different ANI species. Arrows indicate viruses that do not form monophyletic clades with their counterparts.
2.3. The comparison of ANI and phylogenetic analyses
After ANI analysis, 75 per cent of the sampled poxviruses formed thirty-nine homogenous clusters that were consistent with the ICTV Master Species List (Fig. 2, Type I). The remaining 25 per cent were divided into two groups based on their properties. To determine this separation, the phylogenetic analysis and the ANI analysis were compared. Within the Type II group (Fig. 2), fowlpox virus, canarypox virus, and squirrelpox virus were split into clusters #43–44, #47–48, and #52–53, respectively. The phylogenetic branches of these viruses did not form monophyletic clades, especially for clusters #52–53, which were located on very distant branches (Fig. 4A). In addition, the GC content of these viruses showed enormous differences when compared with their counterparts (Fig. S2). In particular, the difference between clusters #52 and #53 was striking enough to draw attention, with the GC content in cluster #53 (66.69 per cent) being nearly 30 percentage points higher than that in cluster #52 (38.62 per cent; Table S2). Collectively, the phylogenetic analysis and GC content comparison also support the taxa classification of sampled poxviruses at ANI species rank.
Figure 4.
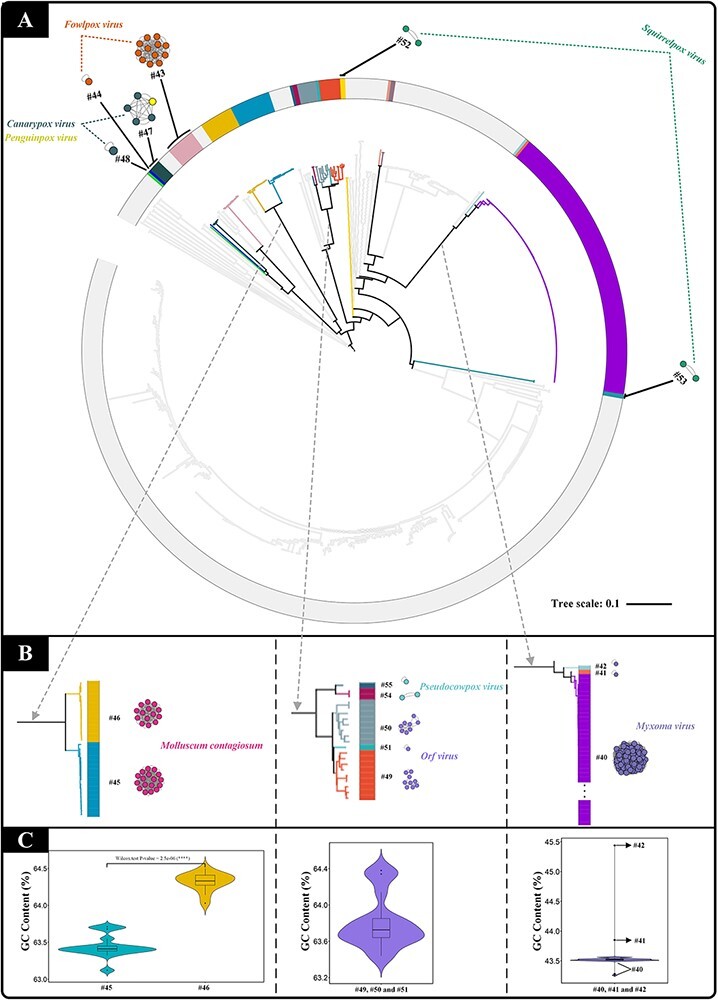
The comparison between phylogenetic analysis and ANI analysis within the Type II group poxvirus. (A) The ViPTree. The different colours correspond to different clusters of the Type II group members. (B) The enlargement of the corresponding branches. (C) GC content comparison of the corresponding branches.
As for the other clusters (clusters #45–46, #40–42, #49–51, and #54–55), although they could form monophyletic clades with other members, they could still be further divided into different branches (Fig. 4B), which were strongly supported by GC content comparison (Fig. 4C). Thus, it can be inferred that the subdivisions obtained based on the ANI analysis are reasonable.
As for Type III group viruses, five ICTV species (Variola Virus, Vaccinia Virus, Taterapox Virus, Camelpox Virus, and Cowpox Virus) merged into one species at the ANI species rank (Fig. 2, Type III: cluster #58). Similarly, in the phylogenetic analysis, all the viruses in cluster #58 were clustered into the same branch (Fig. 5). For clusters #59, #60 (two variola virus genomes), and #61 (one cowpox virus genome), they demonstrated similarities to the type of grouping seen in the Type II group. Clusters #59 and #60 were the only two virus groups that were inconsistent with phylogenetic analysis (Figs 3A and 5; both clusters overlapped into the branches of cluster #58). From the perspective of the genome composition, the GC content of cluster #59 and the genome length of cluster #60 also showed slight differences when compared with others (Table S2), which supports the results of ANI analysis. Meanwhile, cluster #61 did not form a monophyletic clade with other cowpox viruses within cluster #58.
Figure 5.
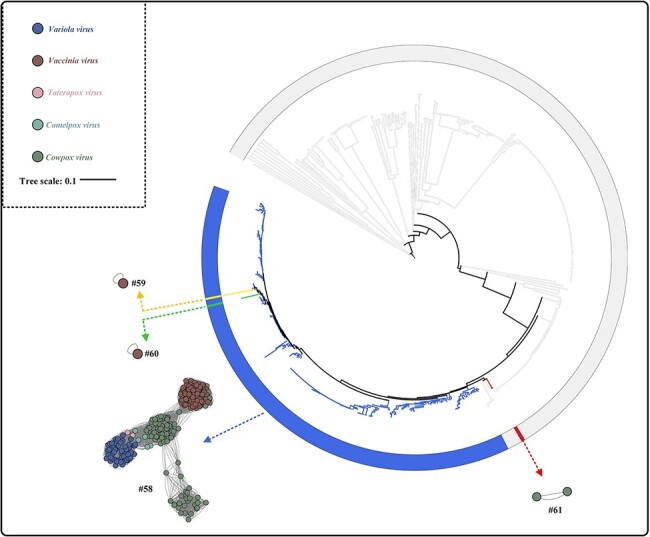
The ViPTree showing the comparison between phylogenetic analysis and ANI analysis within Type III group poxvirus. The different colours represent different clusters for Type III group members.
After a series of analyses, we found that the phylogeny analysis, GC content, and genome length comparison support the demarcation at ANI species rank. Thus, an updated/modified taxonomy was proposed (Table S2). In brief, the members within the Type I group are fully consistent with their original species demarcation. On the other hand, based on the ANI analysis, phylogeny analysis, and the probable host species difference, renaming of the members in Type II and III groups should be considered. For example, clusters #40–42, which used to be known as Myxoma Virus, could be renamed to ‘Myxoma Virus 1–3’. Additionally, the camelpox virus, cowpox virus, taterapox virus, and vaccinia virus in cluster #58 would be collectively known as ‘Mammalian Poxvirus 1’. The detailed information is listed in Table S2.
2.4. The comparison between FastANI and ANI_BLASTN
The accuracy of ANI analysis is the determining factor in whether it can be used for viral classification. To determine its applicability, alignment-free (FastANI) and -based (ANI_BLASTN) methods were employed. Overall, both methods showed similar cluster distribution (Figs 2 and 6), with a high consistency of 95.08 per cent between these two methods. However, there were still several slight differences, mainly involving clusters #49, #50, and #58. Clusters #49 and #50 were grouped into three and two subunits, respectively, by using ANI_BLASTN (Fig. 6), but failed to be grouped in the FastANI analysis. Interestingly, the GC content and genome length did not show a remarkable difference between members of clusters #49 and #50 (Table S1), indicating that the FastANI analysis might be more reliable. A similar phenomenon was observed for cluster #58 as well. Thus, it is reasonable to infer that the FastANI analysis might be a robust and efficient supporting tool for poxvirus classification.
Figure 6.
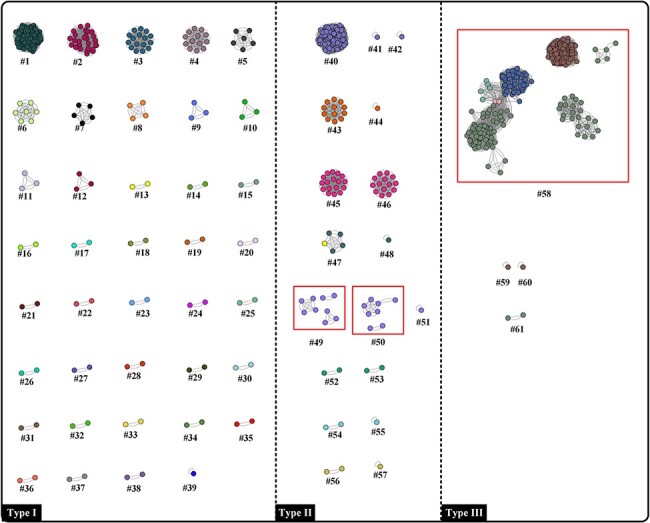
ANI_BLASTN-based network analysis of 685 poxvirus genomes. Red squares indicate the differences when compared with FastANI. Each dot and colour represent one poxvirus genome and one species, respectively. Dots connected by lines indicate a cluster where the calculated ANI values were over 98 per cent. In the present study, the clusters are defined at ANI species rank and within clusters, each poxvirus has a corresponding member (ANI value ≥ 98 per cent).
2.5. The application of ANI analysis for all poxviruses
From the NCBI Virus Data, a total of 719 poxvirus genomes were listed. However, among them, thirty-four poxviruses still do not have corresponding species classification in ICTV. To verify the feasibility of ANI analysis for the other members of Poxviridae family while exploring their potential species classification, all the viruses were subjected to FastANI analysis (Fig. 7). Noticeably, the albatrosspox virus was classified into cluster #47 (ANI species rank: ‘Canarypox Virus 1’, Fig. 7) and the Mule Deerpox Virus was expanded by grouping with moosepox virus and white-tailed deer poxvirus (Fig. 7). Although there were still several viruses without an official species name (Fig. 7, Not retrieved), the gathering of saltwater crocodilepox virus was impressive (fourteen viruses were grouped together). Collectively, the ANI analysis may provide potential insights for both known and unknown poxvirus classification, although more studies will be required to substantiate this.
Figure 7.
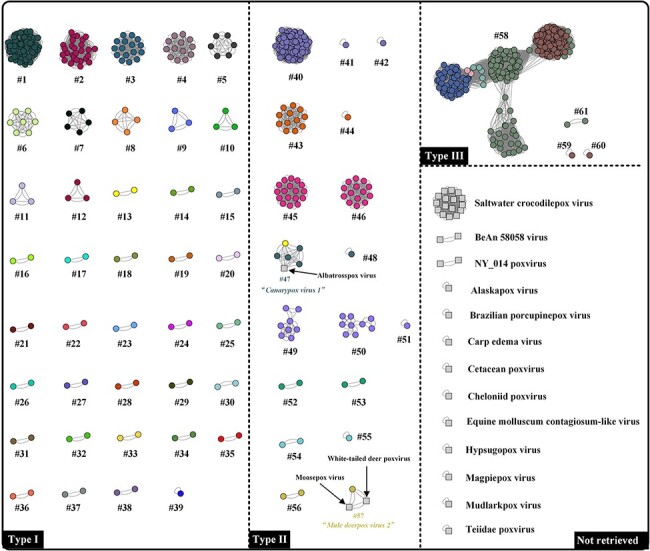
FastANI-based network analysis of 719 poxvirus genomes. Each dot/square and colour represent one poxvirus genome and one species, respectively; the grey squares indicate poxviruses without official species names. Dots/squares connected by lines indicate a cluster where the calculated ANI values were over 98 per cent. In the present study, the clusters are defined at ANI species rank and within clusters, each poxvirus has a corresponding member (ANI value ≥98 per cent). Not retrieved: viruses not officially named in ICTV.
2.6. The selection of core genes for species rank demarcation
It is time-consuming to classify viruses by using methods that require prior knowledge of their full genomic sequences. However, the use of marker genes shared by all virus genomes makes it easier by allowing for the checking of the percentage of identical matches through BLAST. In accordance with our previous report, four core genes (Early Transcription Factor, #4; RNA Polymerase Subunit rpo132, #5; RNA Polymerase-Associated Transcription-Specificity Factor, #15; and RNA Polymerase Subunit rpo147, #22) were identified by saturation analysis and phylogenetic analysis (information on these genes is listed in the Supplementary file). To evaluate their feasibility as marker genes, their sequences were manually extracted from 685 poxviruses. After BLAST and identity filtration, all the classification maps were largely concordant with the original ANI analysis and the filtration setting (percentage of identical matches) when set as 99 per cent showed higher accuracy for virus clustering (Table S3 and Fig. S3). Furthermore, after calculating their consistency when compared to the taxonomy generated by ANI calculation, core genes #4 and #5 exhibited better fitness for poxvirus classification (consistency: 86.21 per cent and 89.66 per cent, respectively; Table S3 and Fig. S3). To improve the accuracy of BLAST, a concatenated sequence of core genes #4 and #5 was used. Consequently, the cluster map from the concatenated sequence showed a similar group distribution as the whole genome-based ANI analysis (Fig. 8; consistency: 91.8 per cent). Therefore, the use of concatenated sequences of indicated core genes meets the basic requirements for known poxviruses taxonomy, except for certain specific species.
Figure 8.
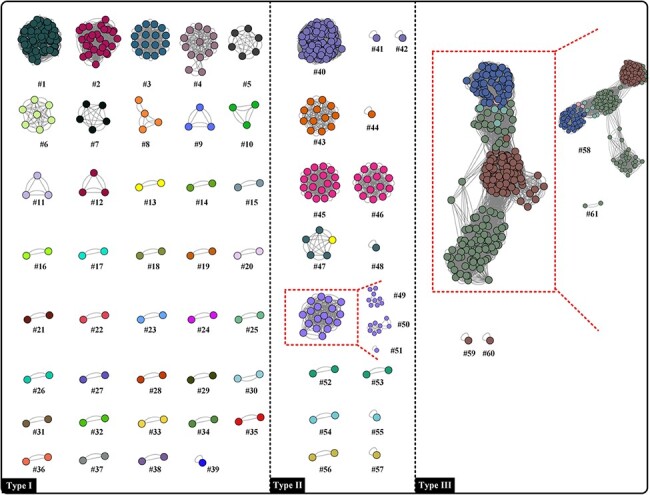
BLAST-based network analysis depends on 685 concatenated sequences. Each dot and colour represent one poxvirus genome and one species, respectively. Dots connected by lines indicate a cluster where the calculated percentage of identical matches exceeding 99 per cent. Red squares indicate differences when compared with ANI analysis based on whole genome sequence (clusters #49, #50, #51, #58, and #61 were generated by ANI analysis).
3. Discussion
DDH is regarded as the gold standard for prokaryotic delineation and has held a dominant position since the late 1960s. However, owing to its time-consuming process, and poorly reproducible results across labs, its widespread has been impeded (Grimont et al. 1980; Huss, Festl, and Schleifer 1983). With tremendous advancement in genome sequencing, full genomic sequences are commonly available. Consequently, improvements in approaches for prokaryotic classification have gained a great momentum. Several comparative methods between two genome sequences have been proposed (Chun and Rainey 2014). Among them, ANI has emerged and gradually replaced DDH, with a proposed species boundary cut-off set as 95–96 per cent. After 2 years of preliminary exploration, the emphasis has shifted from ORFs to whole genomes (Konstantinidis and Tiedje 2005; Goris et al. 2007), accelerating the process of algorithm optimization. In 2018, a novel algorithm, based on alignment-free mapping search, has been proposed, alleviating the computational bottleneck under the guarantee of accuracy (Jain et al. 2018b). However, although ANI analysis plays a vital role in demarcating species of archaea and bacteria, only a few reports related to viral classification have been documented and its applicability for virus delineation remains unknown.
In the present study, after optimizing parameters (fragment length and cut-off comparison), a total of 685 poxviruses were subjected to the modified ANI analysis. After visualization by Cytoscape, they were divided into three groups, Types I–III, among which, Type I group was completely consistent with ICTV report (Fig. 2). The ANI analysis results for Type II and Type III groups were also supported by phylogenetic analysis that also exhibited distinct branch locations for those members (Figs 4 and 5). Moreover, gene content comparisons, another distinguishing characteristic for species demarcation, concur with ANI analysis as well. Apart from being able to separate poxviruses, the ANI analysis also brought about novel insights into poxvirus delineation. For example, the myxoma virus could be further grouped into three clusters (Fig. 4 and Table S2). The variola virus, vaccinia virus, taterapox virus, camelpox virus, and cowpox viruses could also be proposed to be classified into ‘Mammalian Poxvirus 1’ owing to their close connection (Fig. 2 and Table S2). We also tested this methodology on undocumented poxvirus members to determine the feasibility of this method. Notably, the albatrosspox virus was classified into ‘Canarypox Virus 1’, while the moosepox virus and white-tailed deer poxvirus were classified into ‘Mule Deerpox Virus 2’ (ANI species rank; Fig. 7). Based on this method, a new species, ‘Saltwater Crocodilepox Virus’, may also be proposed (Fig. 7). Collectively, ANI analysis worked well among the sampled poxviruses, serving as a potential method for poxvirus demarcation.
As reported by the ICTV, phylogenetic distance and natural host are the primary criteria used for taxon demarcation of family Poxviridae. Indeed, delineation based on the latter offers a precise description at subfamily rank. For instance, subfamilies Chordopoxvirinae and Entomopoxvirinae are characterized by infecting vertebrates and insects, respectively. However, taxon demarcation based on a natural host at the species rank is still lacking. With the expansion of the host range due to the discovery of newly identified poxvirus isolates, such current methods for taxon delineation will grow increasingly unsuitable for viral classification. For example, although clusters #50 and #51 both belong to Orf Virus, they infect different hosts (Capra Hircus and Ovis Aries). On the other hand, although the molluscum contagiosum virus (cluster #45 and #46) and vaccinia virus (cluster #59 and #60) belong to different species, both can infect Homo sapiens. Interestingly, species demarcation based on ANI analysis may provide a novel approach to solve this since the viruses mentioned in the above examples were separated clearly based on ANI analysis. Thus, our method may be a robust tool and can serve as a framework for demarcation of family Poxviridae at the species rank.
4. Methods
4.1. Genome extraction and filtration
A dataset containing poxvirus genomes (FASTA file) was downloaded from the National Center for Biotechnology Information (NCBI, https://www.ncbi.nlm.nih.gov/labs/virus/vssi/#/). After pre-filtration, a total of 719 complete genomic sequences were obtained. Detailed information is listed in Table S1, including the accession numbers, genomic characteristics, and viral classification. Among them, 685 isolates have their own official taxonomy from the ICTV Master Species List (https://talk.ictvonline.org/files/master-species-lists/; Table S1).
4.2. ANI analysis
The appropriate value of the query fragment length determines the efficiency of FastANI computation and accuracy of ANI estimation. The fragment length for bacterial analysis is usually set as 1,020 base pair (bp) (Konstantinidis and Tiedje 2005; Goris et al. 2007); however, it may be not appropriate for viral analysis since the genomic length of viruses is much smaller than that of bacteria. To further assess the effect of fragment length on FastANI analysis for poxviruses, fragment length ranging from 100 bp to 2,000 bp was tested.
After optimizing the fragment length, the ANI value between pairs of genomes was calculated using FastANI (https://github.com/ParBLiSS/FastANI). The ANI values of 95 per cent and 98 per cent were set as a cutoff to obtain an edge between nodes. The nodes were then assigned to communities using Cytoscape (Shannon et al. 2003) for network visualization. The detailed steps are listed in Table 1.
Table 1.
Steps for ANI calculation based on FastANI.
| Step | Code/software |
|---|---|
| Step 1: ANI calculation | fastANI—ql list.txt—rl list.txt -o out.txt—fragLen X (list.txt: files containing list of reference/query genome files; out.txt: output file; X: fragment length) |
| Step 2: Data filtration | cat out.txt| awk ‘{if($3>=95) print $0}’ > 95filter.txt (ANI value cutoff: 95); cat out.txt| awk ‘{if($3≥98) print $0}’ > 98filter.txt (ANI value cutoff: 98) |
| Step 3: Visualization | Cytoscape |
Due to the lack of reports regarding the use of ANI in viral classification, ANI based on the BLASTN method (ANIb) was employed [implemented in PYANI (Pritchard et al. 2016), v. 0.3.0-alpha as well] to evaluate its accuracy for poxvirus classification. However, in consideration of the incompatibility of ANIb with viral genomes, the medium file was obtained prior to the calculation. Then, it was submitted to modified script. As in the case of FastANI calculation, identity thresholds were set as 95 per cent and 98 per cent. The detailed information is listed in Table 2.
Table 2.
Steps for ANI calculation based on ANI_BLASTN.
| Step | Code/software |
|---|---|
| Step 1: Data preprocessing | average_nucleotide_identity.py -i fasta/ -o out_file -m ANIb -s 200—workers 10 |
| Step 1: ANI calculation (performed by R script) | ani_alnlen = blast_alnlen- blast_gaps
ani_alnids = blast_alnlen- blast_gaps- blast_mismatch
ani_coverage = ani_alnlen /qlen
ani_pid = ani_alnids/qlen
ani_coverage > 0.7 & ani_pid > 0.3 & Delete the duplicate alignment ANIb_percentage_identity = ∑(ani_alnids * blast_pid)/∑ani_alnlen |
| Step 2: Data filtration | cat out.txt| awk ‘{if($3≥95) print $0}’ > 95filter.txt (similarity score cutoff: 95); cat out.txt| awk ‘{if($3≥98) print $0}’ > 98filter.txt (similarity score cutoff: 98) |
| Step 3: Visualization | Cytoscape |
4.3. Phylogenetic analysis
To determine the poxvirus phylogeny, two classification systems, viral proteomic tree (ViPTree) and composition vector phylogenetic tree (CV-Tree) were used. For the former, all the genomic nucleic acid sequences were merged into a single file (All.FASTA) and subsequently submitted to ViPTreeGen (v.1.1.2) (Nishimura et al. 2017). In contrast, re-annotated amino acid sequences generated by Prokka (Seemann 2014) were employed in the latter tree construction. Briefly, the re-annotated amino acid sequences (FASTA format) were directly submitted to CVTree3 Web Server (http://tlife.fudan.edu.cn/cvtree/cvtree/) and K-tuple length was set at 5. Both trees were then annotated by online server Interactive Tree of Life (iTOL) (Letunic and Bork 2007; https://itol.embl.de/). The GC content and genome length were calculated and visualized by seqkit v0.16.1 and ggplot2 package in R (Shen et al. 2016). Finally, the figures were spliced and displayed by Vision 2016 (Chen et al. 2021).
4.4. Evaluation of core genes
In our previous study, a total of twenty-two poxvirus core genes have been identified and four of them have been selected by further substitution saturation analysis and NJ/ML-Trees verification. To assess the role of these 4 genes in poxvirus classification, all the indicated core genes within 685 poxviruses were manually identified. Then, they were submitted to BLAST (2.11.0+) for calculation of the percentage of identical matches. After filtration (thresholds for screening set as 98 per cent and 99 per cent), the matrixes were then assigned to communities using Cytoscape.
Supplementary Material
Contributor Information
Xuyang Xia, State Key Laboratory of Biotherapy and Cancer Center, West China Hospital, Sichuan University, No. 8 Linyin Street, Wuhou District, Chengdu 610000, P. R. China.
Yiqi Deng, State Key Laboratory of Biotherapy and Cancer Center, West China Hospital, Sichuan University, No. 8 Linyin Street, Wuhou District, Chengdu 610000, P. R. China.
Mingde Zhao, Laboratory Animal Center, Southwest Medical University, No. 1, Section 1, Xianglin Road, Longmatan District, Luzhou 64600, P. R. China.
Congwei Gu, Laboratory Animal Center, Southwest Medical University, No. 1, Section 1, Xianglin Road, Longmatan District, Luzhou 64600, P. R. China.
Yi Geng, College of Veterinary Medicine, Sichuan Agricultural University, No. 211 Huimin Road, Wenjiang District, Chengdu 610000, P. R. China.
Jun Wang, Key Laboratory of Sichuan Province for Fishes Conservation and Utilization in the Upper Reaches of the Yangtze River, No. 1124 Dongtong Road, Neijiang 641100, P. R. China.
Qian Yang, Laboratory Animal Center, Southwest Medical University, No. 1, Section 1, Xianglin Road, Longmatan District, Luzhou 64600, P. R. China.
Manli He, Laboratory Animal Center, Southwest Medical University, No. 1, Section 1, Xianglin Road, Longmatan District, Luzhou 64600, P. R. China.
Qihai Xiao, Laboratory Animal Center, Southwest Medical University, No. 1, Section 1, Xianglin Road, Longmatan District, Luzhou 64600, P. R. China.
Wudian Xiao, Laboratory Animal Center, Southwest Medical University, No. 1, Section 1, Xianglin Road, Longmatan District, Luzhou 64600, P. R. China.
Lvqin He, Laboratory Animal Center, Southwest Medical University, No. 1, Section 1, Xianglin Road, Longmatan District, Luzhou 64600, P. R. China.
Sicheng Liang, Department of Gastroenterology, The Affiliated Hospital of Southwest Medical University, No. 25 Taiping Street, Jiangyang District, Luzhou 646000, P. R. China.
Heng Xu, State Key Laboratory of Biotherapy and Cancer Center, West China Hospital, Sichuan University, No. 8 Linyin Street, Wuhou District, Chengdu 610000, P. R. China.
Muhan Lü, Department of Gastroenterology, The Affiliated Hospital of Southwest Medical University, No. 25 Taiping Street, Jiangyang District, Luzhou 646000, P. R. China; Laboratory Animal Center, Southwest Medical University, No. 1, Section 1, Xianglin Road, Longmatan District, Luzhou 64600, P. R. China; Department of Anatomy and Embryology, Faculty of Medicine, University of Tsukuba, 1-1-1 Tennodai, Tsukuba, Ibaraki 305-8575, Japan; School of Comprehensive Human Sciences, Doctoral Program in Biomedical Sciences, University of Tsukuba, 1-1-1 Tennodai, Tsukuba, Ibaraki 305-8575, Japan.
Zehui Yu, Laboratory Animal Center, Southwest Medical University, No. 1, Section 1, Xianglin Road, Longmatan District, Luzhou 64600, P. R. China; Department of Gastroenterology, The Affiliated Hospital of Southwest Medical University, No. 25 Taiping Street, Jiangyang District, Luzhou 646000, P. R. China; School of Basic Medical Sciences, Zhejiang University, No. 866 Yuhangtang Road, Xihu District, Hangzhou 310000, P. R. China.
Data availability
The data used to support the findings of this study are available from the corresponding author upon request.
Supplementary data
Supplementary data is available at Virus Evolution online.
Funding
This work was supported by ‘Luzhou Municipal People’s Government - Southwest Medical University’ Technology Strategy Project (2016LZXNYD-T06, 2020LZXNYD-J45), Opening Fund of Key Laboratory of Sichuan Province for Fishes Conservation and Utilization in the Upper Reaches of the Yangtze River (NJSYKF-002), and Scientific research project of Education Department of Sichuan Province (18ZA0283).
Author contributions
Conceptualization: Z. Y., M. L., Z. D., X. X., and Y. D.; methodology: Z. Y., Z. D., X. X., and Y. D.; software: M. Z., C. G., Y. G., and J. W.; formal analysis: Y. G., Q. Y., M. H., Q. X., and W. X.; investigation: J. W., L. H., S. L., and H. X.; writing—original draft preparation: Z. Y. and Z. D.; writing—review and editing: M. L., X. X., and Y. D.; funding acquisition: M. L., Z. Y., and J. W.
Conflict of interest:
No potential conflicts of interest were disclosed.
References
- Alonso R. C. et al. (2020) ‘Poxviruses Diagnosed in Cattle from Distrito Federal, Brazil (2015-2018)’, Transboundary and Emerging Disease, 67: 1563–73. [DOI] [PubMed] [Google Scholar]
- Altschul S. F. et al. (1997) ‘Gapped BLAST and PSI-BLAST: A New Generation of Protein Database Search Programs’, Nucleic Acids Research, 25: 3389–402. [DOI] [PMC free article] [PubMed] [Google Scholar]
- Buchfink B., Xie C., and Huson D. H. (2015) ‘Fast and Sensitive Protein Alignment Using DIAMOND’, Nature Methods, 12: 59–60. [DOI] [PubMed] [Google Scholar]
- Chen H. N. et al. (2021) ‘Genomic Evolution and Diverse Models of Systemic Metastases in Colorectal Cancer’, Gut, 8: 1–11. [DOI] [PMC free article] [PubMed] [Google Scholar]
- Chun J., and Rainey F. A. (2014) ‘Integrating Genomics into the Taxonomy and Systematics of the Bacteria and Archaea’, International Journal of Systematic and Evolutionary Microbiology, 64: 316–24. [DOI] [PubMed] [Google Scholar]
- Edgar R. C. (2010) ‘Search and Clustering Orders of Magnitude Faster than BLAST’, Bioinformatics, 26: 2460–1. [DOI] [PubMed] [Google Scholar]
- Goris J. et al. (2007) ‘DNA-DNA Hybridization Values and Their Relationship to Whole-genome Sequence Similarities’, International Journal of Systematic and Evolutionary Microbiology, 57: 81–91. [DOI] [PubMed] [Google Scholar]
- Grimont P. A. D. et al. (1980) ‘Reproducibility and Correlation Study of Three Deoxyribonucleic Acid Hybridization Procedures’, Current Microbiology, 4: 325–30. [Google Scholar]
- Gyuranecz M. et al. (2013) ‘Worldwide Phylogenetic Relationship of Avian Poxviruses’, Journal of Virology, 87: 4938–51. [DOI] [PMC free article] [PubMed] [Google Scholar]
- Huss V. A., Festl H., and Schleifer K. H. (1983) ‘Studies on the Spectrophotometric Determination of DNA Hybridization from Renaturation Rates’, Systematic and Applied Microbiology, 4: 184–92. [DOI] [PubMed] [Google Scholar]
- Jain C. et al. (2018a) ‘A Fast Approximate Algorithm for Mapping Long Reads to Large Reference Databases’, Journal of Computational Biology, 25: 766–79. [DOI] [PMC free article] [PubMed] [Google Scholar]
- ——— et al. (2018b) ‘High Throughput ANI Analysis of 90K Prokaryotic Genomes Reveals Clear Species Boundaries’, Nature Communications, 9: 5114. [DOI] [PMC free article] [PubMed] [Google Scholar]
- Kent W. J. (2002) ‘BLAT—the BLAST-like Alignment Tool’, Genome Research, 12: 656–64. [DOI] [PMC free article] [PubMed] [Google Scholar]
- Konstantinidis K. T., and Tiedje J. M. (2005) ‘Genomic Insights that Advance the Species Definition for Prokaryotes’, Proceedings of the National Academy of Sciences of the United States of America, 102: 2567–72. [DOI] [PMC free article] [PubMed] [Google Scholar]
- Lee I. et al. (2016) ‘OrthoANI: An Improved Algorithm and Software for Calculating Average Nucleotide Identity’, International Journal of Systematic and Evolutionary Microbiology, 66: 1100–3. [DOI] [PubMed] [Google Scholar]
- Lefkowitz E. J., Wang C., and Upton C. (2006) ‘Poxviruses: Past, Present and Future’, Virus Research, 117: 105–18. [DOI] [PubMed] [Google Scholar]
- Letunic I., and Bork P. (2007) ‘Interactive Tree of Life (Itol): An Online Tool for Phylogenetic Tree Display and Annotation’, Bioinformatics, 23: 127–8. [DOI] [PubMed] [Google Scholar]
- Moss B. (2013) ‘Poxvirus DNA Replication’, Cold Spring Harbor Perspectives in Biology, 5: 5. [DOI] [PMC free article] [PubMed] [Google Scholar]
- Nishimura Y. et al. (2017) ‘ViPTree: The Viral Proteomic Tree Server’, Bioinformatics, 33: 2379–80. [DOI] [PubMed] [Google Scholar]
- Paez-Espino D. et al. (2016) ‘Uncovering Earth’s Virome’, Nature, 536: 425–30. [DOI] [PubMed] [Google Scholar]
- Pritchard L. et al. (2016) ‘Genomics and Taxonomy in Diagnostics for Food Security: Soft-rotting Enterobacterial Plant Pathogens’, Analytical Methods, 8: 12–24. [Google Scholar]
- Rodriguez R. L. et al. (2020) ‘Iterative Subtractive Binning of Freshwater Chronoseries Metagenomes Identifies over 400 Novel Species and Their Ecologic Preferences’, Environmental Microbiology, 22: 3394–412. [DOI] [PubMed] [Google Scholar]
- Rosselló-Mora R. (2005) ‘Updating Prokaryotic Taxonomy’, Journal of Bacteriology, 187: 6255–7. [DOI] [PMC free article] [PubMed] [Google Scholar]
- Sarker S. et al. (2019) ‘Crocodilepox Virus Evolutionary Genomics Supports Observed Poxvirus Infection Dynamics on Saltwater Crocodile (Crocodylus Porosus)’, Viruses, 11: 1116. [DOI] [PMC free article] [PubMed] [Google Scholar]
- Seemann T. (2014) ‘Prokka: Rapid Prokaryotic Genome Annotation’, Bioinformatics, 30: 2068–9. [DOI] [PubMed] [Google Scholar]
- Shannon P. et al. (2003) ‘Cytoscape: A Software Environment for Integrated Models of Biomolecular Interaction Networks’, Genome Research, 13: 2498–504. [DOI] [PMC free article] [PubMed] [Google Scholar]
- Shen W. et al. (2016) ‘SeqKit: A Cross-Platform and Ultrafast Toolkit for FASTA/Q File Manipulation’, PLoS One, 11: e0163962. [DOI] [PMC free article] [PubMed] [Google Scholar]
- Staley J. T. (2009) ‘Universal Species Concept: Pipe Dream or a Step toward Unifying Biology?’ Journal of Industrial Microbiology & Biotechnology, 36: 1331–6. [DOI] [PubMed] [Google Scholar]
- Yoon S. H. et al. (2017) ‘A Large-scale Evaluation of Algorithms to Calculate Average Nucleotide Identity’, Antonie Van Leeuwenhoek, 110: 1281–6. [DOI] [PubMed] [Google Scholar]
Associated Data
This section collects any data citations, data availability statements, or supplementary materials included in this article.
Supplementary Materials
Data Availability Statement
The data used to support the findings of this study are available from the corresponding author upon request.


