Abstract
To reduce the carbon dioxide (CO2) concentration in the atmosphere, natural rubber (NR) was developed as a rubber foam for CO2 adsorption. Although the CO2 adsorption capacity of the NR latex foam produced by mixing with a cake mixer (CM) was higher than that produced with an overhead stirrer (OS), both capacity values were still low. To improve the CO2 adsorption capacity, the use of unmodified and (3-aminopropyl)triethoxysilane-modified silica particles as fillers in the CM rubber foam matrix was examined. The highest CO2 adsorption capacity, from a mixed gas flow rate of 100 mL min−1 at ambient temperature and pressure, was obtained with the CM foam filled with 5 parts by weight per hundred parts of rubber filled with modified silica particles (4.08 mg g−1). The CO2 adsorption capacity of this foam was approximately 1.11- and 2.87-fold higher than that of the CM foam filled with unmodified silica particles (3.69 mg g−1) and unfilled CM rubber (1.42 mg g−1), respectively. Morphological analysis supported that the cell size and number of pores per cell of the NR latex foam, which were higher in the CM foams than the OS foams, were important factors for evaluating CO2 adsorption. In addition to physisorption between CM and CO2, chemisorption between the modified silica particles and CO2 increased the CO2 adsorption capacity.
To reduce the carbon dioxide (CO2) concentration in the atmosphere, natural rubber (NR) was developed as a rubber foam for CO2 adsorption.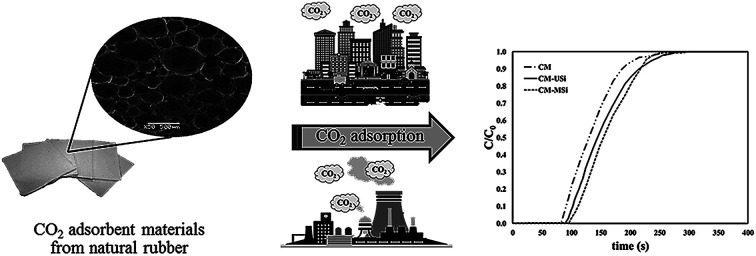
1. Introduction
The atmospheric carbon dioxide (CO2) concentration has increased continuously over the last century and has become a worldwide issue, being a major contributor to global climate change. Recently, CO2 capture and storage methods have been considered as a key option for the mitigation of the impact of increasing CO2;1–3 these approaches include absorption,4,5 adsorption,6–8 cryogenic methods,9,10 membrane separation,10–12 and CO2 reduction and utilization.13,14 Among these, the removal of CO2 from CO2-containing streams in industrial processes is considered to be effective. Solid sorbents are usually used, such as metal oxides (calcium oxide, magnesium oxide, and lithium zirconate); however, these sorbents require high temperature for both CO2 adsorption and regeneration of the adsorbent.15–17 However, the possibility to capture CO2 directly from the atmosphere is of outstanding importance for the future development of this technology. Therefore, in this study, an alternative material is presented to potentially replace the current metal oxide adsorbents.
Microporous organic polymers (MOPs)18,19 are a relatively new class of porous materials that have a large surface area, small pore size, and low skeletal density.20 This type of material has already been used for various applications, such as gas storage, gas separation, catalysis, sensing, clean energy, CO2 capture and so on.21–25 However, to make MOPs eco-friendlier, the development of natural polymers is an alternative choice for CO2 capture.
Natural rubber (NR) is a natural commodity that has tremendous economic and strategic importance due to its unique characteristics such as a high strength, flexibility, and elasticity.26 In addition, the NR latex foam can be used as a good absorbent material, including as a chemical,27 sound28 and oil29,30 absorbent. However, in general, rubber products cannot be used at high temperatures due to their low thermal properties. Silica is a reinforcing filler that is widely used in rubber products,31,32 since it can improve not only the mechanical but also the thermal properties of rubber products,33 and it has been reported to be an important physisorption material for CO2 adsorption.34,35 However, the selectivity of CO2 adsorption is low due to the absence of active sites for CO2 capture. Therefore, amine-modified silica was investigated in this study to enhance the adsorption capacity and selectivity for CO2.
Based on the literature studies, NR latex foam is not widely used as a gas adsorbent especially for CO2. This is an importance of this work to present the unique properties of NR for CO2 capture. Accordingly, the originality of this work was the preparation of an alternative material for CO2 capture using NR, because NR can be easily formed into a highly porous foam for trapping gases or liquids. Moreover, NR is an eco-friendly material, compared to conventional solid sorbents, and can be used in various applications at ambient temperature and pressure. CO2 is generally released from diverse sources, such as vehicles, industrial factories, or everyday life of humans. Thus, NR has potential as a solid sorbent in the preparation of CO2 capture materials. In contrast, conventional CO2 capture materials are typically developed as solid states that are suitable only for use at high temperatures. Until now, there have been only a few reports on the use of NR composite materials as potential CO2 adsorbents,36 and a mechanism for CO2 adsorption in NR composite materials is still required. Accordingly, the aim of this study was to develop an eco-friendly material for CO2 adsorption at ambient temperature and pressure. The NR latex foam was prepared using either an overhead stirrer or cake mixer, designated as OS or CM, respectively. To improve the CO2 adsorption performance of the CM, it was filled with either unmodified silica (CM-USi) or (3-aminopropyl)triethoxysilane (APTES)-modified silica (CM-MSi). The MSi particles were characterized by Fourier-transform infrared spectroscopy (FT-IR) and transmission electron microscopy (TEM). The morphology of the OS, CM, CM-USi, and CM-MSi foams were also studied by scanning electron microscopy (SEM). The effects of the mixed gas (12.88 (v/v) CO2/nitrogen (N2)) flow rate on the CO2 adsorption performance of the different NR latex foams with or without the USi or MSi filling were investigated using a stainless-steel reactor at ambient temperature and pressure. Finally, the mechanism for CO2 adsorption by the different NR latex foams is proposed.
2. Experimental
2.1. Materials
NR latex with a 60% dry rubber content was used as a raw material. The chemicals for rubber compounding, such as potassium oleate (K-oleate) as a surface active agent, sulfur as a crosslinking agent, zinc diethylthiocarbonate (ZDEC) as an accelerator, zinc 2-mercaptobenzothiazone (ZMBT) as an accelerator, Wingstay L (butylated reaction product of para cresol and dicyclopentadiene) as an antidegradant, diphenyl guanidine (DPG) as an accelerator, zinc oxide (ZnO) as an activator, and sodium silicofluoride (SSF) as an gelling agent, were purchased from the Rubber Research Institute, Bangkok, Thailand and dispersed in water. Tetraethoxysilane (TEOS), used as a silica precursor, and APTES, used as a modifying agent, were from Sigma-Aldrich (Saint Louis, USA). Ammonia solution (28 wt%), used as a basic catalyst, and absolute ethanol (EtOH), used as a solvent, were purchased from Qrec Chemical Ltd. (Chonburi, Thailand). All chemical reagents were used as received without purification.
2.2. Preparation of MSi particles
The MSi particles were prepared by mixing 0.013 mol TEOS, 0.702 mol EtOH, 0.052 mol ammonia solution, 0.389 mol deionized water and 0.007 mol APTES at ambient temperature and stirring for 24 h.33 For preparation of the USi particles, APTES was not added to the solution. The obtained USi or MSi particles were then separated by centrifugation, washed in deionized water, and dried in an oven at 110 °C. The idealized mechanism for silica modification by APTES is shown schematically below.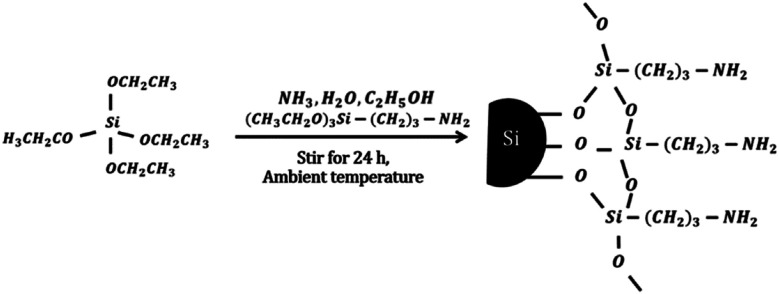
2.3. Rubber foam preparation
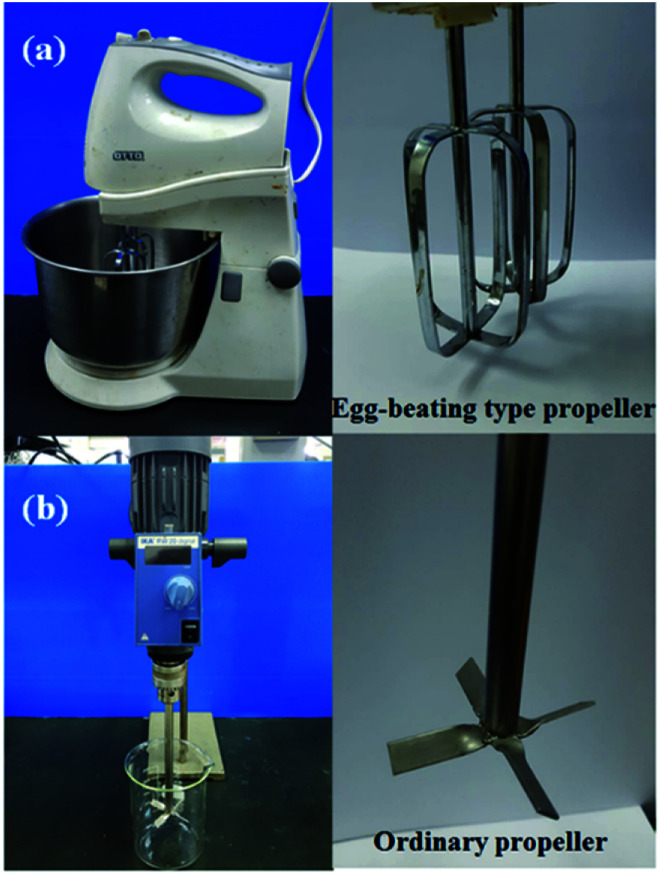
Table 1 shows the formulation of the NR compound. First, the K-oleate dispersion was added to the NR latex and beaten for 10 min by either CM or OS to make a foam as shown in Fig. 1. The rotation speeds of CM and OS were at 100 and 500 revolutions per minute (rpm). Then the sulfur, ZDEC, ZMBT, Wingstay L, DPG, ZnO and SSF dispersions were slowly added and continuously beaten for 2 min. The total NR compound volume after mixing by CM increased five-fold, while that by OS increased two-fold compared to the initial volume. The rubber compound was then poured into a glass mold and cured in a hot-air oven at 100 °C for 2 h to cure, washed with water to eliminate the unreacted chemicals and dried in a hot-air oven at 70 °C for 20 h. For preparation of the filled CM composite foam, USi or MSi particles were initially mixed with the K-oleate, and thereafter the same procedure was performed as above to prepare the CM-USi or CM-MSi composites, respectively.
Formulation for the NR latex foam compoundg.
| Ingredient | CMa (phr)b | OSc (phr) | CM-USi (phr) | CM-MSi (phr) |
|---|---|---|---|---|
| 60% DRC NR latexd | 100 | 100 | 100 | 100 |
| 10% K-oleate dispersion | 15 | 15 | 15 | 15 |
| 50% sulfur dispersion | 4 | 4 | 4 | 4 |
| 50% ZDEC dispersion | 2 | 2 | 2 | 2 |
| 50% ZMBT dispersion | 2 | 2 | 2 | 2 |
| 50% Wingstay L dispersion | 2 | 2 | 2 | 2 |
| 33% DPG dispersion | 2 | 2 | 2 | 2 |
| 50% ZnO dispersion | 10 | 10 | 10 | 10 |
| 12.5% SSF dispersion | 8 | 8 | 8 | 8 |
| USie | — | — | 5 | — |
| MSif | — | — | — | 5 |
NR latex foam prepared by cake mixer.
Parts by weight per hundred parts of rubber.
NR latex foam prepared by overhead stirrer.
All chemicals are calculated based on 60% dry rubber content (DRC) of the NR latex.
Unmodified silica particles.
Modified silica particles by (3-aminopropyl)triethoxysilane (APTES).
Conditions: the rubber compound was mixed at ambient temperature and cured for 2 h at 100 °C.
Fig. 1. The feature of the (a) cake mixer with egg-beating type propeller and (b) overhead stirrer with ordinary propeller.
2.4. Characterization
The functional groups of the MSi particles were characterized by FT-IR (PerkinElmer, Shelton, USA) analysis. Each sample was prepared in a KBr disk under high pressure, and the FT-IR spectra were recorded from 4000 to 400 cm−1 at a resolution of 4 cm−1. The carbon, hydrogen, and nitrogen contents on the silica surface were examined by a PerkinElmer (PE-2400, Waltham, USA) CHNS/O elemental analyzer. The morphology of the MSi particles was examined by TEM (FEI TECNAI T20, Eindhoven, Netherland), operated at 120 kV. The samples were suspended in EtOH and then dropped onto a copper grid to dry at room temperature. The morphology of each NR latex foam was also studied by SEM (JEOL, JSM-6480LV, Tokyo, Japan) at an accelerating voltage of 15 kV. The samples were placed on a stub and coated with gold before measurement.
2.5. CO2 adsorption–desorption performance
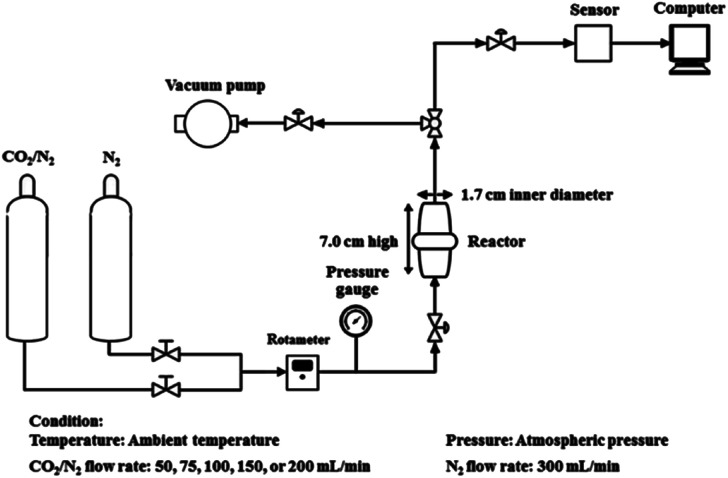
Fig. 2 shows a schematic representation of the experimental apparatus used to determine the CO2 adsorption. In order to eliminate any physisorbed or chemisorbed CO2 in the sorbent materials, the dried sorbent material (2.0 g) was treated under vacuum at 60 °C, packed into a stainless-steel reactor (1.7 cm-inner-diameter and 7.0 cm-height), and treated under vacuum followed by a N2 flow (300 mL min−1). The gas flow was then switched to a mixed gas (12.88 : 87.12 (v/v) CO2 : N2) at various flow rates (75, 100, 150 and 200 mL min−1). The CO2 adsorption capacity was calculated based on the difference between the total inlet and outlet CO2 amounts. The mean residence time was determined by flowing the mixed gas (12.88 : 87.12 (v/v) CO2 : N2) through the stainless steel reactor without any sorbent. Therefore, the CO2 adsorption capacity was directly proportional to the area difference above the CO2 breakthrough curves. The adsorption process was operated at atmospheric pressure and ambient temperature. The released CO2 from the reactor was measured via an online sensor (K33 BLG sensor, Florida, USA).
Fig. 2. Schematic representation of the CO2 adsorption apparatus used in this study.
The regeneration of the sorbent material was performed by a combination of vacuum and temperature swing adsorption processes in the stainless-steel reactor. The sorbent material was heated at 60 °C under a reduced pressure condition with a N2 flow rate of 10 mL min−1 and then cooled down to ambient temperature. After that, the sorbent material was subjected to a repeat CO2 adsorption process. This CO2 adsorption–desorption was continued for 12 cycles in this study.
3. Results and discussion
3.1. Characterization of the MSi particles
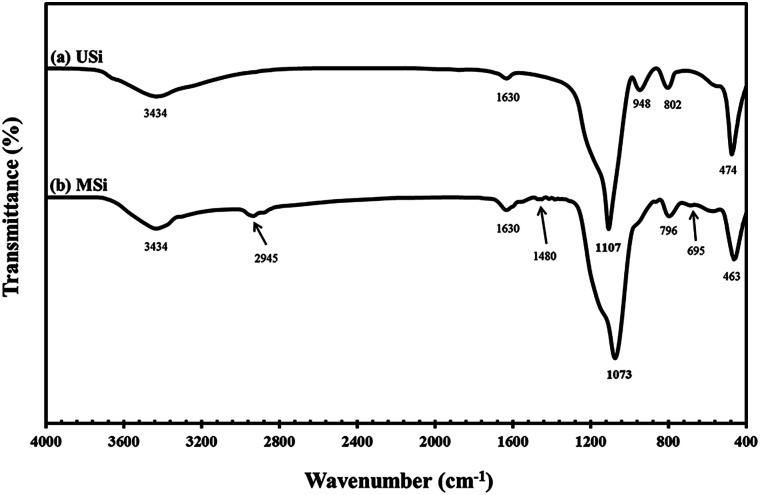
Representative FT-IR spectra of the USi and MSi particles are shown in Fig. 3. The O–OH stretching of moisture and SiO–H stretching of USi appeared at 3434 cm−1.37–39 Furthermore, the absorption band corresponding to the deformation vibrations of the adsorbed water molecules appeared at 1630 cm−1, while the Si–O in-plane stretching vibrations of the silanol Si–OH group appeared at 948 cm−1.37–39 Additionally, the characteristic peaks of the Si–O–Si asymmetric, symmetric, and bending modes of silica were shown at 1107, 802, and 474 cm−1, respectively.40
Fig. 3. Representative FT-IR spectra of the (a) USi and (b) MSi particles.
After the modification of the silica surface with APTES to yield the MSi particles, additional absorption bands were observed at 2945 cm−1 and 1480 cm−1, which represent the C–H stretching vibration41 and NH2 deformation of hydrogen-bonded amine groups, respectively.42 The band at 695 cm−1 was attributed to the Si–C stretching vibration of the methyl group bonded to a silicon atom.43 However, the –NH2 groups at 3300–3800 cm−1 were not evident in the MSi particles due to the interference of moisture or water molecules.44Table 2 shows the elemental analysis of the USi and MSi particles, where the USi particles showed a hydrogen content of only 1.09 wt%, which came from the water adsorbed on the USi particles' surface. After modification, the C, H, N contents were increased, supporting that the modification of the silica particles by APTES was completely achieved.
The elemental analysis (by weight) and particle size of the unmodified (USi) and modified (MSi) silica particles.
| Sample | Elemental analysisa (wt%) | Particle sizeb (nm) | ||
|---|---|---|---|---|
| C | H | N | ||
| USi | 0.00 | 1.09 | 0.00 | 176 ± 23 |
| MSi | 10.88 | 3.28 | 3.98 | 208 ± 36 |
By CHN analysis.
By TEM analysis.
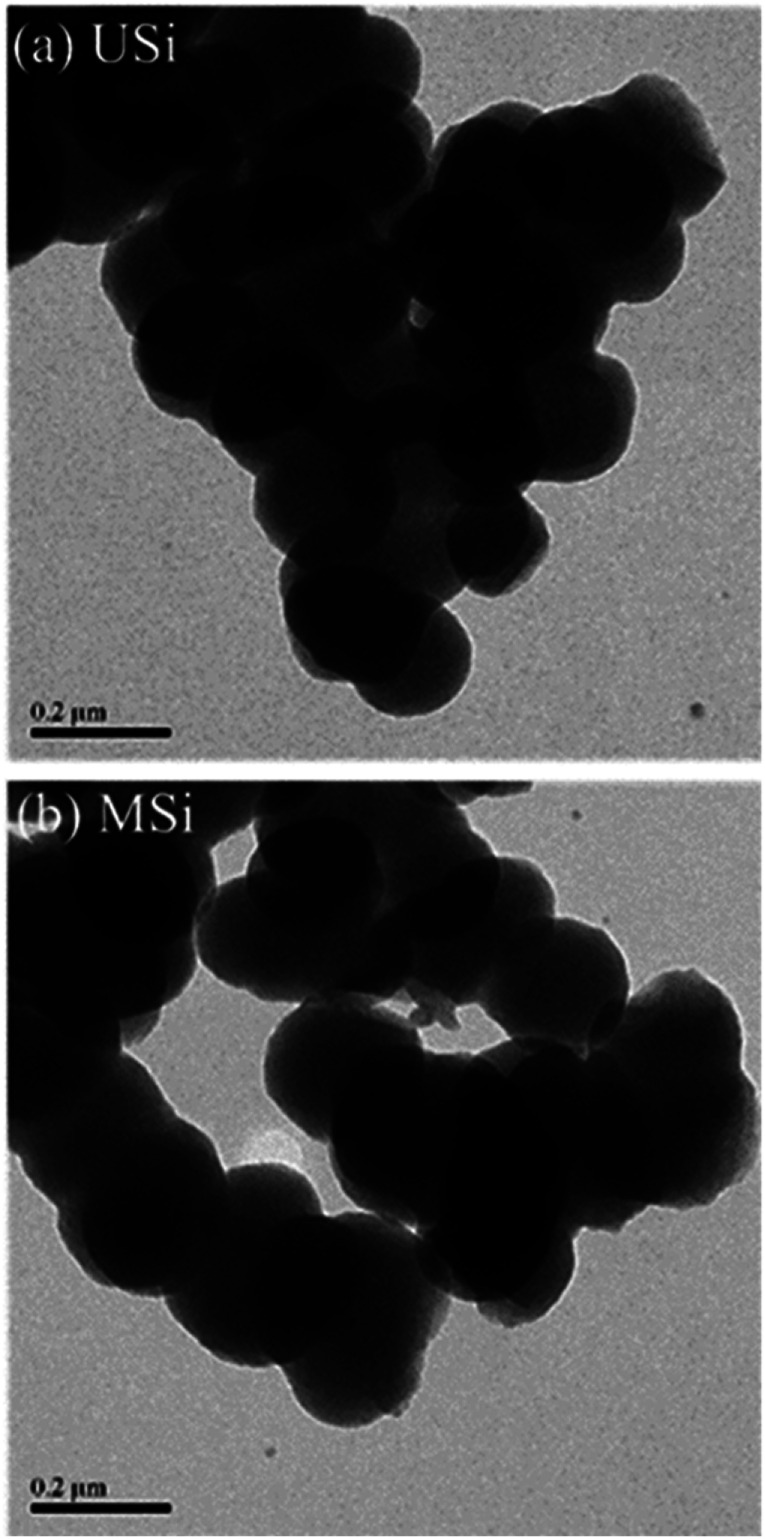
Fig. 4 shows the morphology of the USi and MSi particles as observed by TEM. The USi and MSi particles were of a uniform spherical shape, with average anhydrous particle sizes of about 176 ± 23 nm and 208 ± 36 nm, respectively. The fact that the size of the MSi particles was larger (ca. 1.18-fold) than that of the USi particles was due to the organic group of the APTES modifier covering the silica surface.
Fig. 4. Representative TEM micrographs (19 000× magnification; scale bar = 0.2 μm) of the (a) USi and (b) MSi particles.
3.2. Characterization of the different NR (OS and CM) foams
The NR latex foams were prepared by OS and CM in order to evaluate the effect of the NR latex foam morphology on the CO2 adsorption performance. The morphologies of the OS and CM rubber foams are shown in Fig. 5. Both types of the NR latex foam showed a spherical-shaped open cell structure, but the cell size of the OS foam (78 ± 29 μm) was about 4.3-fold smaller than that of the CM foam (338 ± 33 μm). It is interesting to note that the number of pores per cell in the CM foam was more than that in the OS foam. Moreover, the cells in the OS foam were generally interconnected with each other, which may have decreased the available surface area of the sorbent material for CO2 adsorption. In contrast, the cells of the CM foam showed a well-defined cell wall45 and a large capacity for potential CO2 capture. The morphology of the CM foam after filling with USi or MSi particles was similar to that of the neat CM foam (Fig. 5(c) and (d)).
Fig. 5. Representative SEM micrographs (50 000× magnification; scale bar = 500 μm) of the NR latex foam formed by (a) OS and (b) CM, and of the CM foam filled with either (c) USi or (d) MSi particles by different techniques.
3.3. CO2 adsorption performance
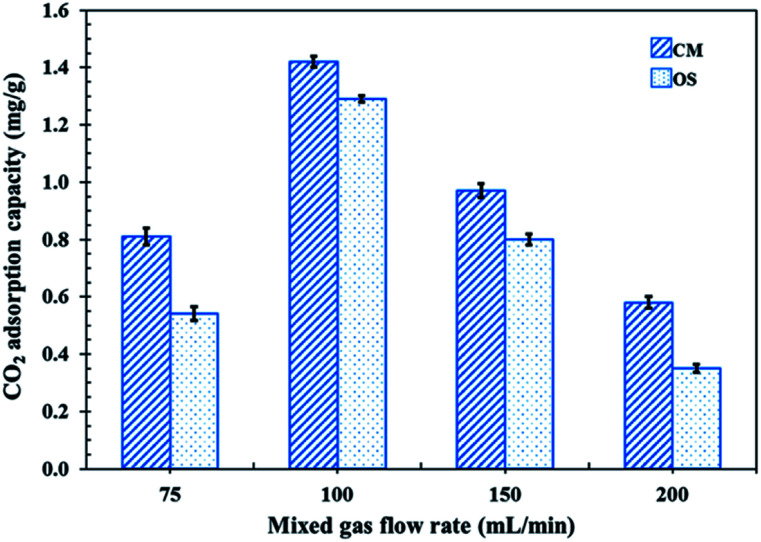
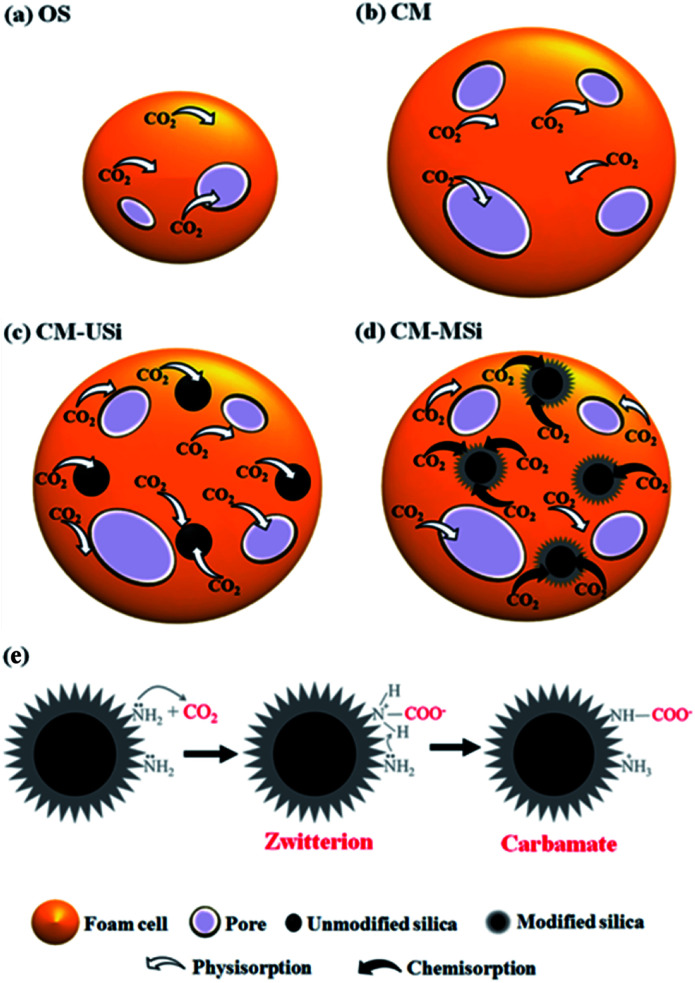
In order to test the CO2 adsorption performance of the different prepared NR latex foams, they were evaluated in a mixed gas flow in a stainless-steel reactor at ambient temperature and pressure. The effects of the mixed gas flow rate on the CO2 adsorption capacity of the different NR latex foams were evaluated. The CO2 adsorption capacity of the OS and CM foams increased when the mixed gas flow rate was increased from 75 to 100 mL min−1 (Fig. 6), which was due to the increased driving force of the mixed gas through the NR latex foam. However, the CO2 adsorption capacity of both types of the NR latex foam gradually decreased as the mixed gas flow rate increased above 100 mL min−1. This may be because at a higher mixed gas flow rate a shorter residence time was obtained.8 Interestingly, the CO2 adsorption capacity of the CM foam was higher than that of the OS foam at all mixed gas flow rates, which was presumably due to the higher number of pores per cell able to capture more CO2, whereas the OS foam had a smaller cell size with a lower number of pores per cell (Fig. 7). The only interaction between CO2 and the different NR latex foams was physisorption. Accordingly, in this study, the CM foam was chosen to evaluate the effect of the addition of USi or MSi fillers in an attempt to improve the CO2 adsorption capacity.
Fig. 6. CO2 adsorption capacity of the CM and OS foams at different mixed gas flow rates (50, 75, 100, 150 and 200 mL min−1) under ambient temperature and pressure.
Fig. 7. Proposed mechanisms of CO2 adsorption for the (a) OS, (b) CM, (c) CM-USi and (d) CM-MSi foams, and (e) chemisorption between CO2 and modified silica in CM-MSi foam.
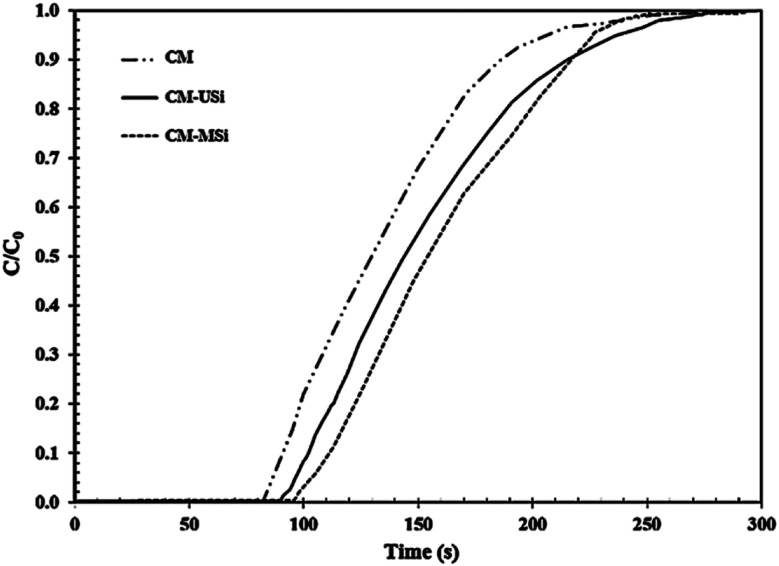
Fig. 8 shows the breakthrough curves of the CM-USi and CM-MSi foams. A breakthrough curve shows the relationship between the ratios of the CO2 concentration at the outlet to the initial CO2 concentration at the inlet of the reactor (C/C0) over time. Initially, no CO2 was detected in the outlet gas because the inlet CO2 was completely adsorbed on the respective NR latex foam. The breakthrough time (the time at which the effluent CO2 concentration reaches a 10% allowable breakthrough concentration46) increased when the CM foam was filled with either USi or MSi particles, and was ranked in the order CM-MSi > CM-USi > CM. Thereafter, the curves slowly and continuously increased, since the CO2 adsorption performance slowly decreased, resulting in an increasing CO2 concentration in the outlet gas. Finally, the curves became constant at 1.0 (outlet CO2 concentration equals that of the inlet) because the adsorbents were saturated with CO2. The total CO2 adsorption capacity was calculated from the area above the breakthrough curves and is shown in Table 3. The CO2 adsorption capacity of the CM-MSi foam was clearly the highest followed by that of the CM-USi foam and these were 2.87 and 2.6-fold higher, respectively, than that of CM foam. These results indicated that the high adsorption capacity of the CM-MSi foam was due not only to physisorption between CO2 and the CM foam, but also to chemisorption between CO2 and the amine groups to form a carbamate on the surface of the MSi particles,47,48 whereas the only interaction between CO2 and the CM-USi foam was physisorption (Fig. 7).
Fig. 8. Breakthrough curves of the NR latex foam, and the rubber composite of the CM foam filled with either USi (CM-USi) or MSi (CM-MSi) particles at a mixed gas flow rate of 100 mL min−1 under ambient temperature and pressure.
CO2 adsorption capacity of the different NR latex foams (OS and CM) and the CM foam filled with either USi or MSi particles, at a mixed gas flow rate of 100 mL min−1 under ambient temperature and pressure.
| Sample | CO2 adsorption capacitya (mg g−1) |
|---|---|
| OSb | 1.29 ± 0.1 |
| CMc | 1.42 ± 0.3 |
| CM-USid | 3.69 ± 0.2 |
| CM-MSie | 4.08 ± 0.2 |
mg of CO2 per g of adsorbent.
NR latex foam prepared by overhead stirrer.
NR latex foam prepared by cake mixer.
NR latex foam prepared by cake mixer filled with unmodified silica particles.
NR latex foam prepared by cake mixer filled with silica particles modified by (3-aminopropyl)triethoxysilane (APTES).
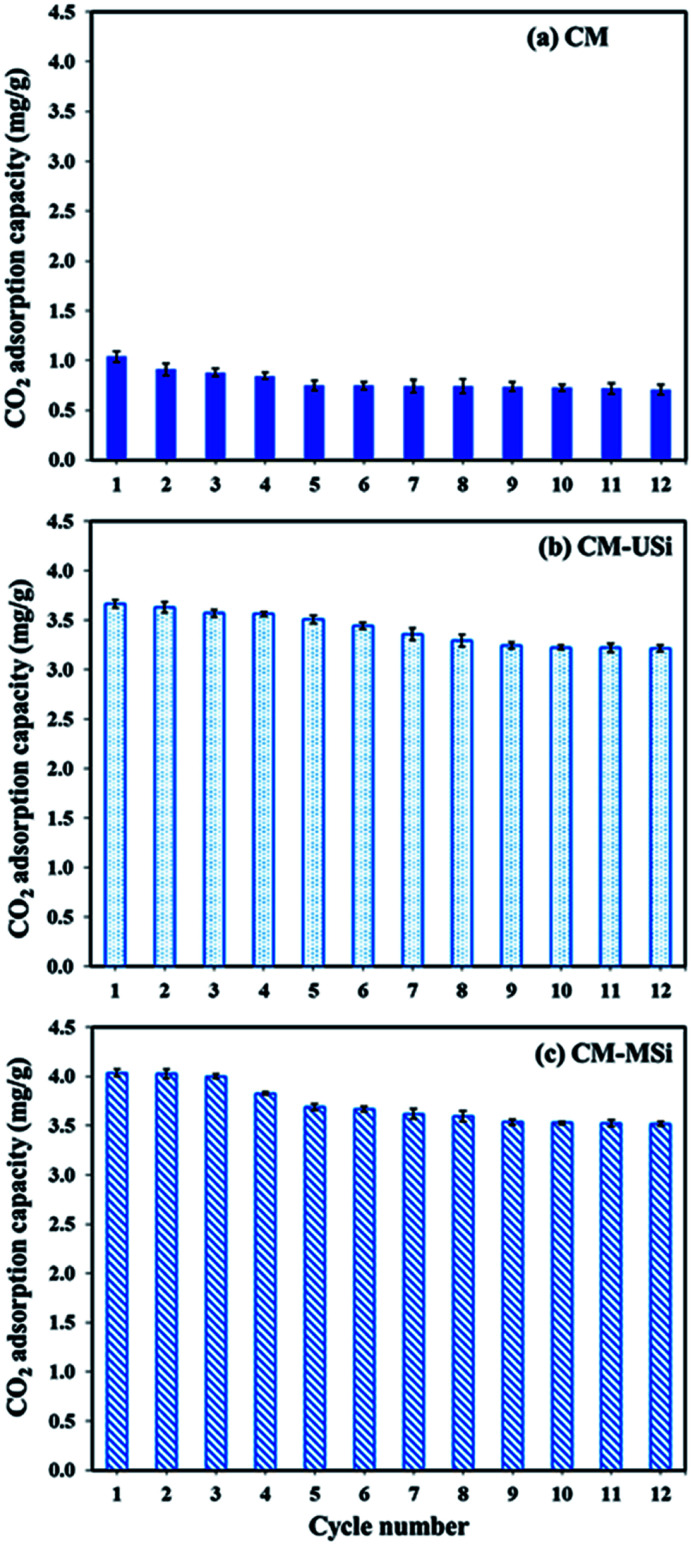
Fig. 9 shows the CO2 adsorption–desorption of CM, CM-USi and CM-MSi foams over 12 successive cycles. The CO2 adsorption capacity of the CM foam dropped 27.9% after five cycles of regeneration, while the CO2 adsorption capacity of CM-USi and CM-MSi foams decreased by 11.9 and 12.4% after 10 and 9 cycles of regeneration, respectively. This suggested that CM-USi and CM-MSi foams exhibited a better regenerative ability than the CM foam. Accordingly, the presence of USi or MSi particles gave a higher stability to reuse the sorbent materials compared to the CM foam. However, when comparing the overall regeneration performance of all the sorbents, the CO2 adsorption capacity dropped to constant values without a further decrease in the CO2 adsorption capacity. This shows the advantage when using these sorbent materials in a real operation.
Fig. 9. The CO2 uptake of (a) CM, (b) CM-USi and (c) CM-MSi foams over 12 adsorption–desorption cycles; adsorption: a mixed gas flow rate of 100 mL min−1 under ambient temperature and pressure; desorption: 60 °C under vacuum for 20 min.
Table 4 shows the comparison of CO2 adsorption capacities of various sorbent materials. Each sorbent material showed the different CO2 adsorption capacities due to the different surface properties, nature of sorbent material (porous powder, film, or foam) or testing condition. When comparing the capture capacity of various kinds of sorbent material, CM-MSi can be a candidate for using as a solid sorbent because the adsorbent can be prepared as the green and non-toxic adsorbent material. In addition, this material still can modify to further increase the CO2 capture capacity.
Comparison of CO2 adsorption capacities of various sorbent materials.
| Sorbent materials | Temperature (°C) | Pressure (bar) | CO2 adsorption capacity (mg g−1) | Ref. |
|---|---|---|---|---|
| Polyamide-6 | 25 | 1.0 | 1.00 | 49 |
| PA/CNT-PEI-100a | 25 | 1.0 | 10.0 | 49 |
| MCM-41 | 30 | 0.1 | 5.28 | 50 |
| S12b | 40 | 1.0 | 9.24 | 51 |
| N-OMPsc | 25 | 0.15 | 29.5 | 52 |
| CM-MSid | Ambient | 1.0 | 4.08 | This study |
Polyamide-6/carbon nanotube composite impregnated with polyethyleneimine (100 wt%).
Nano silica particles with the particle size of 12 nm.
Nitrogen-doped ordered mesoporous polymers.
NR latex foam prepared by cake mixer filled with silica particles modified by (3-aminopropyl)triethoxysilane (APTES).
4. Conclusions
In this study, NR-based composite materials were designed and developed for CO2 capture at ambient temperature and pressure. Based on a SEM analysis, the CM foam showed a larger cell size with many pores per cell, resulting in a higher CO2 adsorption capacity compared to the OS foam. The optimum condition to obtain the highest CO2 adsorption capacity of the CM foam (1.42 mg g−1) was the use of the mixed gas (12.88 : 87.12 (v/v) CO2 : N2) at a flow rate of 100 mL min−1 at ambient temperature and pressure. To further improve the CO2 adsorption performance of the CM foam, USi or MSi particles were filled in the rubbery matrix, whereupon the CO2 adsorption capacity increased by more than 2.6 and 2.87-fold, respectively, compared to the unfilled CM foam. The high adsorption capacity of CM-MSi was due to the presence of both physical and chemical adsorption, while the interaction of CO2 and CM-USi represented only physical adsorption. Accordingly, the CM-MSi composite foam can be used as a solid sorbent or designed for CO2 capture in high CO2 release areas, such as gas stations, car parks, traffic jams or hospitals.
Conflicts of interest
The authors have declared no conflict of interest.
Supplementary Material
Acknowledgments
The authors gratefully acknowledge the funding support from the Thailand Research Fund (Grant No. RSA6180030) and Malaysia-Thailand Joint Authority (MTJA), Research Cess Fund.
References
- Leesona D. Dowell N. M. Shaha N. Petit C. Fennell P. S. Int. J. Greenhouse Gas Control. 2017;61:71–84. doi: 10.1016/j.ijggc.2017.03.020. [DOI] [Google Scholar]
- Yu C. H. Huang C. H. Tan C. S. Aerosol Air Qual. Res. 2012;12:745–769. doi: 10.4209/aaqr.2012.05.0132. [DOI] [Google Scholar]
- D'Alessandro D. M. Smit B. Long J. R. Angew. Chem., Int. Ed. 2010;49:6058–6082. doi: 10.1002/anie.201000431. [DOI] [PubMed] [Google Scholar]
- De Rivaa J. Suarez-Reyes J. Morenoa D. Díaz I. Ferroa V. Palomar J. Int. J. Greenhouse Gas Control. 2017;61:61–70. doi: 10.1016/j.ijggc.2017.03.019. [DOI] [Google Scholar]
- Kim H. Shi H. Lee J. Y. Int. J. Greenhouse Gas Control. 2016;45:181–188. doi: 10.1016/j.ijggc.2015.12.024. [DOI] [Google Scholar]
- Hauchhum L. Mahanta P. Int. J. Energy Environ. Eng. 2014;5:349–356. doi: 10.1007/s40095-014-0131-3. [DOI] [Google Scholar]
- Lee K. M. Lim Y. H. Park C. J. Jo Y. M. Ind. Eng. Chem. Res. 2012;51:1355–1363. doi: 10.1021/ie2013532. [DOI] [Google Scholar]
- Wang X. Chen L. Guo Q. Chem. Eng. J. 2015;260:573–581. doi: 10.1016/j.cej.2014.08.107. [DOI] [Google Scholar]
- Song C. F. Kitamura Y. Li S. H. Ogasawara K. Int. J. Greenhouse Gas Control. 2012;7:107–114. doi: 10.1016/j.ijggc.2012.01.004. [DOI] [Google Scholar]
- Belaissaoui B. Moullec Y. L. Willson D. Favre E. J. Membr. Sci. 2012;415–416:424–434. doi: 10.1016/j.memsci.2012.05.029. [DOI] [Google Scholar]
- Gao X. Zou X. Ma H. Meng S. Zhu G. Adv. Mater. 2014;26:3644–3648. doi: 10.1002/adma.201400020. [DOI] [PubMed] [Google Scholar]
- Wang R. Zhang H. Y. Feron P. H. M. Liang D. T. Sep. Purif. Technol. 2005;46:33–40. doi: 10.1016/j.seppur.2005.04.007. [DOI] [Google Scholar]
- Zhao G. Huang X. Wang X. Wang X. J. Mater. Chem. A. 2017;5:21625–21649. doi: 10.1039/C7TA07290B. [DOI] [Google Scholar]
- Zhao G. Zhou W. Sun Y. Wang X. Liu H. Meng X. Chang K. Ye J. Appl. Catal., B. 2018;226:252–257. doi: 10.1016/j.apcatb.2017.12.054. [DOI] [Google Scholar]
- Abbasi E. Hassanzadeh A. Zarghami S. Arastoopour H. Abbasian J. Fuel. 2014;137:260–268. doi: 10.1016/j.fuel.2014.07.088. [DOI] [Google Scholar]
- Wang C. Dou B. Song Y. Chen H. Xu Y. Xie B. Ind. Eng. Chem. Res. 2014;53:12744–12752. doi: 10.1021/ie502042p. [DOI] [Google Scholar]
- Gunathilake C. Jaroniec M. J. Mater. Chem. A. 2016;4:10914–10924. doi: 10.1039/C6TA03916B. [DOI] [Google Scholar]
- Saleh T. A., Advanced Nanomaterials for Water Engineering, Treatment, and Hydraulics, IGI Global, 2017, ISBN13: 9781522521365 [Google Scholar]
- Saleh T. A. and Gupta V. K., Nanomaterial and Polymer Membranes: Synthesis, Characterization, and Applications, Elsevier, 2016, ISBN: 978-0128047033 [Google Scholar]
- Martín C. F. Stöckel E. Clowes R. Adams D. J. Cooper A. I. Pis J. J. Rubiera F. Pevida C. J. Mater. Chem. 2011;21:5475–5483. doi: 10.1039/C0JM03534C. [DOI] [Google Scholar]
- Xiang Z. Cao D. J. Mater. Chem. A. 2013;2:2691–2718. doi: 10.1039/C2TA00063F. [DOI] [Google Scholar]
- Zou X. Zhu G. Adv. Mater. 2018;30:1700750. doi: 10.1002/adma.201700750. [DOI] [PubMed] [Google Scholar]
- McKeown N. B. Budd P. M. Chem. Soc. Rev. 2006;35:675–683. doi: 10.1039/B600349D. [DOI] [PubMed] [Google Scholar]
- Saleh T. A. Sari A. Tuzen M. J. Environ. Chem. Eng. 2017;5:1079–1088. doi: 10.1016/j.jece.2017.01.032. [DOI] [Google Scholar]
- Saleh T. A. Ali S. J. Environ. Chem. Eng. 2018;6:5361–5368. doi: 10.1016/j.jece.2018.08.033. [DOI] [Google Scholar]
- Baranwal K. C. and Stephens H. L., Basic Elastomer Technology, Rubber Division, Akron, 1st edn, 2001 [Google Scholar]
- Johns J. Rao V. Int. J. Polym. Mater. Polym. Biomater. 2011;60:766–775. doi: 10.1080/00914037.2010.551361. [DOI] [Google Scholar]
- Zhang X. Lu Z. Tian D. Li H. Lu C. Appl. Polym. Sci. 2013;127:4006–4014. doi: 10.1002/app.37721. [DOI] [Google Scholar]
- Tomyangkul S. Pongmuksuwan P. Harnnarongchai W. Chaochanchaikul K. J. Reinf. Plast. Compos. 2016;35:672–681. doi: 10.1177/0731684415627295. [DOI] [Google Scholar]
- Riyajan S. A. Keawittarit P. Polym. Int. 2016;65:491–502. doi: 10.1002/pi.5062. [DOI] [Google Scholar]
- Rattanasoma N. Saowapark T. Deeprasertkul C. Polym. Test. 2007;26:369–377. doi: 10.1016/j.polymertesting.2006.12.003. [DOI] [Google Scholar]
- Prasertsri S. Rattanasom N. Polym. Test. 2012;31:593–605. doi: 10.1016/j.polymertesting.2012.03.003. [DOI] [Google Scholar]
- Tunlert A. Prasassarakich P. Poompradub S. Mater. Chem. Phys. 2016;173:78–88. doi: 10.1016/j.matchemphys.2016.01.041. [DOI] [Google Scholar]
- Belmabkhout Y. Serna-Guerrero R. Sayari A. Chem. Eng. Sci. 2009;64:3721–3728. doi: 10.1016/j.ces.2009.03.017. [DOI] [Google Scholar]
- Franchi R. S. Harlick P. J. E. Sayari A. Ind. Eng. Chem. Res. 2005;44:8007–8013. doi: 10.1021/ie0504194. [DOI] [Google Scholar]
- Perera D. G. P. M. Kumanayaka T. O. Walpalage S. Int. J. Sci. Res. 2015;5:1–5. [Google Scholar]
- Oweini R. A. Rassy H. E. J. Mol. Struct. 2009;919:140–145. doi: 10.1016/j.molstruc.2008.08.025. [DOI] [Google Scholar]
- Saleh T. A. Desalin. Water Treat. 2015;57:10730–10744. doi: 10.1080/19443994.2015.1036784. [DOI] [Google Scholar]
- Saleh T. A. Environ. Sci. Pollut. Res. 2015;22:16721–16731. doi: 10.1007/s11356-015-4866-z. [DOI] [PubMed] [Google Scholar]
- Hegde N. D. Rao A. V. Appl. Surf. Sci. 2006;253:1566–1572. doi: 10.1016/j.apsusc.2006.02.036. [DOI] [Google Scholar]
- Donia A. M. Atia A. A. Daher A. M. Desouky O. A. Elshehy E. A. Int. J. Miner. Process. 2011;101:81–88. doi: 10.1016/j.minpro.2011.07.010. [DOI] [Google Scholar]
- Hsu S. C. Lu C. Su F. Zeng W. Chen W. Chem. Eng. Sci. 2010;65:1354–1361. doi: 10.1016/j.ces.2009.10.005. [DOI] [Google Scholar]
- Hernández G. Rodríguez R. J. Non-Cryst. Solids. 1999;246:209–215. doi: 10.1016/S0022-3093(99)00073-3. [DOI] [Google Scholar]
- Theppradit T. Prasassarakich P. Poompradub S. Mater. Chem. Phys. 2014;148:940–948. doi: 10.1016/j.matchemphys.2014.09.003. [DOI] [Google Scholar]
- Lim H. M. Amir-Hashim M. Y. J. Rubber Res. 2011;14:41–50. [Google Scholar]
- Su F. Lu C. Kuo S. C. Zeng W. Energy Fuels. 2010;24:1441–1448. doi: 10.1021/ef901077k. [DOI] [Google Scholar]
- Linneen N. N. Pfeffer R. Lin Y. S. Chem. Eng. J. 2014;254:190–197. doi: 10.1016/j.cej.2014.05.087. [DOI] [Google Scholar]
- Yao M. Dong Y. Feng X. Hu X. Jia A. Xie G. Hu G. Lu J. Luo M. Fan M. Fuel. 2014;123:66–72. doi: 10.1016/j.fuel.2014.01.059. [DOI] [Google Scholar]
- Zainab G. Iqbal N. Babar A. A. Huang C. Wang X. Yu J. Ding B. Compos. Commun. 2017;6:41–47. doi: 10.1016/j.coco.2017.09.001. [DOI] [Google Scholar]
- Mello M. R. Phanon D. Silveira G. Q. Llewellyn P. L. Ronconi C. M. Microporous Mesoporous Mater. 2011;143:174–179. doi: 10.1016/j.micromeso.2011.02.022. [DOI] [Google Scholar]
- Arelloano I. H. Huang J. Pendleton P. RSC Adv. 2015;5:65074–65083. doi: 10.1039/C5RA12738F. [DOI] [Google Scholar]
- Liu F. Huang K. Wu Q. Dai S. Adv. Mater. 2017;29(1–8):1700445. doi: 10.1002/adma.201700445. [DOI] [PubMed] [Google Scholar]


